| Param | Original file | Final file |
|---|---|---|
| Filename | modeM0/AS1A11_097T17_9000005074_35445cztM0_level2.evt | modeM0/AS1A11_097T17_9000005074_35445cztM0_level2_quad_clean.evt |
| Size (bytes) | 497,888,640 | 84,908,160 |
| Size | 474.8 MB | 81.0 MB |
| Events in quadrant A | 2,648,952 | 556,771 |
| Events in quadrant B | 4,586,098 | 550,499 |
| Events in quadrant C | 4,089,838 | 537,883 |
| Events in quadrant D | 3,371,613 | 531,772 |
| Mode M9 | |||
|---|---|---|---|
| Quadrant | BADHDUFLAG | Total packets | Discarded packets |
| A | 0 | 23 | 0 |
| B | 0 | 23 | 0 |
| C | 0 | 23 | 0 |
| D | 0 | 24 | 0 |
| Mode M0 | |||
|---|---|---|---|
| Quadrant | BADHDUFLAG | Total packets | Discarded packets |
| A | 0 | 11719 | 3 |
| B | 0 | 17686 | 2 |
| C | 0 | 15720 | 10 |
| D | 0 | 13932 | 2 |
| Mode SS | |||
|---|---|---|---|
| Quadrant | BADHDUFLAG | Total packets | Discarded packets |
| A | 0 | 112 | 0 |
| B | 0 | 112 | 0 |
| C | 0 | 112 | 0 |
| D | 0 | 112 | 0 |
| Quadrant | Total seconds | Saturated seconds | Saturation percentage |
|---|---|---|---|
| A | 5643 | 5 | 0.088605% |
| B | 5643 | 262 | 4.642920% |
| C | 5641 | 391 | 6.931395% |
| D | 5643 | 195 | 3.455609% |
Noise dominated data is calculated using 1-second bins in cleaned event files. If a bin has >2000 counts, and if more than 50% of those come from <1% of pixels, then it is considered to be noise-dominated and hence unusable.
| Quadrant | # 1 sec bins | Bins with >0 counts | Bins with >2000 counts | High rate bins dominated by noise | Noise dominated (total time) | Noise dominated (detector-on time) | Marked lightcurve |
|---|---|---|---|---|---|---|---|
| A | 7256 | 5644 | 0 | 0 | 0.00% | 0.00% | 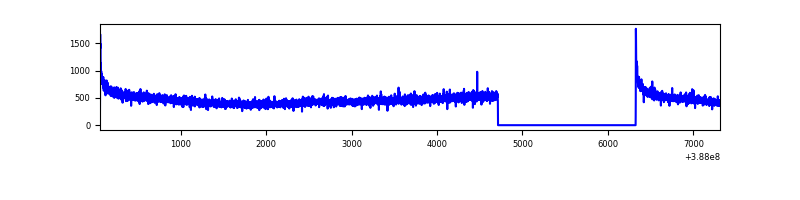 |
| B | 7256 | 5644 | 140 | 140 | 1.93% | 2.48% | 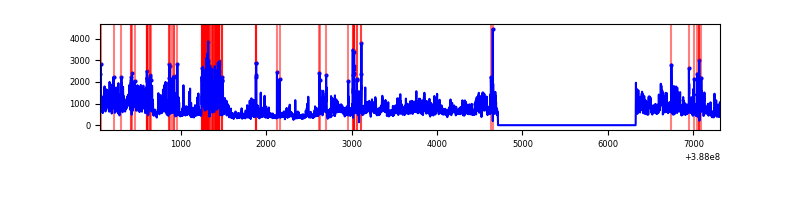 |
| C | 7256 | 5643 | 264 | 264 | 3.64% | 4.68% | 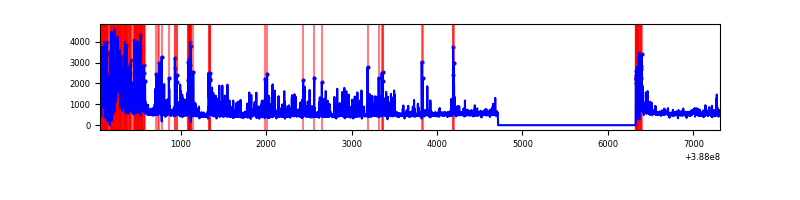 |
| D | 7256 | 5644 | 153 | 153 | 2.11% | 2.71% | 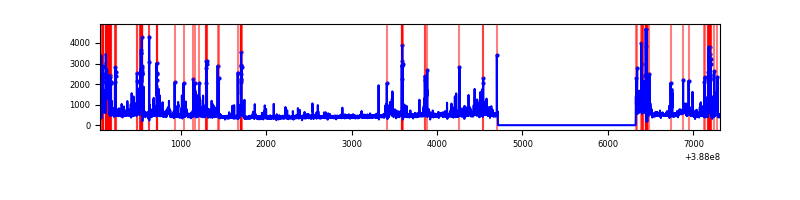 |
Top three noisy pixels from each quadrant. If the there are fewer than three noisy pixels in the level2.evt file, extra rows are filled as -1
| Pixel properties | Quadrant properties | ||||||
|---|---|---|---|---|---|---|---|
| Quadrant | DetID | PixID | Counts | Sigma | Mean | Median | Sigma |
| A | 10 | 83 | 125663 | 962.18 | 647 | 633 | 129.9 |
| A | 13 | 6 | 17832 | 132.36 | 647 | 633 | 129.9 |
| A | 3 | 137 | 6932 | 48.47 | 647 | 633 | 129.9 |
| B | 4 | 251 | 1568942 | 12661.88 | 638 | 621 | 123.9 |
| B | 5 | 236 | 205353 | 1652.91 | 638 | 621 | 123.9 |
| B | 5 | 172 | 167592 | 1348.04 | 638 | 621 | 123.9 |
| C | 4 | 254 | 678499 | 4677.06 | 619 | 624 | 144.9 |
| C | 0 | 10 | 641256 | 4420.1 | 619 | 624 | 144.9 |
| C | 15 | 214 | 224711 | 1546.11 | 619 | 624 | 144.9 |
| D | 13 | 249 | 248771 | 1629.28 | 627 | 610 | 152.3 |
| D | 7 | 80 | 134256 | 877.44 | 627 | 610 | 152.3 |
| D | 2 | 250 | 106127 | 692.77 | 627 | 610 | 152.3 |
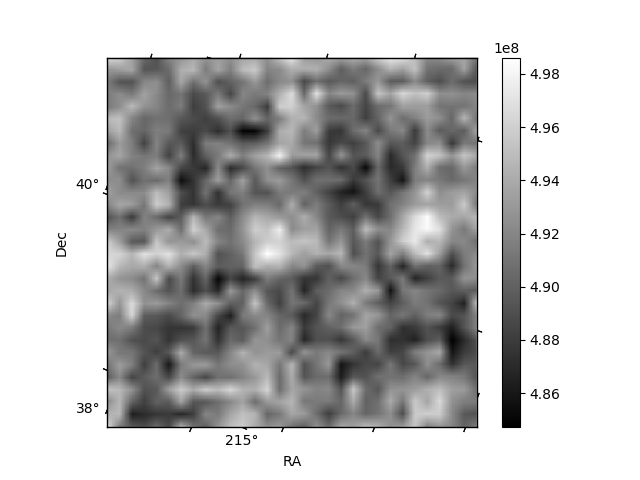
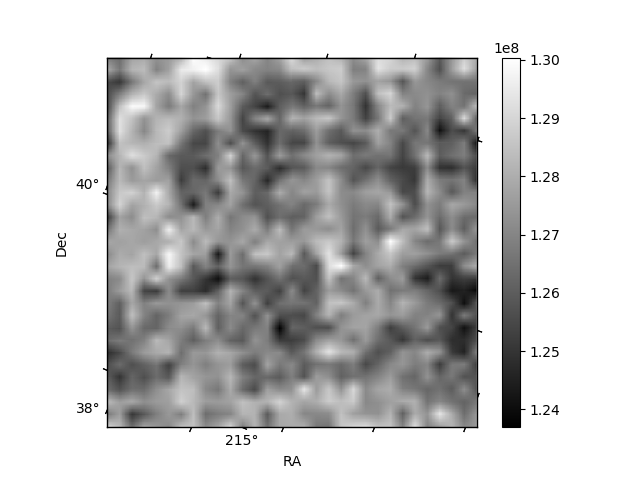
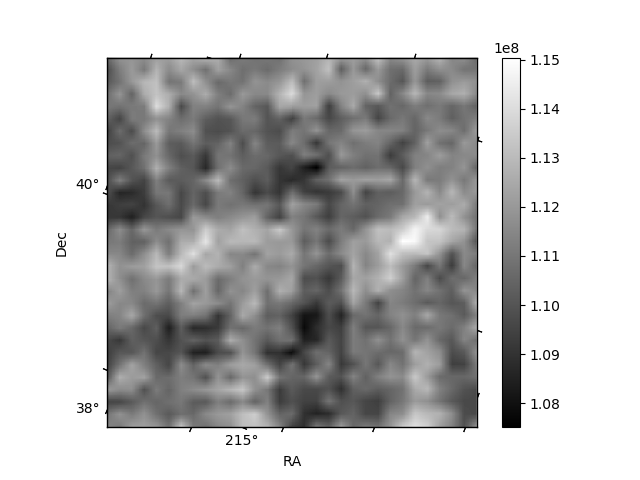
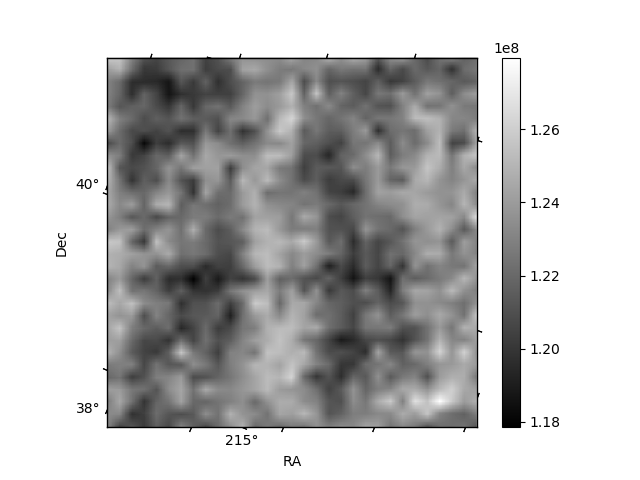
Histogram calculated using DETX and DETY for each event in the final _common_clean file
| Quadrant A | 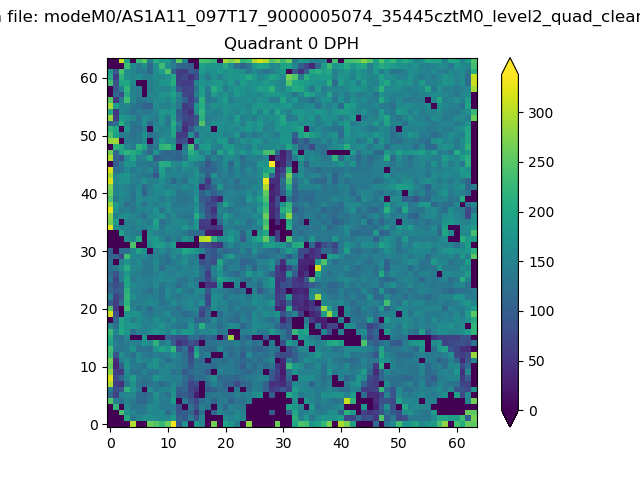 |
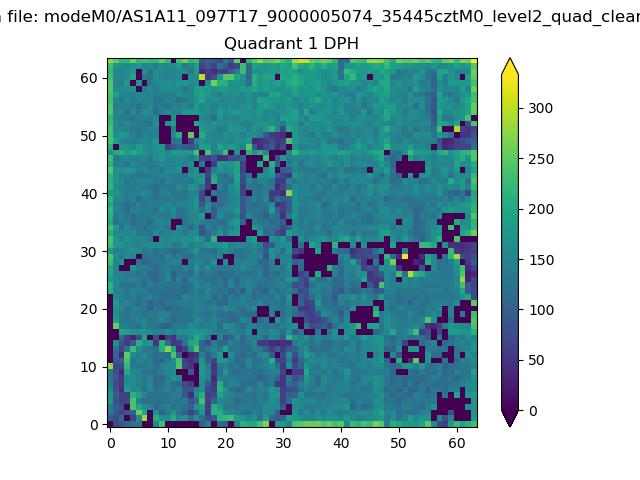 |
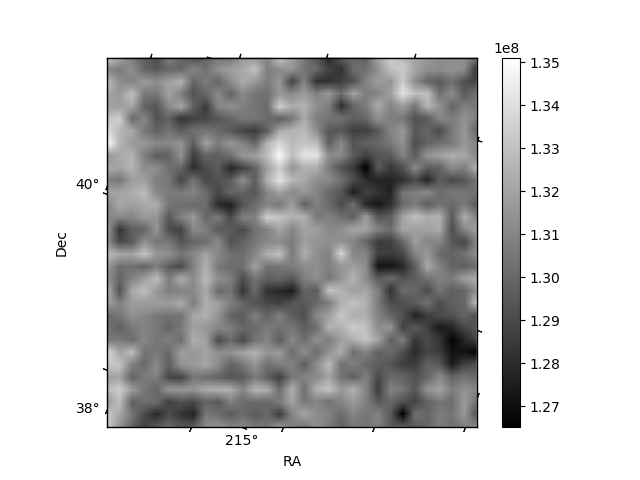
Quadrant B |
|---|---|---|---|
| Quadrant D | 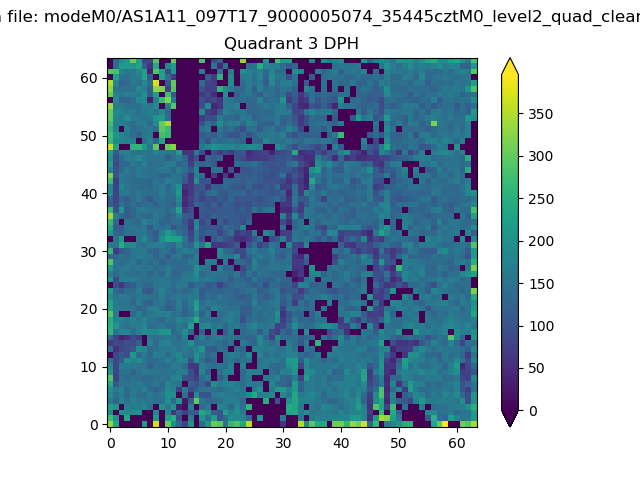 |
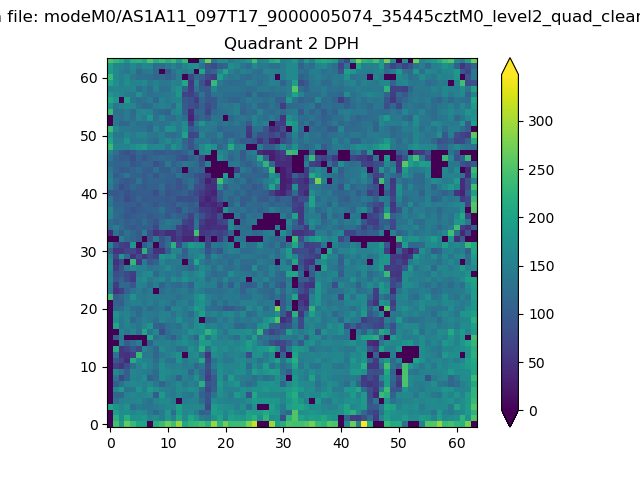 |
Quadrant C |
| Plot type | Count rate plots | Images |
|---|---|---|
| Comparison with Poisson distribution Blue bars denote a histogram of data divided into 1 sec bins. Red curve is a Poisson curve with rate = median count rate of data. |
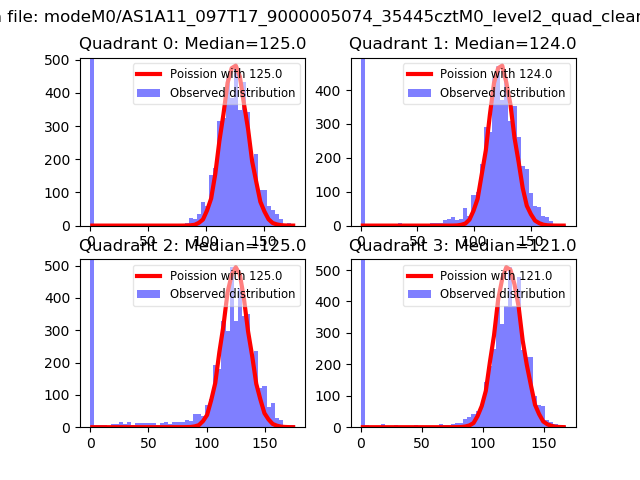 |
 |
| Quadrant-wise count rates Data is divided into 100 sec bins |
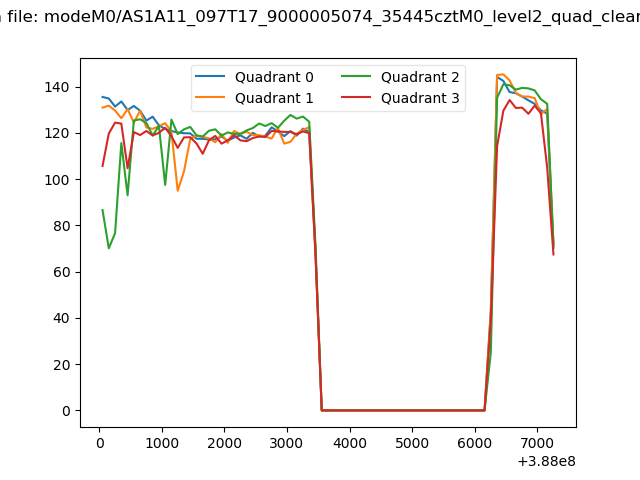 |
|
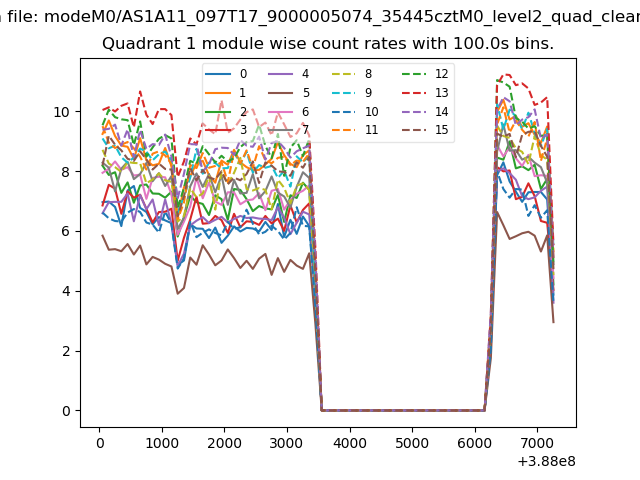
| Module-wise count rates for Quadrant A Data is divided into 100 sec bins |
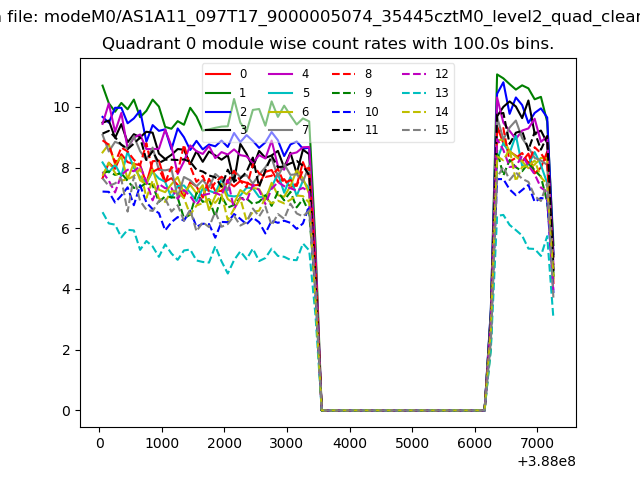 |
 |
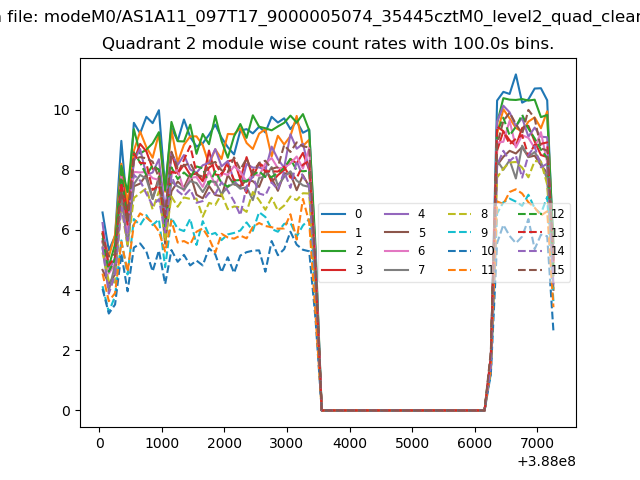
| Module-wise count rates for Quadrant B Data is divided into 100 sec bins |
 |
 |
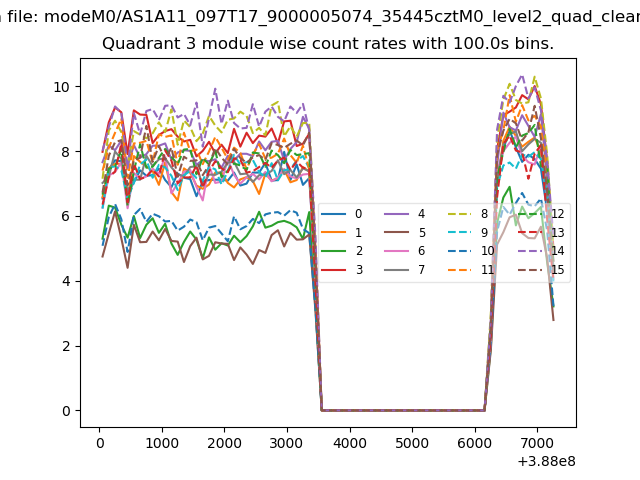
| Module-wise count rates for Quadrant C Data is divided into 100 sec bins |
 |
 |
| Module-wise count rates for Quadrant D Data is divided into 100 sec bins |
 |
 |
| Parameter | Plot |
|---|---|
| CZT HV Monitor | 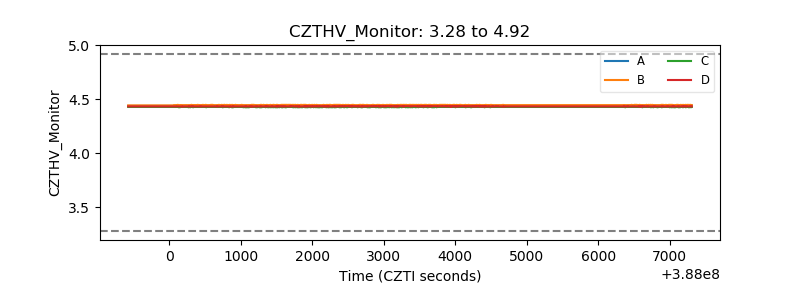 |
| D_VDD | 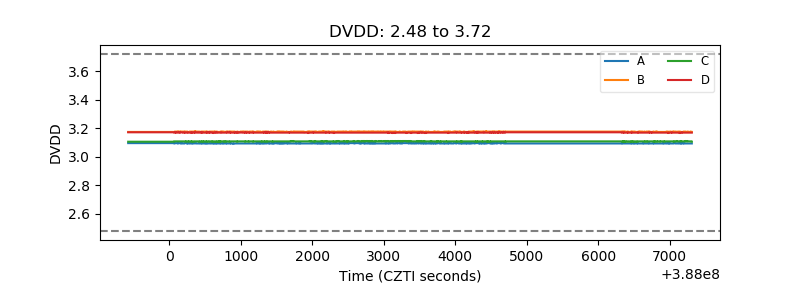 |
| Temperature 1 | 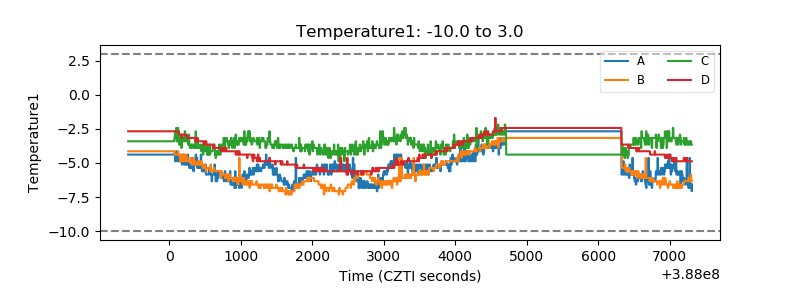 |
| Veto HV Monitor | 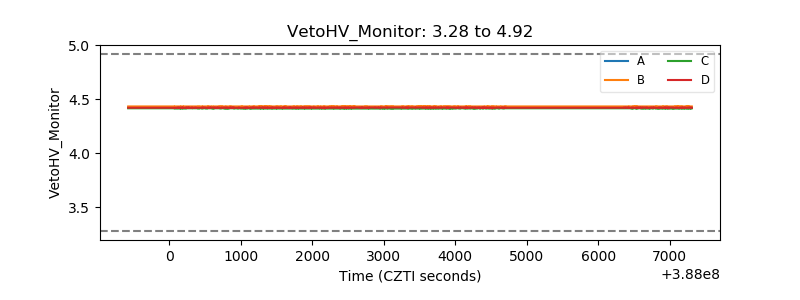 |
| Veto LLD | 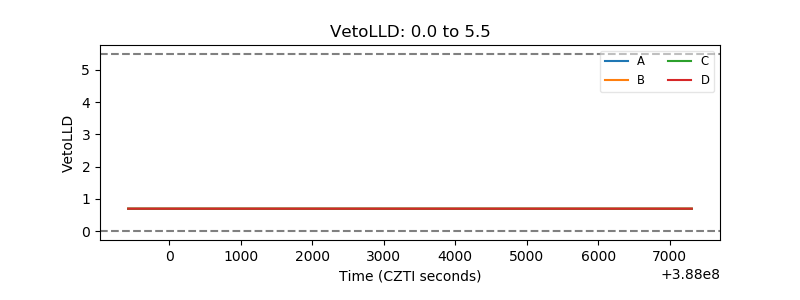 |
| Alpha Counter | 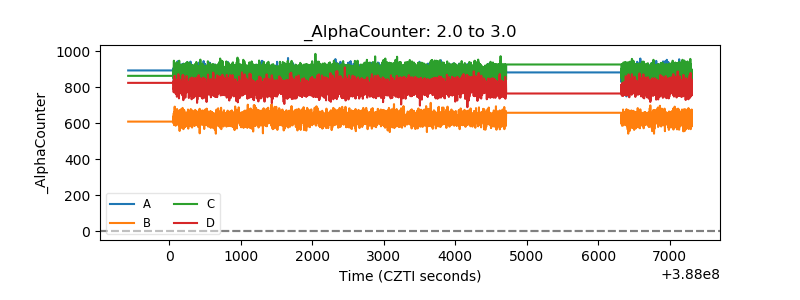 |
| _CPM_Rate | 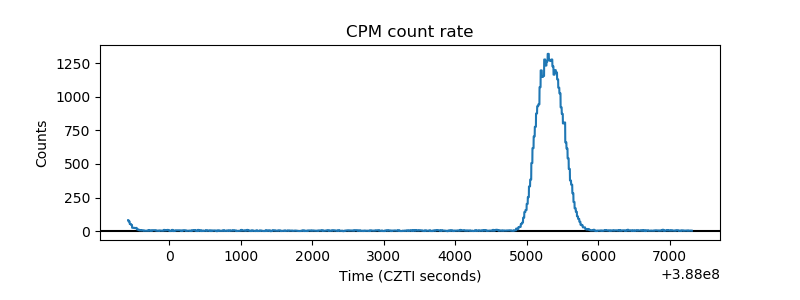 |
| CZT Counter | 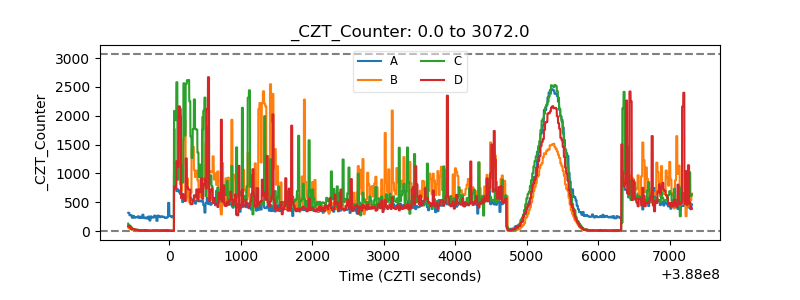 |
| +2.5 Volts monitor | 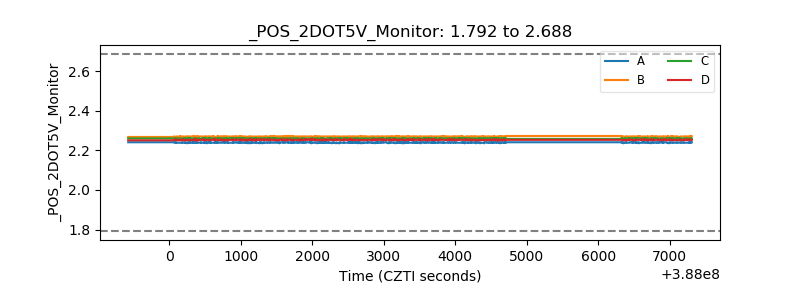 |
| +5 Volts monitor | 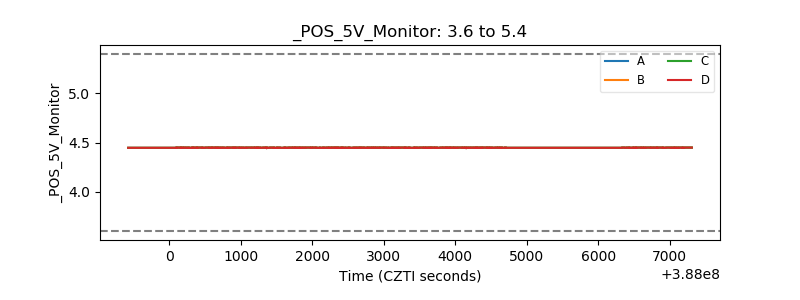 |
| _ROLL_ROT |  |
| _Roll_DEC | 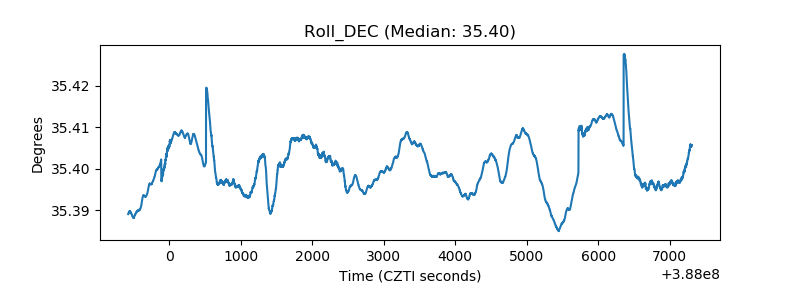 |
| _Roll_RA | 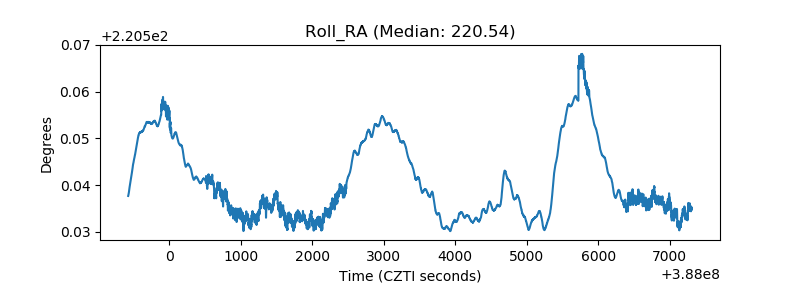 |
| Veto Counter |  |