| Param | Original file | Final file |
|---|---|---|
| Filename | modeM0/AS1A11_097T17_9000005074_35438cztM0_level2.evt | modeM0/AS1A11_097T17_9000005074_35438cztM0_level2_quad_clean.evt |
| Size (bytes) | 495,898,560 | 51,275,520 |
| Size | 472.9 MB | 48.9 MB |
| Events in quadrant A | 2,463,284 | 311,084 |
| Events in quadrant B | 5,511,115 | 294,278 |
| Events in quadrant C | 3,137,462 | 299,426 |
| Events in quadrant D | 3,561,505 | 290,481 |
| Mode M9 | |||
|---|---|---|---|
| Quadrant | BADHDUFLAG | Total packets | Discarded packets |
| A | 0 | 35 | 0 |
| B | 0 | 35 | 0 |
| C | 0 | 35 | 0 |
| D | 0 | 36 | 0 |
| Mode M0 | |||
|---|---|---|---|
| Quadrant | BADHDUFLAG | Total packets | Discarded packets |
| A | 0 | 10405 | 3 |
| B | 0 | 19799 | 2 |
| C | 0 | 12288 | 2 |
| D | 0 | 13980 | 2 |
| Mode SS | |||
|---|---|---|---|
| Quadrant | BADHDUFLAG | Total packets | Discarded packets |
| A | 0 | 104 | 0 |
| B | 0 | 104 | 0 |
| C | 0 | 104 | 0 |
| D | 0 | 104 | 0 |
| Quadrant | Total seconds | Saturated seconds | Saturation percentage |
|---|---|---|---|
| A | 5089 | 5 | 0.098251% |
| B | 5089 | 620 | 12.183140% |
| C | 5089 | 152 | 2.986834% |
| D | 5089 | 118 | 2.318727% |
Noise dominated data is calculated using 1-second bins in cleaned event files. If a bin has >2000 counts, and if more than 50% of those come from <1% of pixels, then it is considered to be noise-dominated and hence unusable.
| Quadrant | # 1 sec bins | Bins with >0 counts | Bins with >2000 counts | High rate bins dominated by noise | Noise dominated (total time) | Noise dominated (detector-on time) | Marked lightcurve |
|---|---|---|---|---|---|---|---|
| A | 7093 | 5090 | 0 | 0 | 0.00% | 0.00% | 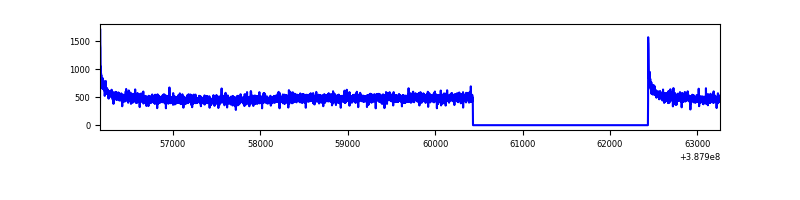 |
| B | 7093 | 5090 | 430 | 430 | 6.06% | 8.45% | 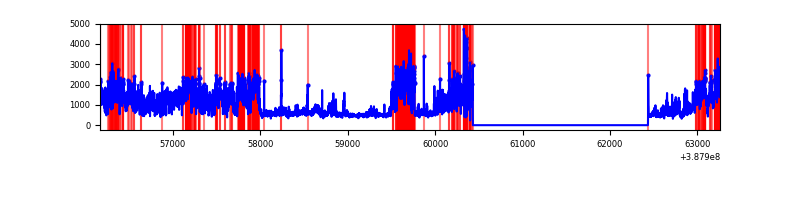 |
| C | 7093 | 5090 | 122 | 122 | 1.72% | 2.40% | 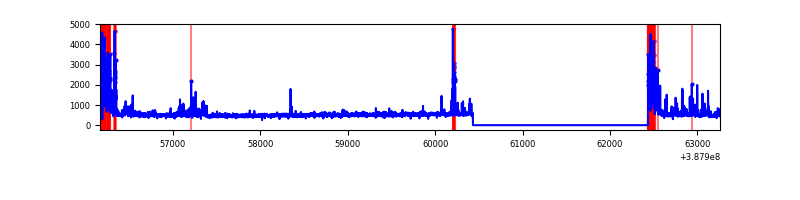 |
| D | 7093 | 5089 | 79 | 79 | 1.11% | 1.55% | 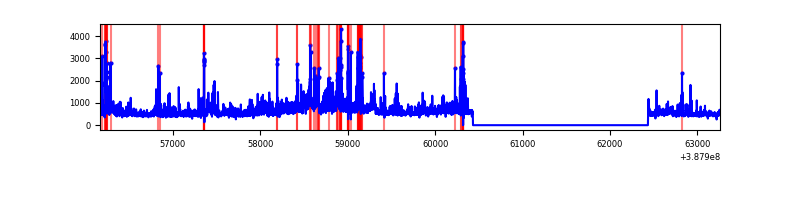 |
Top three noisy pixels from each quadrant. If the there are fewer than three noisy pixels in the level2.evt file, extra rows are filled as -1
| Pixel properties | Quadrant properties | ||||||
|---|---|---|---|---|---|---|---|
| Quadrant | DetID | PixID | Counts | Sigma | Mean | Median | Sigma |
| A | 10 | 83 | 123298 | 1003.18 | 603 | 591 | 122.3 |
| A | 13 | 6 | 9126 | 69.78 | 603 | 591 | 122.3 |
| A | 13 | 254 | 7385 | 55.54 | 603 | 591 | 122.3 |
| B | 4 | 251 | 2261083 | 20284.26 | 579 | 565 | 111.4 |
| B | 5 | 236 | 585235 | 5246.41 | 579 | 565 | 111.4 |
| B | 5 | 31 | 112328 | 1002.88 | 579 | 565 | 111.4 |
| C | 0 | 10 | 429632 | 3246.02 | 573 | 578 | 132.2 |
| C | 15 | 214 | 209299 | 1579.09 | 573 | 578 | 132.2 |
| C | 4 | 254 | 200428 | 1511.97 | 573 | 578 | 132.2 |
| D | 1 | 52 | 474389 | 3362.27 | 578 | 562 | 140.9 |
| D | 13 | 249 | 311333 | 2205.23 | 578 | 562 | 140.9 |
| D | 8 | 195 | 166664 | 1178.66 | 578 | 562 | 140.9 |
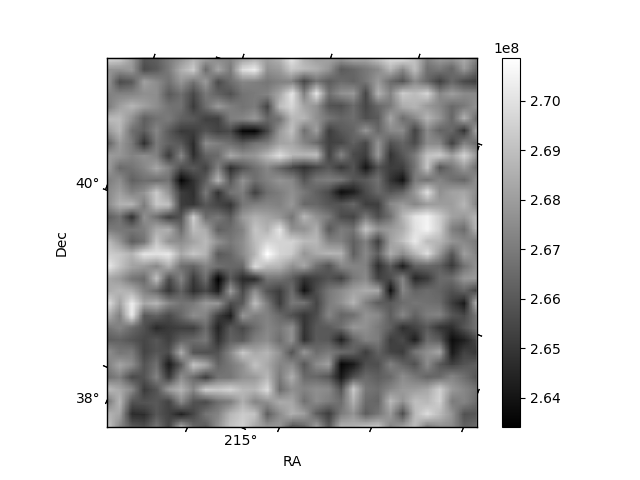
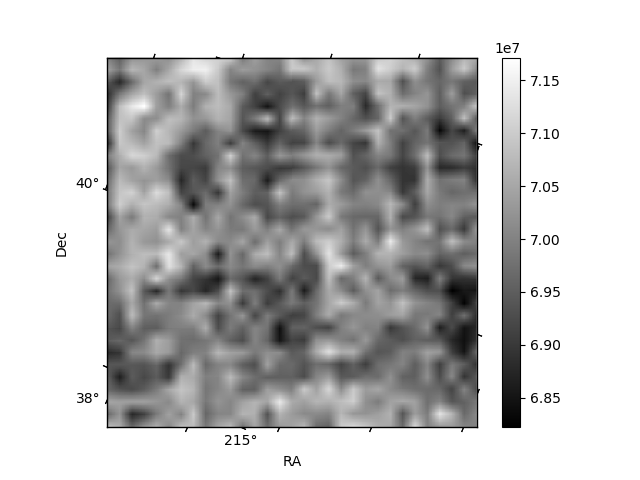
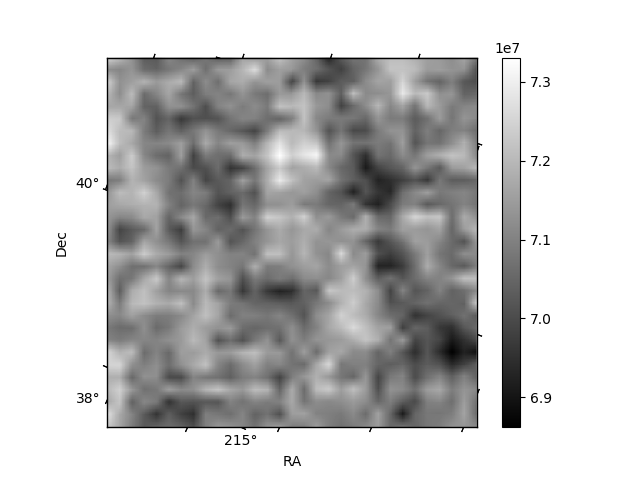
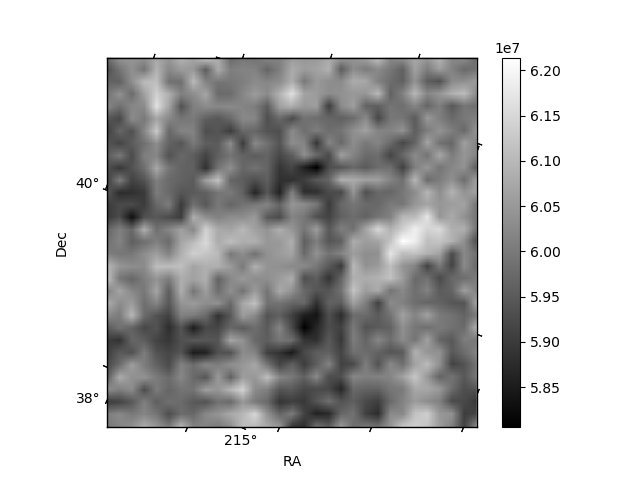
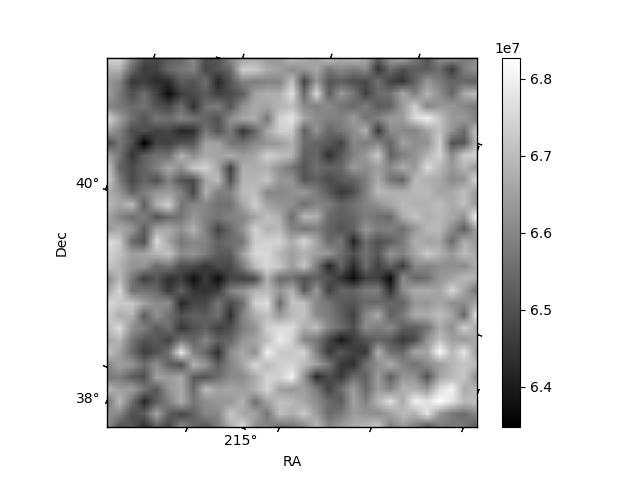
Histogram calculated using DETX and DETY for each event in the final _common_clean file
| Quadrant A | 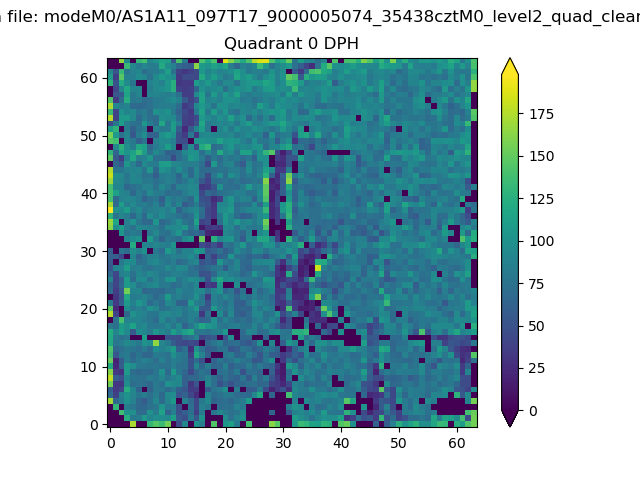 |
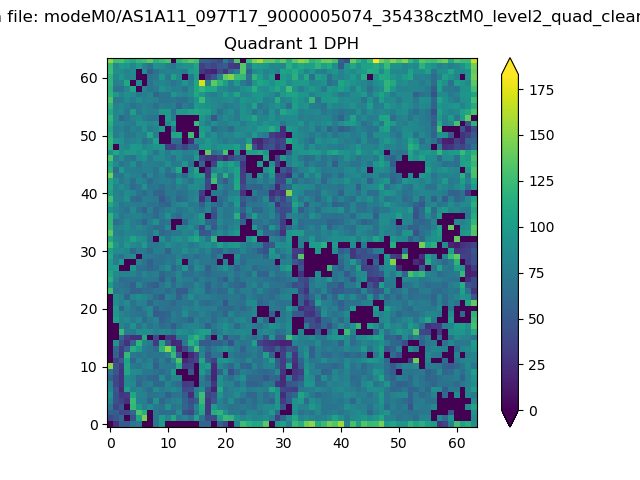 |
Quadrant B |
|---|---|---|---|
| Quadrant D | 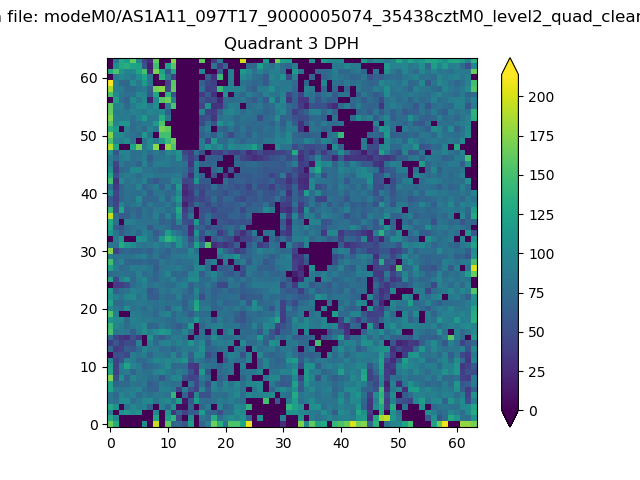 |
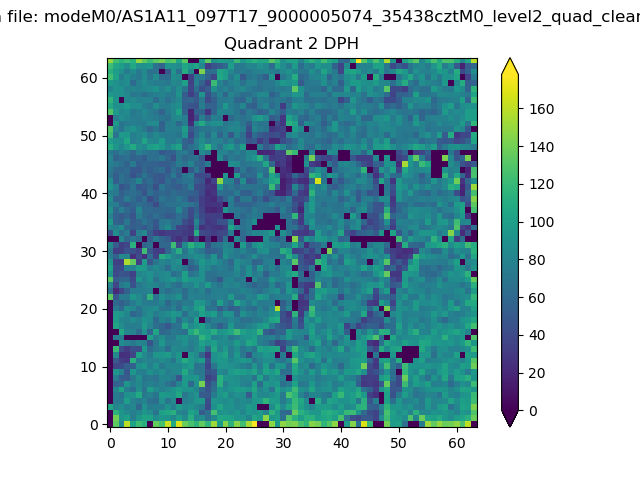 |
Quadrant C |
| Plot type | Count rate plots | Images |
|---|---|---|
| Comparison with Poisson distribution Blue bars denote a histogram of data divided into 1 sec bins. Red curve is a Poisson curve with rate = median count rate of data. |
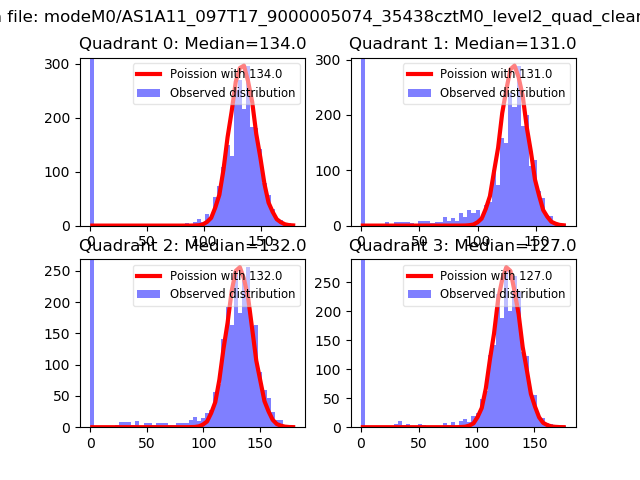 |
 |
| Quadrant-wise count rates Data is divided into 100 sec bins |
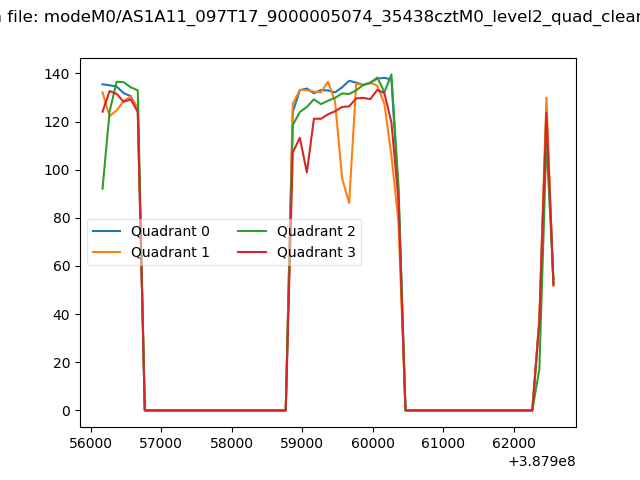 |
|
| Module-wise count rates for Quadrant A Data is divided into 100 sec bins |
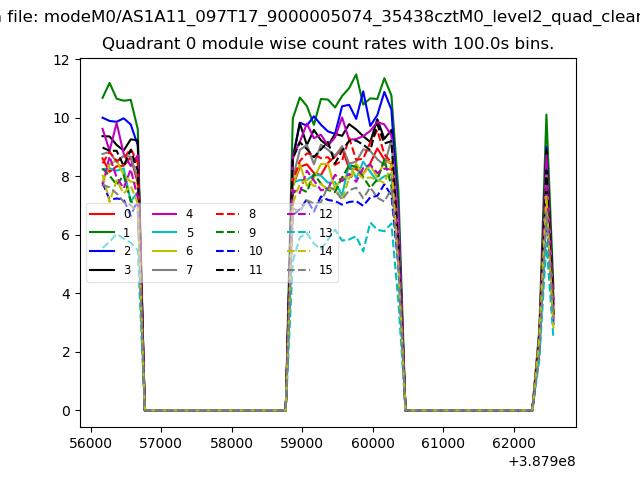 |
 |
| Module-wise count rates for Quadrant B Data is divided into 100 sec bins |
 |
 |
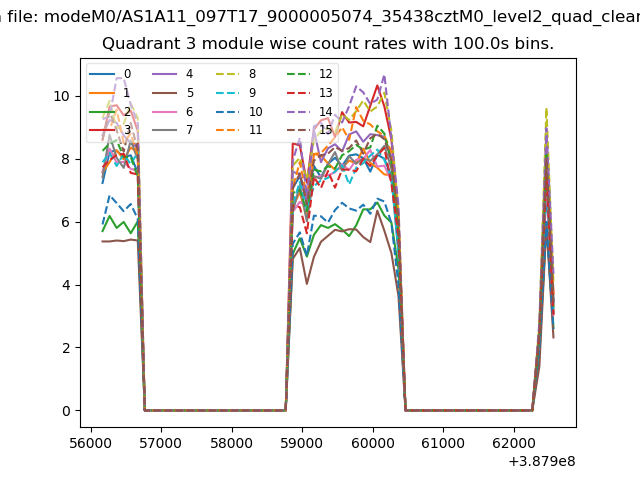
| Module-wise count rates for Quadrant C Data is divided into 100 sec bins |
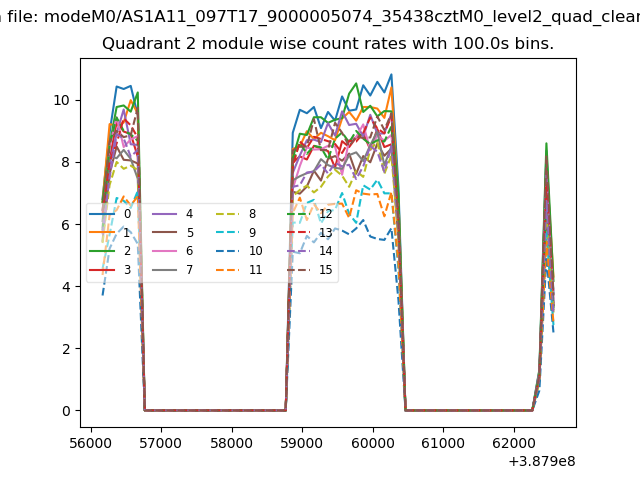 |
 |
| Module-wise count rates for Quadrant D Data is divided into 100 sec bins |
 |
 |
| Parameter | Plot |
|---|---|
| CZT HV Monitor |  |
| D_VDD | 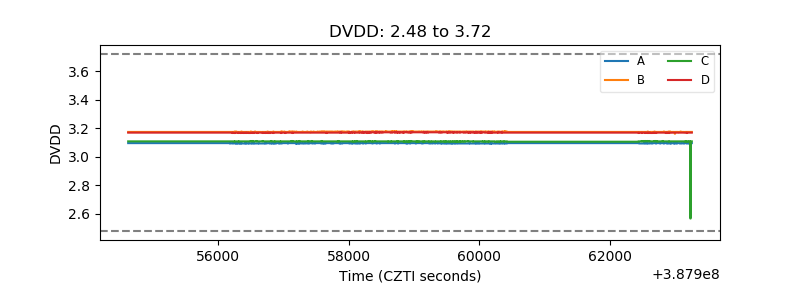 |
| Temperature 1 | 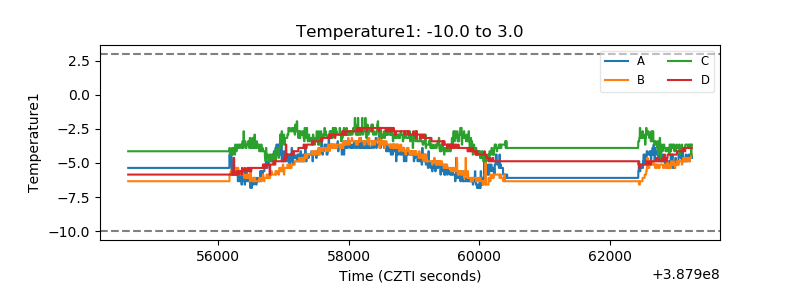 |
| Veto HV Monitor | 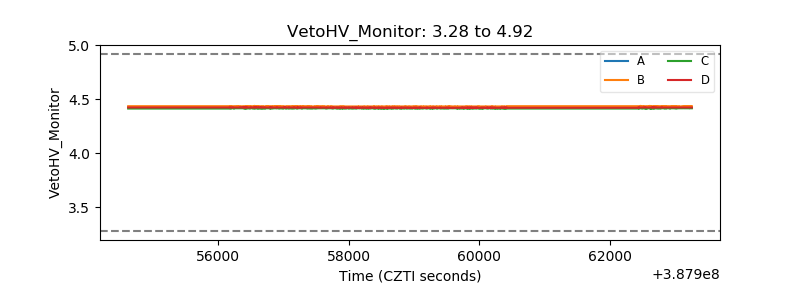 |
| Veto LLD | 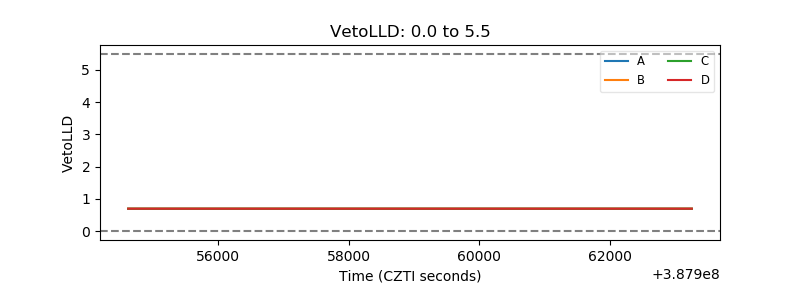 |
| Alpha Counter | 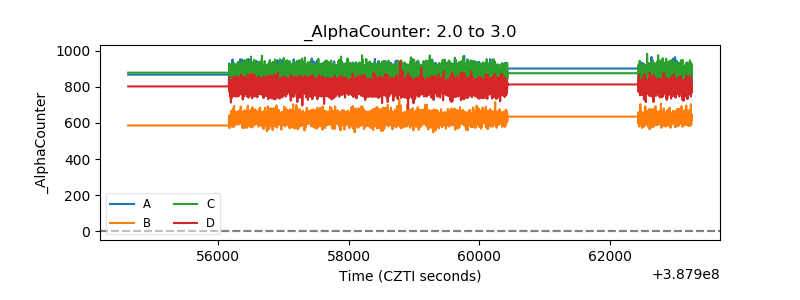 |
| _CPM_Rate | 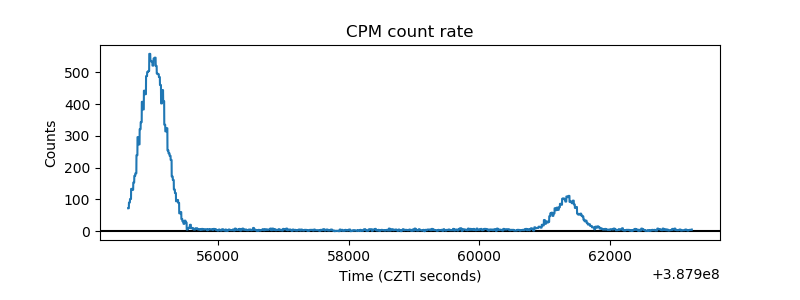 |
| CZT Counter | 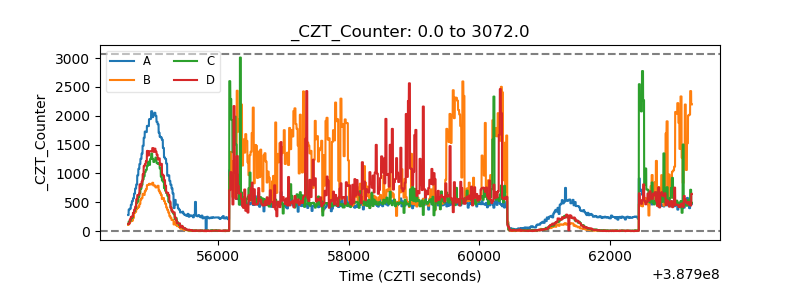 |
| +2.5 Volts monitor | 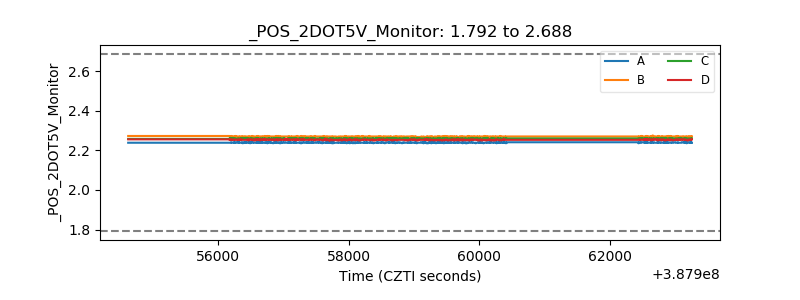 |
| +5 Volts monitor | 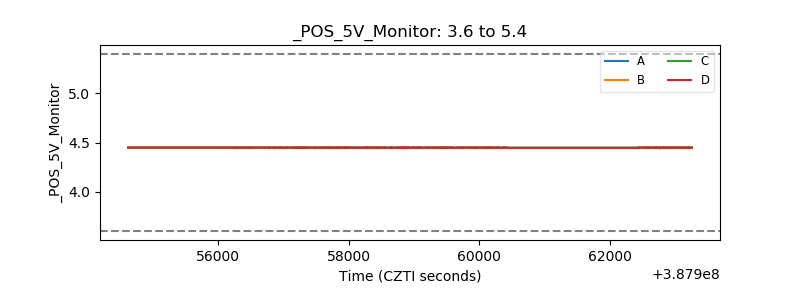 |
| _ROLL_ROT | 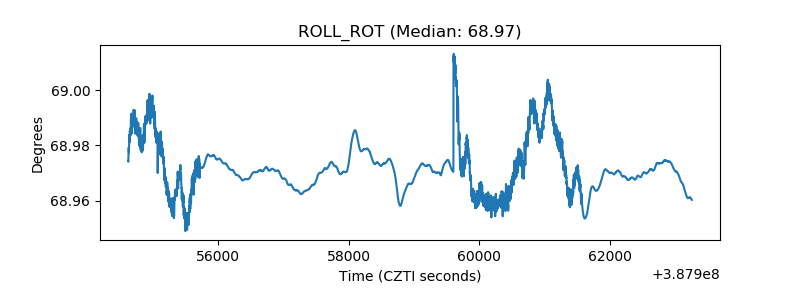 |
| _Roll_DEC | 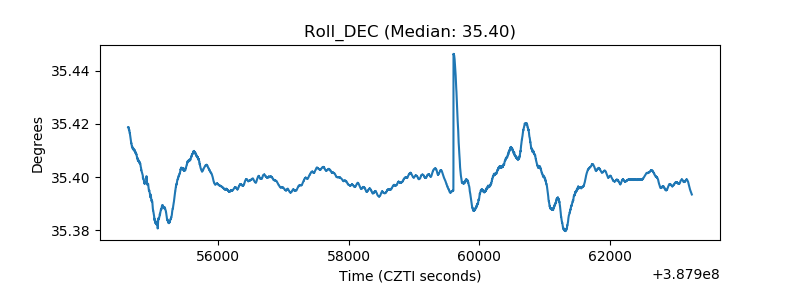 |
| _Roll_RA | 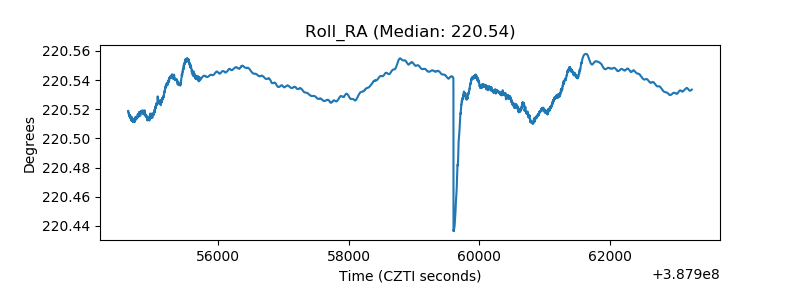 |
| Veto Counter | 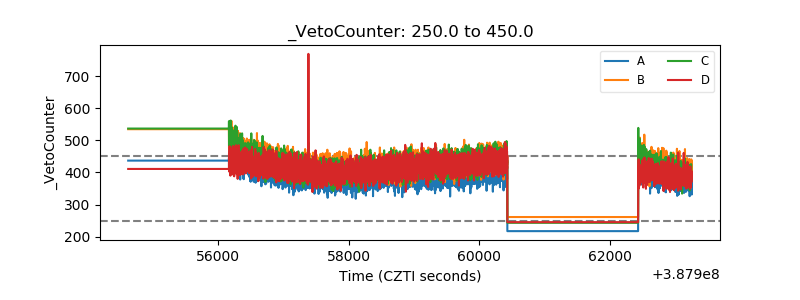 |