| Param | Original file | Final file |
|---|---|---|
| Filename | modeM0/AS1A11_097T17_9000005074_35436cztM0_level2.evt | modeM0/AS1A11_097T17_9000005074_35436cztM0_level2_quad_clean.evt |
| Size (bytes) | 442,074,240 | 65,393,280 |
| Size | 421.6 MB | 62.4 MB |
| Events in quadrant A | 2,534,528 | 414,829 |
| Events in quadrant B | 3,825,171 | 424,251 |
| Events in quadrant C | 3,530,323 | 400,605 |
| Events in quadrant D | 3,161,505 | 392,248 |
| Mode M9 | |||
|---|---|---|---|
| Quadrant | BADHDUFLAG | Total packets | Discarded packets |
| A | 0 | 29 | 0 |
| B | 0 | 29 | 0 |
| C | 0 | 29 | 0 |
| D | 0 | 30 | 0 |
| Mode M0 | |||
|---|---|---|---|
| Quadrant | BADHDUFLAG | Total packets | Discarded packets |
| A | 0 | 10389 | 3 |
| B | 0 | 14545 | 2 |
| C | 0 | 13470 | 2 |
| D | 0 | 12661 | 2 |
| Mode SS | |||
|---|---|---|---|
| Quadrant | BADHDUFLAG | Total packets | Discarded packets |
| A | 0 | 100 | 0 |
| B | 0 | 100 | 0 |
| C | 0 | 100 | 0 |
| D | 0 | 100 | 0 |
| Quadrant | Total seconds | Saturated seconds | Saturation percentage |
|---|---|---|---|
| A | 4964 | 10 | 0.201450% |
| B | 4964 | 263 | 5.298147% |
| C | 4964 | 284 | 5.721193% |
| D | 4964 | 137 | 2.759871% |
Noise dominated data is calculated using 1-second bins in cleaned event files. If a bin has >2000 counts, and if more than 50% of those come from <1% of pixels, then it is considered to be noise-dominated and hence unusable.
| Quadrant | # 1 sec bins | Bins with >0 counts | Bins with >2000 counts | High rate bins dominated by noise | Noise dominated (total time) | Noise dominated (detector-on time) | Marked lightcurve |
|---|---|---|---|---|---|---|---|
| A | 7087 | 4965 | 1 | 1 | 0.01% | 0.02% | 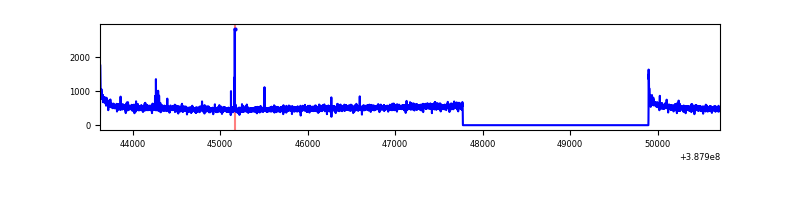 |
| B | 7087 | 4965 | 180 | 180 | 2.54% | 3.63% | 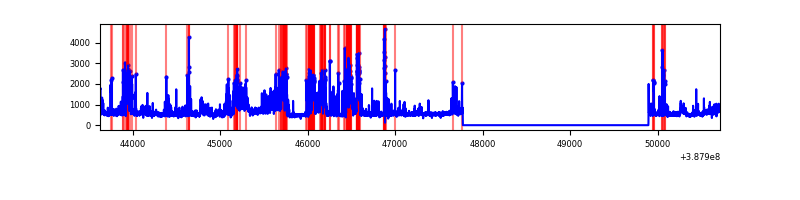 |
| C | 7087 | 4965 | 221 | 221 | 3.12% | 4.45% | 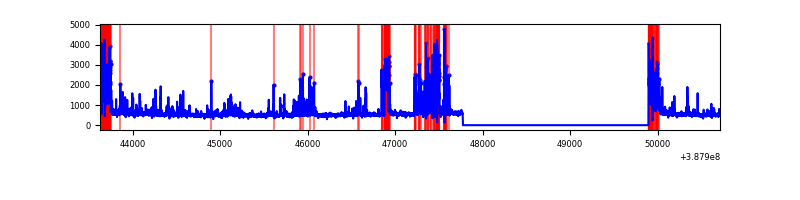 |
| D | 7087 | 4965 | 110 | 110 | 1.55% | 2.22% | 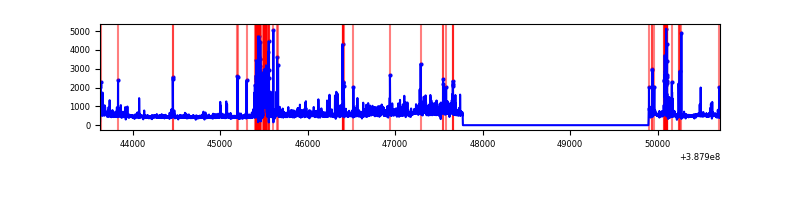 |
Top three noisy pixels from each quadrant. If the there are fewer than three noisy pixels in the level2.evt file, extra rows are filled as -1
| Pixel properties | Quadrant properties | ||||||
|---|---|---|---|---|---|---|---|
| Quadrant | DetID | PixID | Counts | Sigma | Mean | Median | Sigma |
| A | 10 | 83 | 123997 | 1006.69 | 615 | 604 | 122.6 |
| A | 13 | 6 | 12176 | 94.41 | 615 | 604 | 122.6 |
| A | 9 | 143 | 8277 | 62.6 | 615 | 604 | 122.6 |
| B | 4 | 251 | 735325 | 6409.9 | 603 | 590 | 114.6 |
| B | 5 | 236 | 514151 | 4480.36 | 603 | 590 | 114.6 |
| B | 5 | 172 | 130418 | 1132.63 | 603 | 590 | 114.6 |
| C | 0 | 207 | 442121 | 3337.82 | 576 | 581 | 132.3 |
| C | 0 | 10 | 344060 | 2596.53 | 576 | 581 | 132.3 |
| C | 4 | 254 | 287266 | 2167.19 | 576 | 581 | 132.3 |
| D | 13 | 249 | 316376 | 2232.52 | 581 | 567 | 141.5 |
| D | 1 | 52 | 314759 | 2221.09 | 581 | 567 | 141.5 |
| D | 7 | 80 | 154011 | 1084.73 | 581 | 567 | 141.5 |
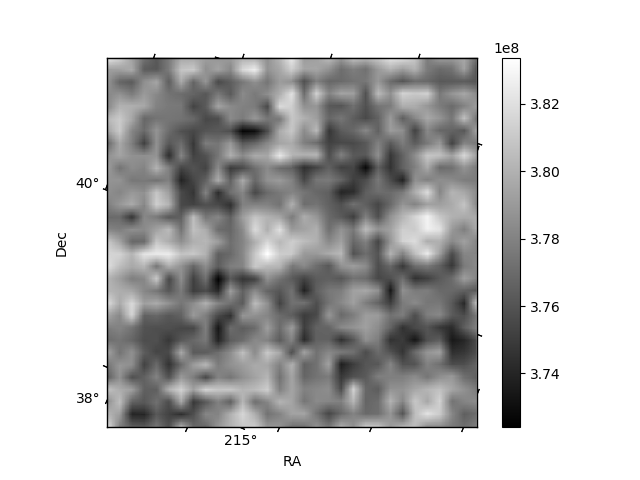
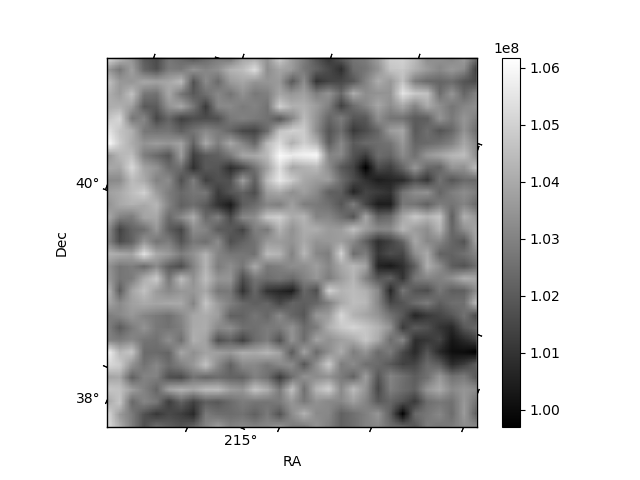
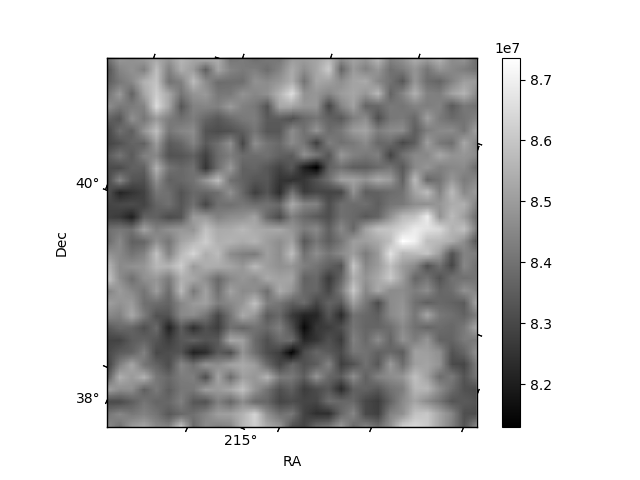
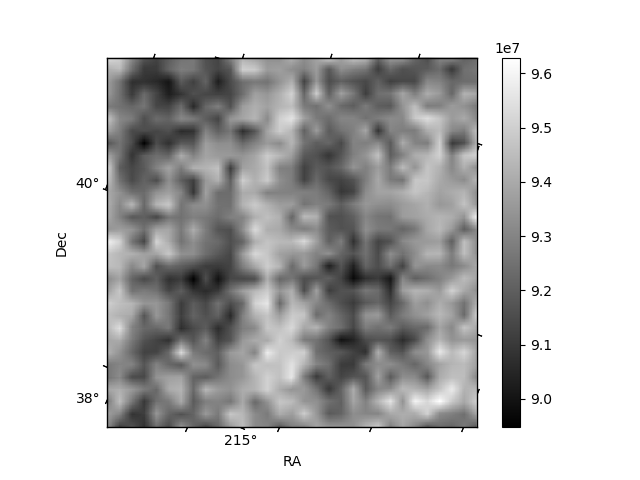
Histogram calculated using DETX and DETY for each event in the final _common_clean file
| Quadrant A | 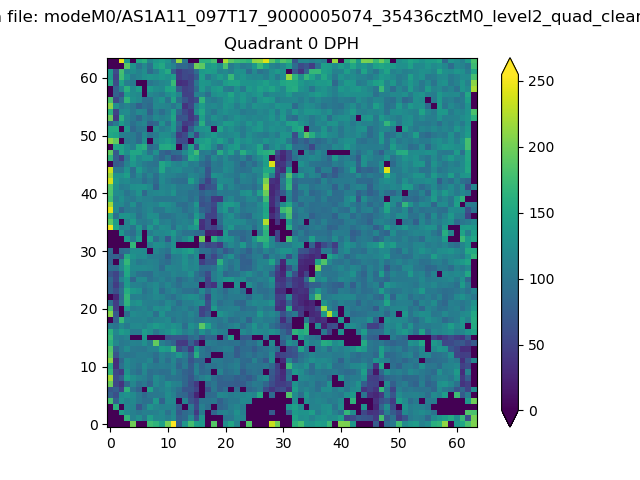 |
 |
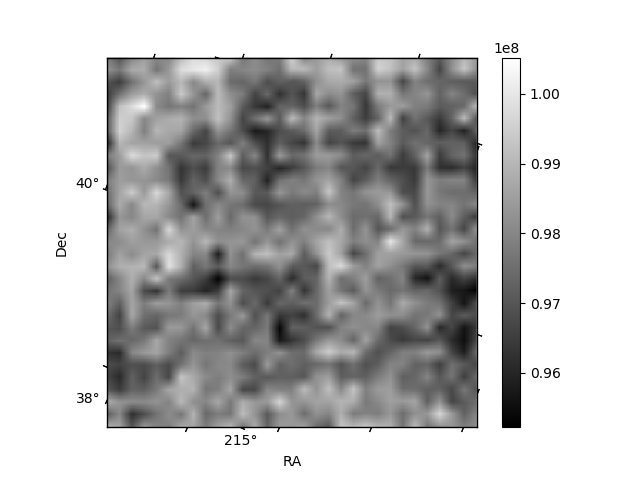
Quadrant B |
|---|---|---|---|
| Quadrant D | 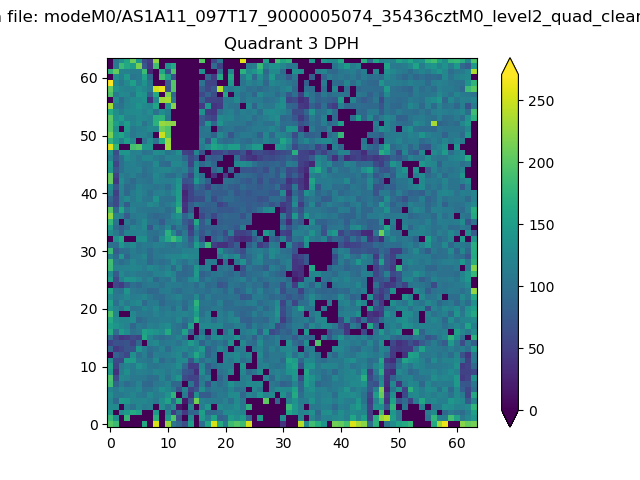 |
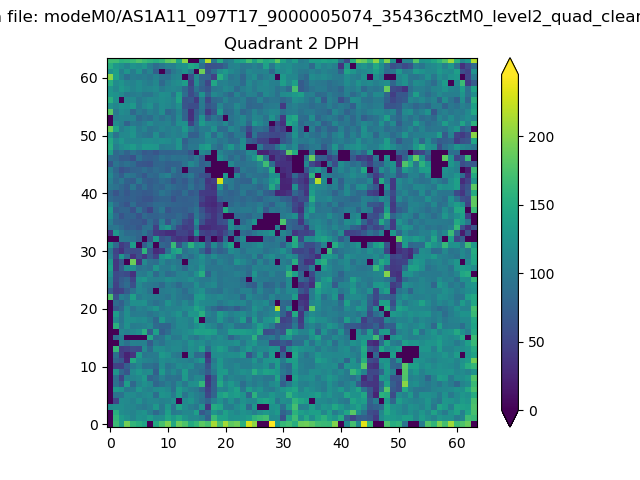 |
Quadrant C |
| Plot type | Count rate plots | Images |
|---|---|---|
| Comparison with Poisson distribution Blue bars denote a histogram of data divided into 1 sec bins. Red curve is a Poisson curve with rate = median count rate of data. |
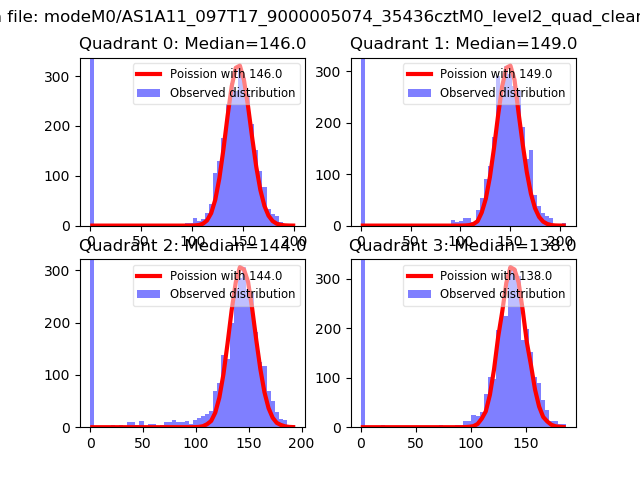 |
 |
| Quadrant-wise count rates Data is divided into 100 sec bins |
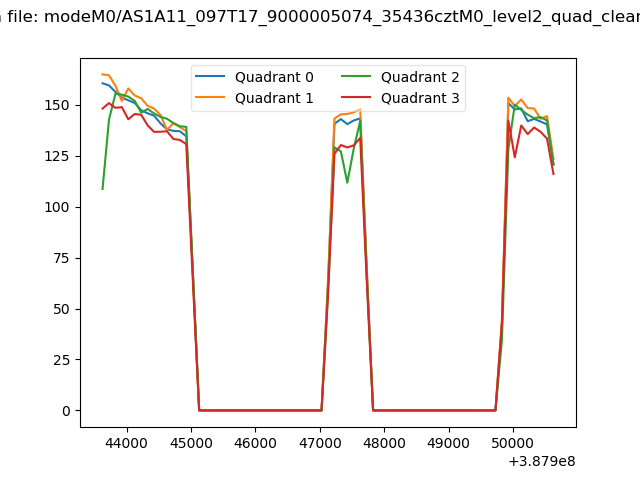 |
|
| Module-wise count rates for Quadrant A Data is divided into 100 sec bins |
 |
 |
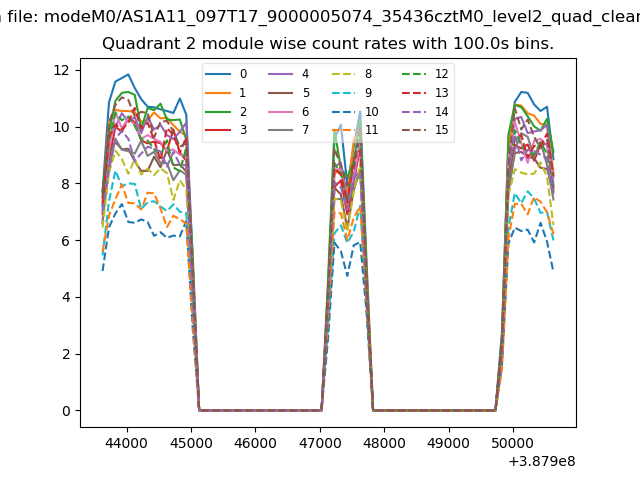
| Module-wise count rates for Quadrant B Data is divided into 100 sec bins |
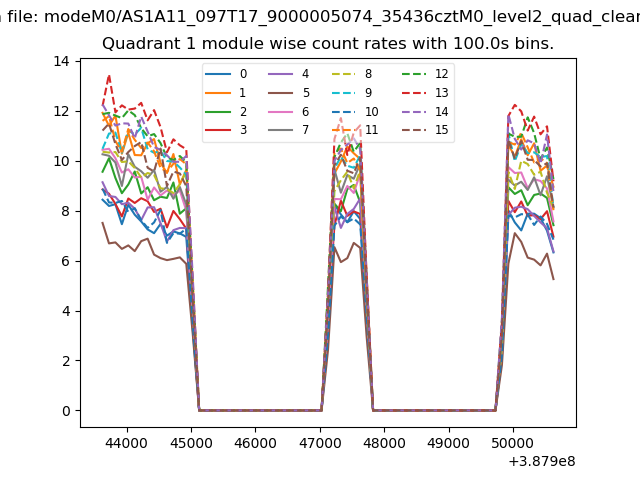 |
 |
| Module-wise count rates for Quadrant C Data is divided into 100 sec bins |
 |
 |
| Module-wise count rates for Quadrant D Data is divided into 100 sec bins |
 |
 |
| Parameter | Plot |
|---|---|
| CZT HV Monitor | 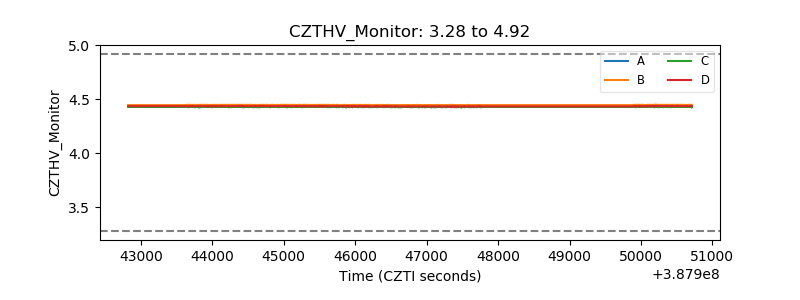 |
| D_VDD | 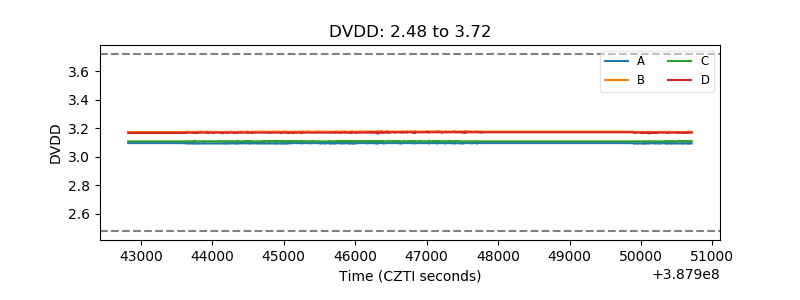 |
| Temperature 1 | 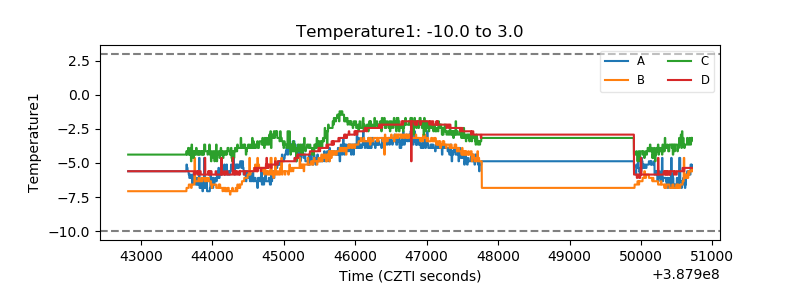 |
| Veto HV Monitor | 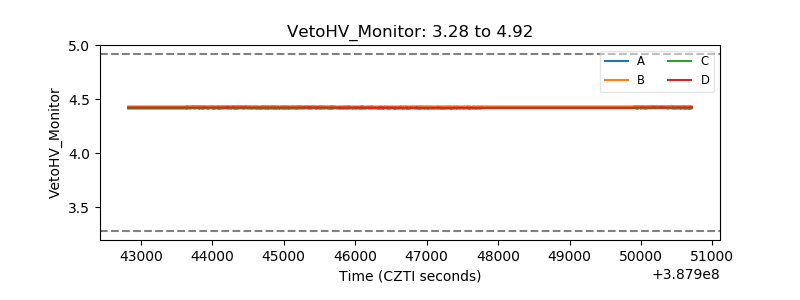 |
| Veto LLD | 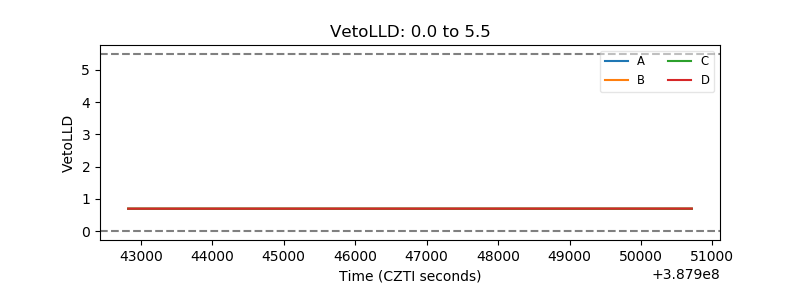 |
| Alpha Counter | 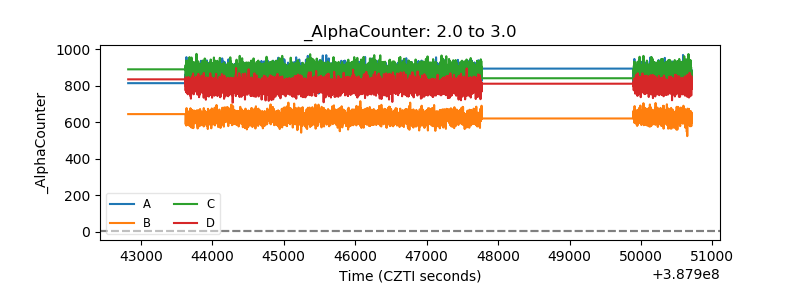 |
| _CPM_Rate | 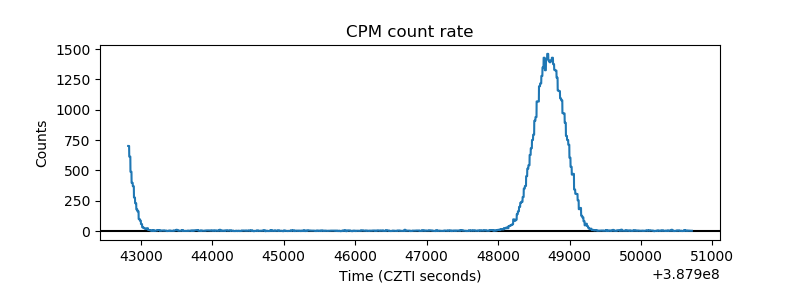 |
| CZT Counter | 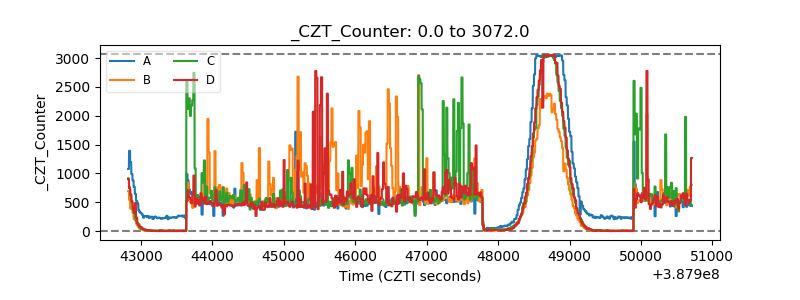 |
| +2.5 Volts monitor | 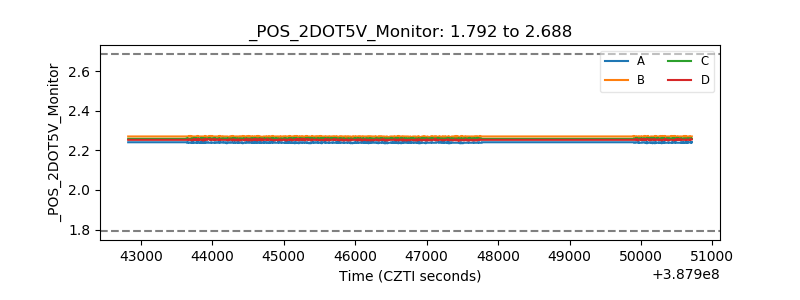 |
| +5 Volts monitor |  |
| _ROLL_ROT | 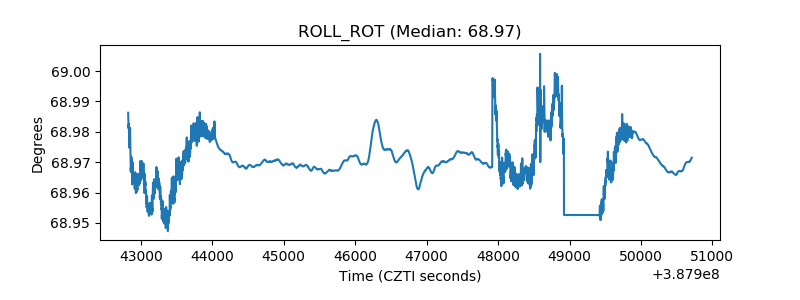 |
| _Roll_DEC | 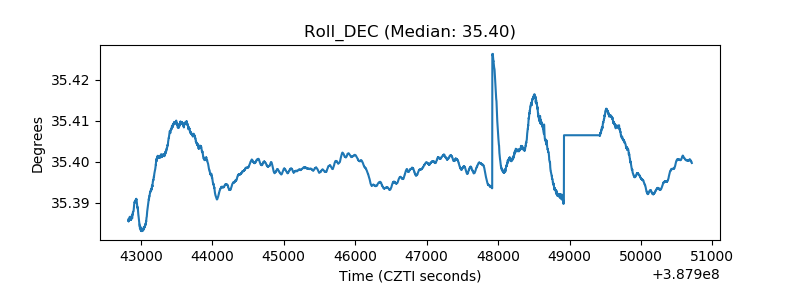 |
| _Roll_RA | 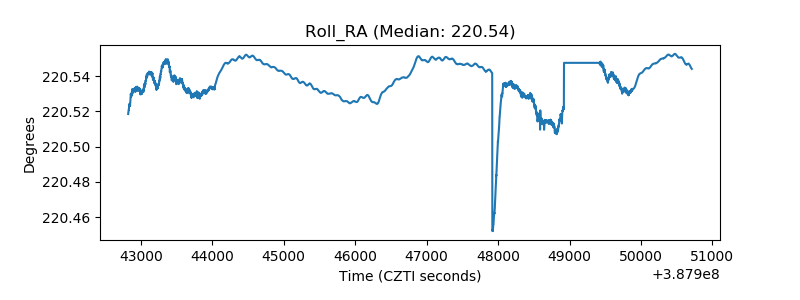 |
| Veto Counter |  |