| Param | Original file | Final file |
|---|---|---|
| Filename | modeM0/AS1A11_097T07_9000005072_35434cztM0_level2.evt | modeM0/AS1A11_097T07_9000005072_35434cztM0_level2_quad_clean.evt |
| Size (bytes) | 113,676,480 | 23,146,560 |
| Size | 108.4 MB | 22.1 MB |
| Events in quadrant A | 565,651 | 159,670 |
| Events in quadrant B | 1,286,312 | 154,553 |
| Events in quadrant C | 825,208 | 153,910 |
| Events in quadrant D | 688,326 | 148,775 |
| Mode M0 | |||
|---|---|---|---|
| Quadrant | BADHDUFLAG | Total packets | Discarded packets |
| A | 0 | 2356 | 1 |
| B | 0 | 4610 | 1 |
| C | 0 | 3118 | 1 |
| D | 0 | 2741 | 1 |
| Mode M9 | |||
|---|---|---|---|
| Quadrant | BADHDUFLAG | Total packets | Discarded packets |
| A | 0 | 9 | 0 |
| B | 0 | 9 | 0 |
| C | 0 | 9 | 0 |
| D | 0 | 10 | 0 |
| Mode SS | |||
|---|---|---|---|
| Quadrant | BADHDUFLAG | Total packets | Discarded packets |
| A | 0 | 22 | 0 |
| B | 0 | 22 | 0 |
| C | 0 | 22 | 0 |
| D | 0 | 22 | 0 |
| Quadrant | Total seconds | Saturated seconds | Saturation percentage |
|---|---|---|---|
| A | 1097 | 1 | 0.091158% |
| B | 1097 | 134 | 12.215132% |
| C | 1097 | 73 | 6.654512% |
| D | 1097 | 16 | 1.458523% |
Noise dominated data is calculated using 1-second bins in cleaned event files. If a bin has >2000 counts, and if more than 50% of those come from <1% of pixels, then it is considered to be noise-dominated and hence unusable.
| Quadrant | # 1 sec bins | Bins with >0 counts | Bins with >2000 counts | High rate bins dominated by noise | Noise dominated (total time) | Noise dominated (detector-on time) | Marked lightcurve |
|---|---|---|---|---|---|---|---|
| A | 1097 | 1097 | 0 | 0 | 0.00% | 0.00% | 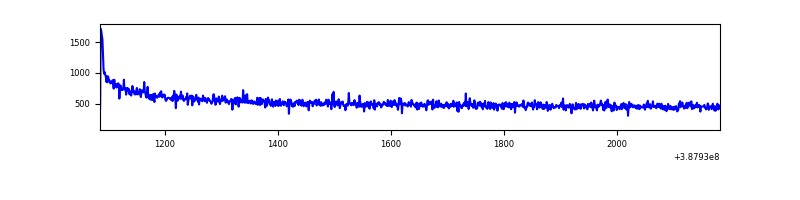 |
| B | 1097 | 1097 | 105 | 105 | 9.57% | 9.57% | 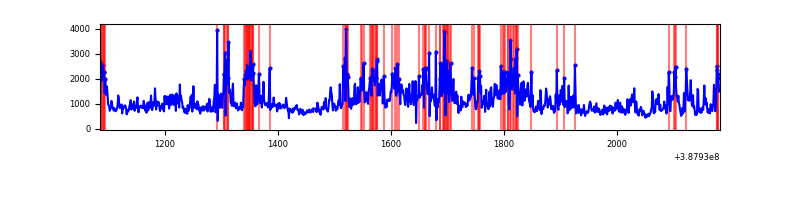 |
| C | 1097 | 1097 | 57 | 57 | 5.20% | 5.20% | 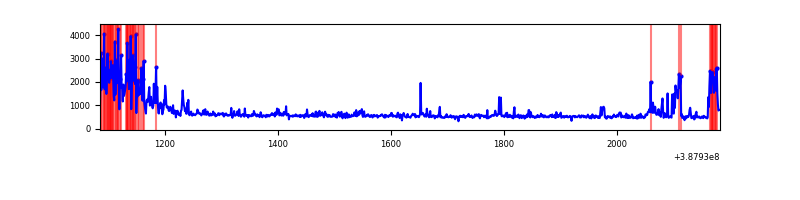 |
| D | 1097 | 1097 | 16 | 16 | 1.46% | 1.46% | 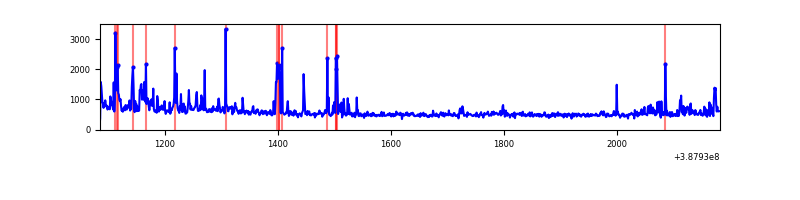 |
Top three noisy pixels from each quadrant. If the there are fewer than three noisy pixels in the level2.evt file, extra rows are filled as -1
| Pixel properties | Quadrant properties | ||||||
|---|---|---|---|---|---|---|---|
| Quadrant | DetID | PixID | Counts | Sigma | Mean | Median | Sigma |
| A | 10 | 83 | 46997 | 1624.87 | 133 | 130 | 28.8 |
| A | 13 | 6 | 1932 | 62.47 | 133 | 130 | 28.8 |
| A | 13 | 254 | 1727 | 55.37 | 133 | 130 | 28.8 |
| B | 5 | 236 | 387864 | 14730.43 | 129 | 126 | 26.3 |
| B | 4 | 251 | 341690 | 12976.24 | 129 | 126 | 26.3 |
| B | 5 | 200 | 13135 | 494.22 | 129 | 126 | 26.3 |
| C | 0 | 10 | 171787 | 5375.78 | 128 | 130 | 31.9 |
| C | 0 | 207 | 89935 | 2812.42 | 128 | 130 | 31.9 |
| C | 15 | 214 | 47926 | 1496.83 | 128 | 130 | 31.9 |
| D | 7 | 80 | 70719 | 2111.01 | 128 | 125 | 33.4 |
| D | 1 | 52 | 61893 | 1847.08 | 128 | 125 | 33.4 |
| D | 8 | 195 | 20317 | 603.81 | 128 | 125 | 33.4 |
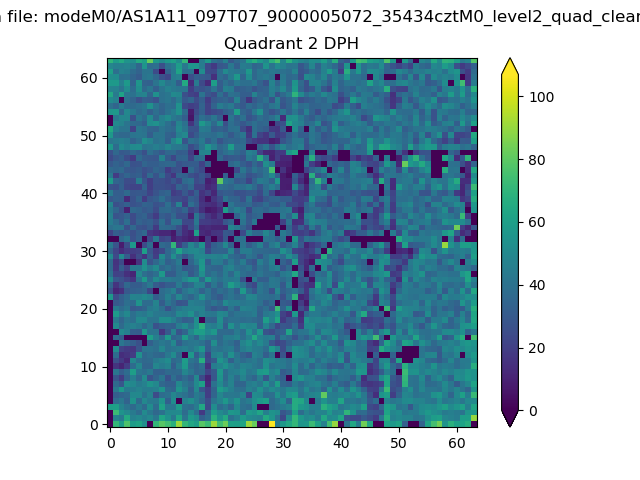
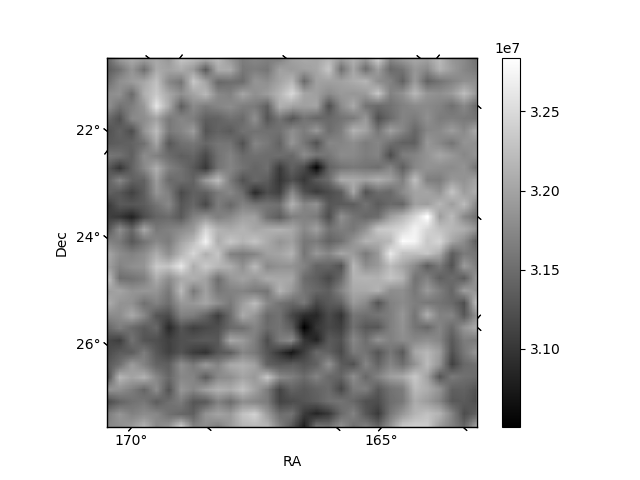
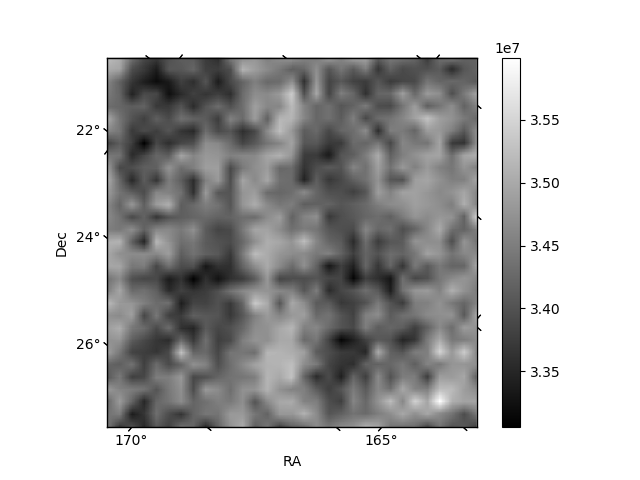
Histogram calculated using DETX and DETY for each event in the final _common_clean file
| Quadrant A | 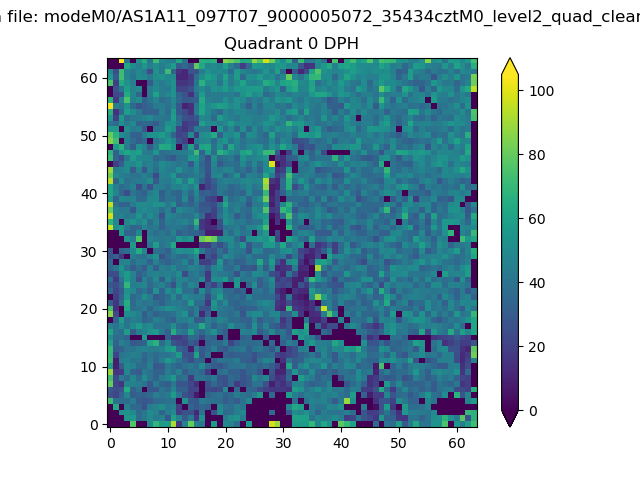 |
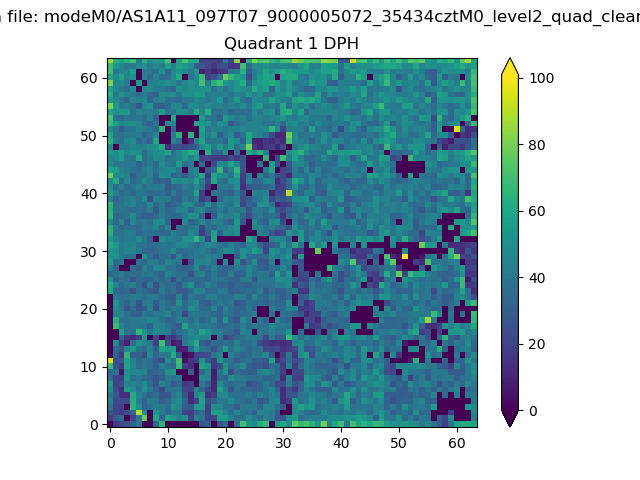 |
Quadrant B |
|---|---|---|---|
| Quadrant D | 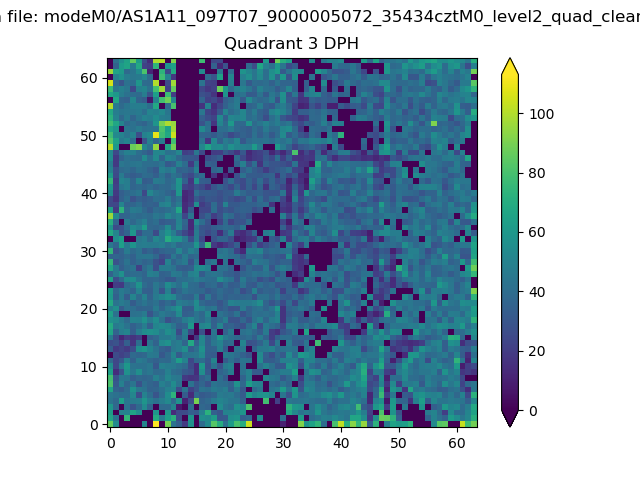 |
 |
Quadrant C |
| Plot type | Count rate plots | Images |
|---|---|---|
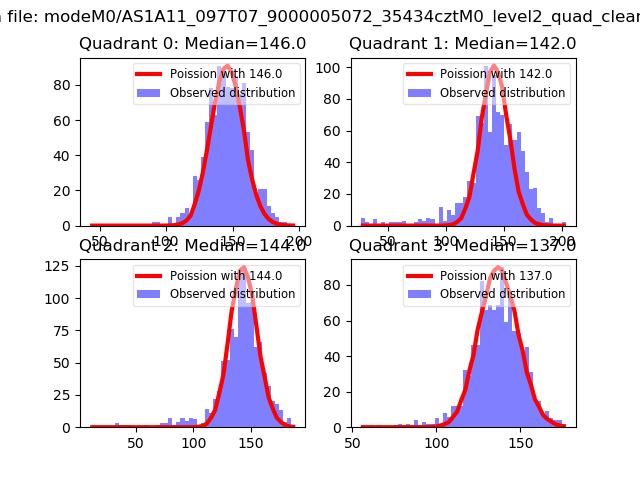
| Comparison with Poisson distribution Blue bars denote a histogram of data divided into 1 sec bins. Red curve is a Poisson curve with rate = median count rate of data. |
 |
 |
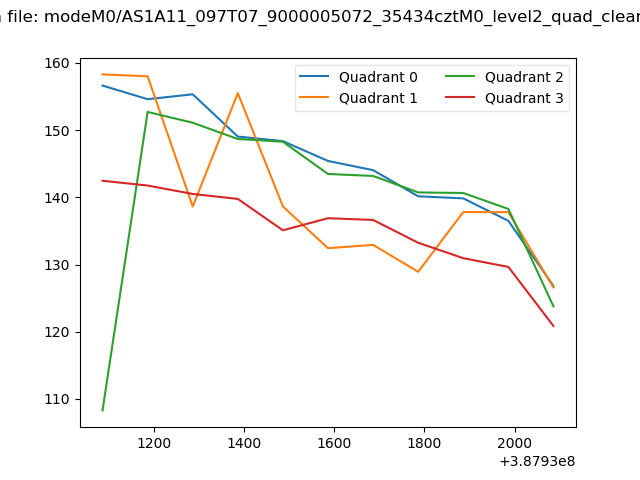
| Quadrant-wise count rates Data is divided into 100 sec bins |
 |
|
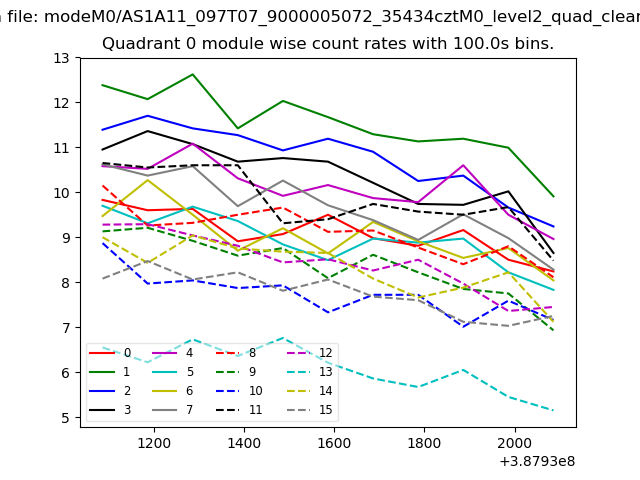
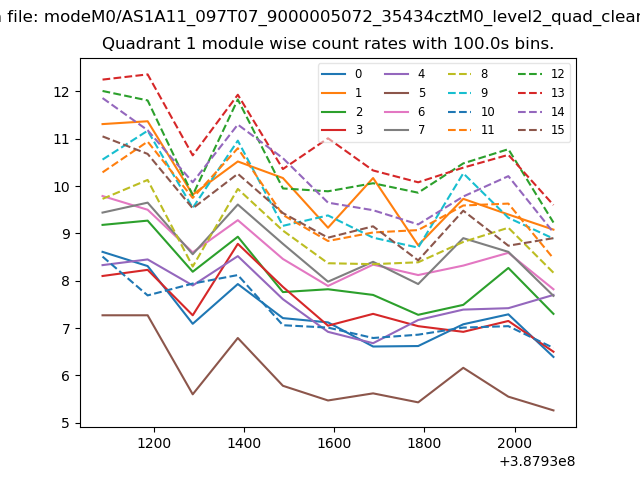
| Module-wise count rates for Quadrant A Data is divided into 100 sec bins |
 |
 |
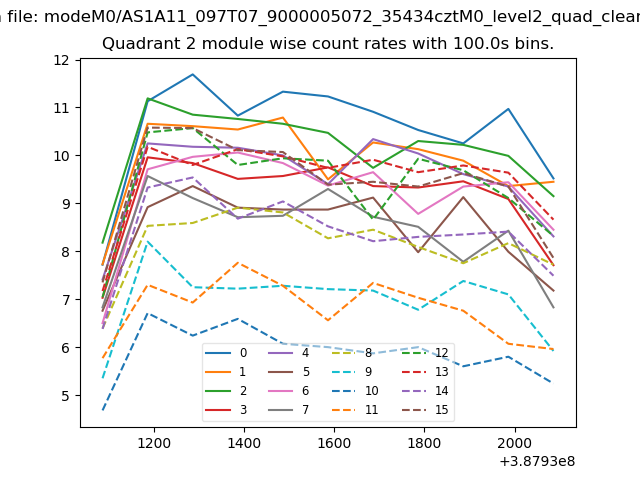
| Module-wise count rates for Quadrant B Data is divided into 100 sec bins |
 |
 |
| Module-wise count rates for Quadrant C Data is divided into 100 sec bins |
 |
 |
| Module-wise count rates for Quadrant D Data is divided into 100 sec bins |
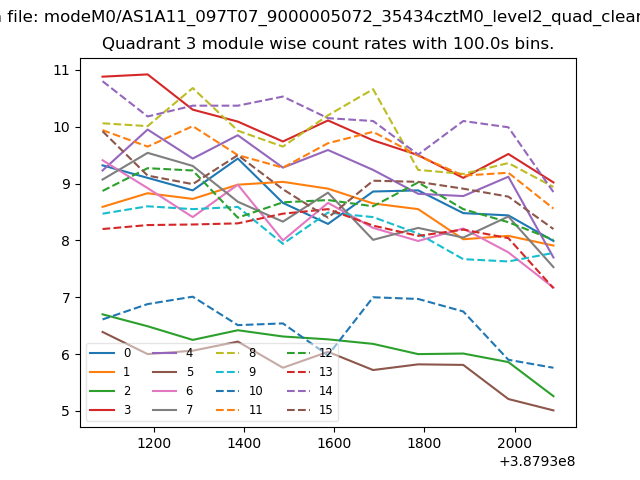 |
 |
| Parameter | Plot |
|---|---|
| CZT HV Monitor | 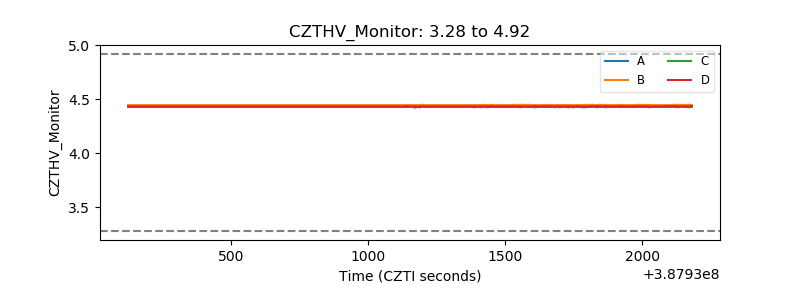 |
| D_VDD | 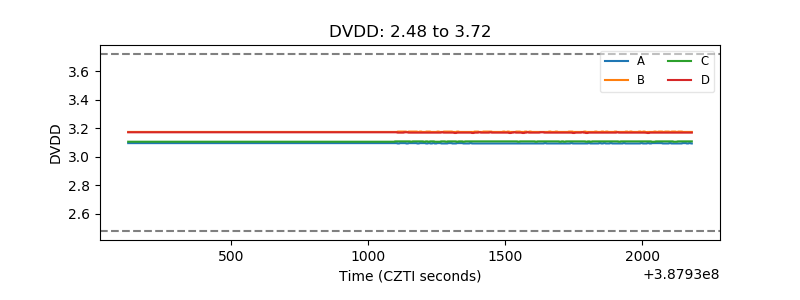 |
| Temperature 1 | 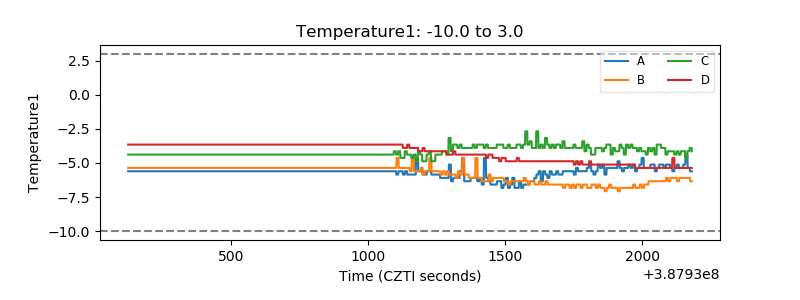 |
| Veto HV Monitor | 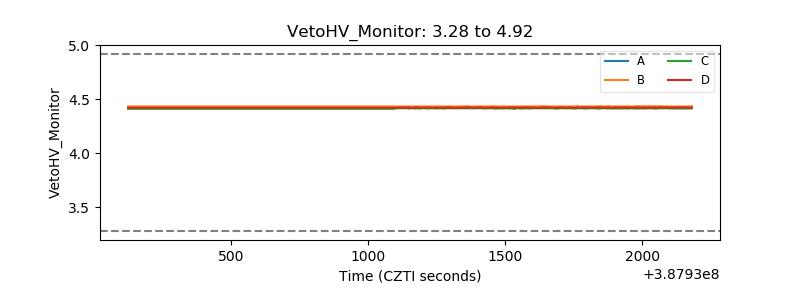 |
| Veto LLD | 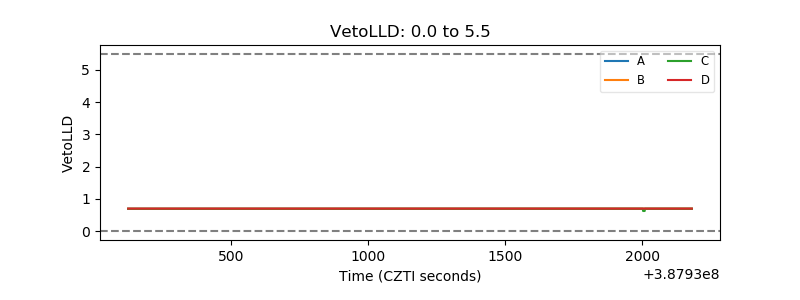 |
| Alpha Counter | 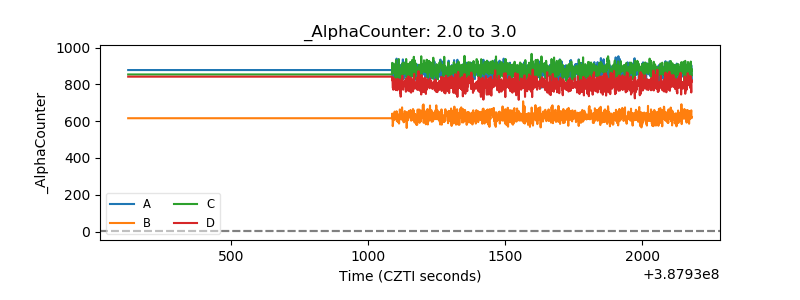 |
| _CPM_Rate | 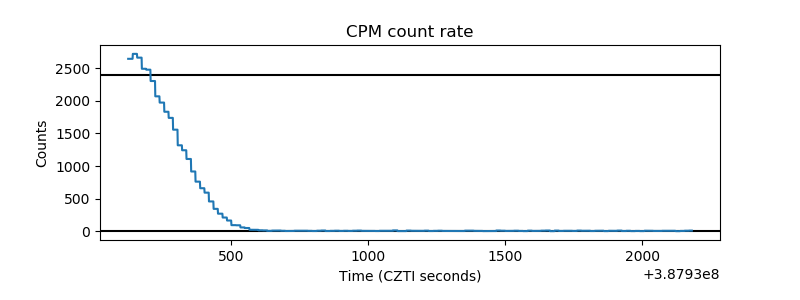 |
| CZT Counter | 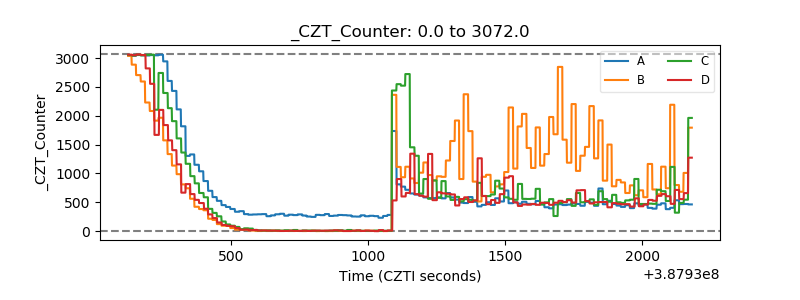 |
| +2.5 Volts monitor | 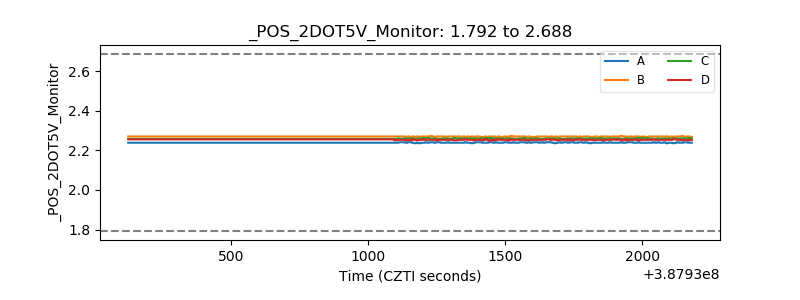 |
| +5 Volts monitor | 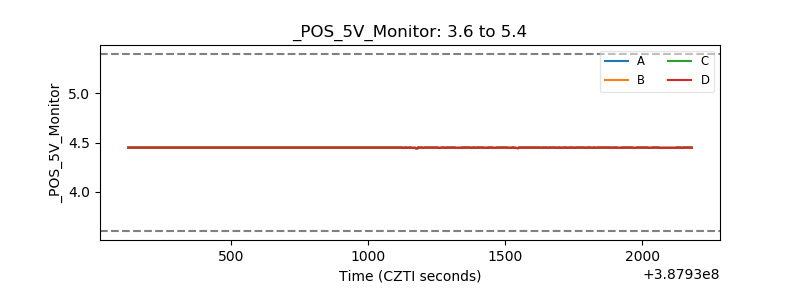 |
| _ROLL_ROT | 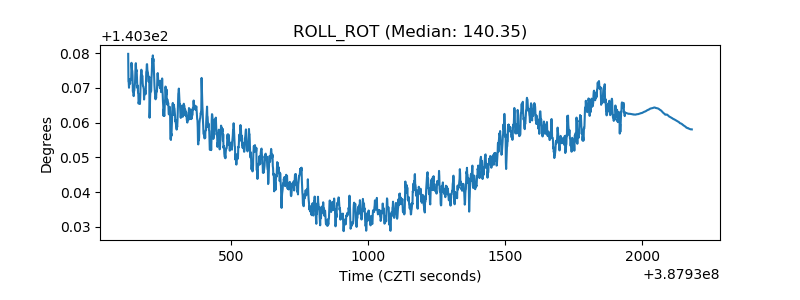 |
| _Roll_DEC | 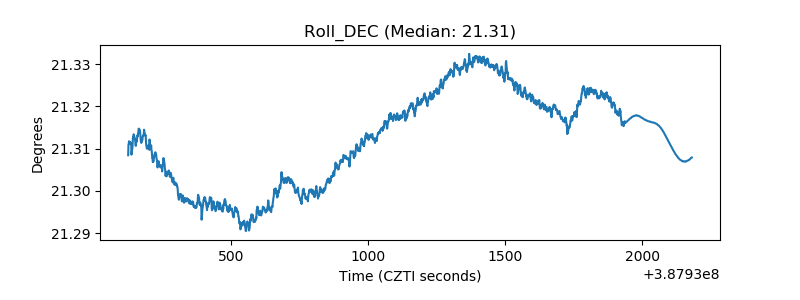 |
| _Roll_RA | 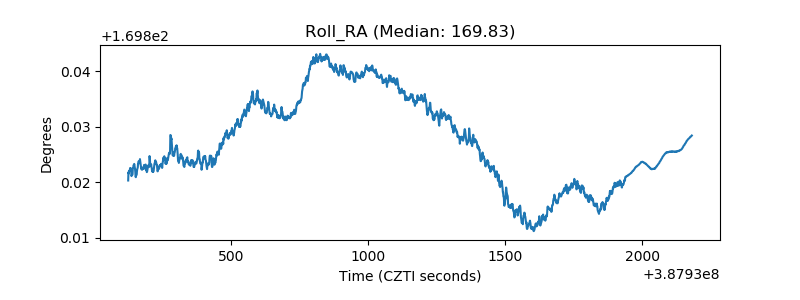 |
| Veto Counter | 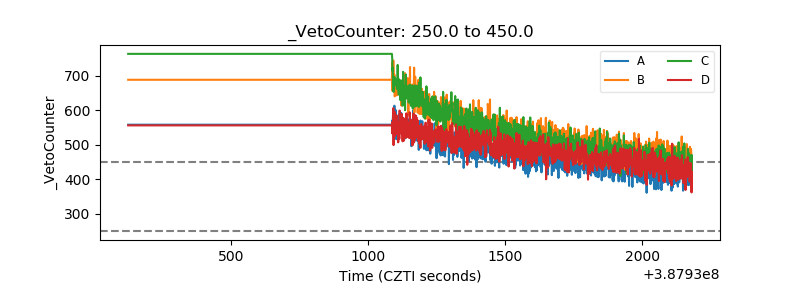 |