| Param | Original file | Final file |
|---|---|---|
| Filename | modeM0/AS1A11_097T07_9000005072_35433cztM0_level2.evt | modeM0/AS1A11_097T07_9000005072_35433cztM0_level2_quad_clean.evt |
| Size (bytes) | 574,107,840 | 63,671,040 |
| Size | 547.5 MB | 60.7 MB |
| Events in quadrant A | 2,516,960 | 410,384 |
| Events in quadrant B | 6,978,636 | 376,930 |
| Events in quadrant C | 3,295,437 | 399,079 |
| Events in quadrant D | 4,243,135 | 376,020 |
| Mode M0 | |||
|---|---|---|---|
| Quadrant | BADHDUFLAG | Total packets | Discarded packets |
| A | 0 | 10825 | 3 |
| B | 0 | 24383 | 2 |
| C | 0 | 13028 | 2 |
| D | 0 | 16120 | 2 |
| Mode M9 | |||
|---|---|---|---|
| Quadrant | BADHDUFLAG | Total packets | Discarded packets |
| A | 0 | 26 | 0 |
| B | 0 | 26 | 0 |
| C | 0 | 26 | 0 |
| D | 0 | 27 | 0 |
| Mode SS | |||
|---|---|---|---|
| Quadrant | BADHDUFLAG | Total packets | Discarded packets |
| A | 0 | 106 | 0 |
| B | 0 | 106 | 0 |
| C | 0 | 106 | 0 |
| D | 0 | 106 | 0 |
| Quadrant | Total seconds | Saturated seconds | Saturation percentage |
|---|---|---|---|
| A | 5212 | 7 | 0.134305% |
| B | 5212 | 1337 | 25.652341% |
| C | 5212 | 136 | 2.609363% |
| D | 5212 | 319 | 6.120491% |
Noise dominated data is calculated using 1-second bins in cleaned event files. If a bin has >2000 counts, and if more than 50% of those come from <1% of pixels, then it is considered to be noise-dominated and hence unusable.
| Quadrant | # 1 sec bins | Bins with >0 counts | Bins with >2000 counts | High rate bins dominated by noise | Noise dominated (total time) | Noise dominated (detector-on time) | Marked lightcurve |
|---|---|---|---|---|---|---|---|
| A | 7035 | 5213 | 1 | 1 | 0.01% | 0.02% | 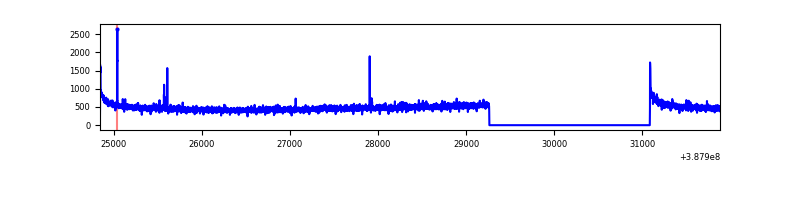 |
| B | 7035 | 5213 | 954 | 954 | 13.56% | 18.30% | 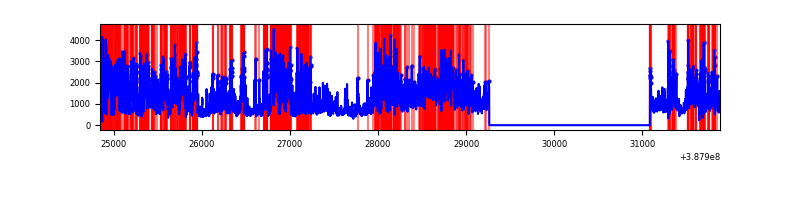 |
| C | 7035 | 5213 | 103 | 103 | 1.46% | 1.98% | 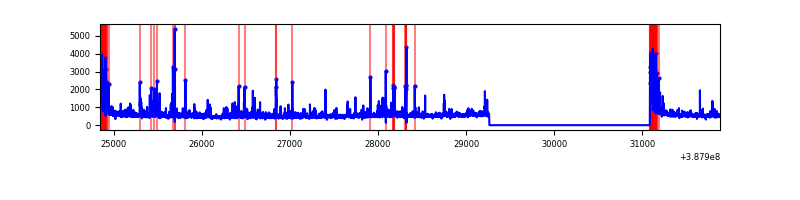 |
| D | 7035 | 5213 | 279 | 279 | 3.97% | 5.35% | 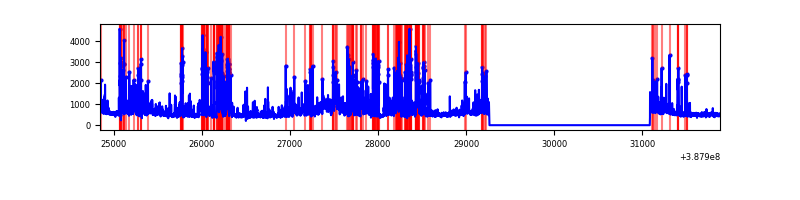 |
Top three noisy pixels from each quadrant. If the there are fewer than three noisy pixels in the level2.evt file, extra rows are filled as -1
| Pixel properties | Quadrant properties | ||||||
|---|---|---|---|---|---|---|---|
| Quadrant | DetID | PixID | Counts | Sigma | Mean | Median | Sigma |
| A | 10 | 83 | 123038 | 990.18 | 613 | 602 | 123.6 |
| A | 7 | 32 | 15410 | 119.76 | 613 | 602 | 123.6 |
| A | 13 | 254 | 8243 | 61.8 | 613 | 602 | 123.6 |
| B | 4 | 251 | 2649440 | 24651.11 | 564 | 551 | 107.5 |
| B | 5 | 236 | 1972767 | 18353.85 | 564 | 551 | 107.5 |
| B | 5 | 200 | 54835 | 505.18 | 564 | 551 | 107.5 |
| C | 0 | 10 | 330320 | 2385.6 | 594 | 598 | 138.2 |
| C | 0 | 207 | 275348 | 1987.86 | 594 | 598 | 138.2 |
| C | 15 | 214 | 213751 | 1542.2 | 594 | 598 | 138.2 |
| D | 7 | 80 | 1284350 | 8973.78 | 581 | 566 | 143.1 |
| D | 13 | 249 | 155770 | 1084.89 | 581 | 566 | 143.1 |
| D | 1 | 47 | 124258 | 864.62 | 581 | 566 | 143.1 |
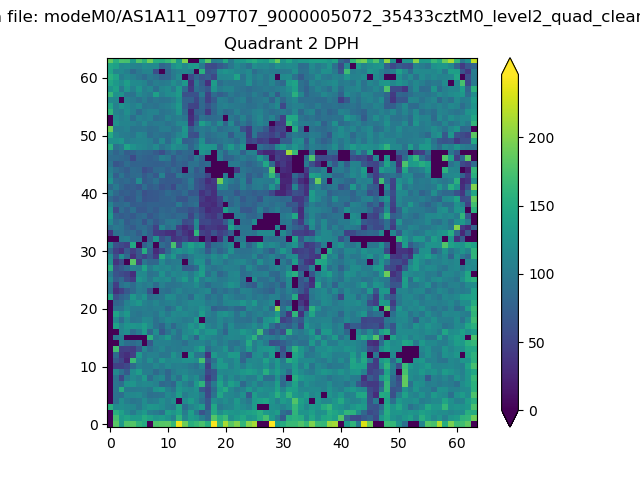
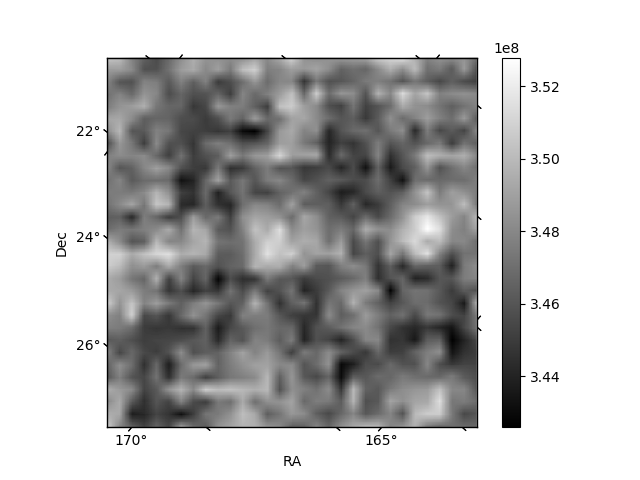
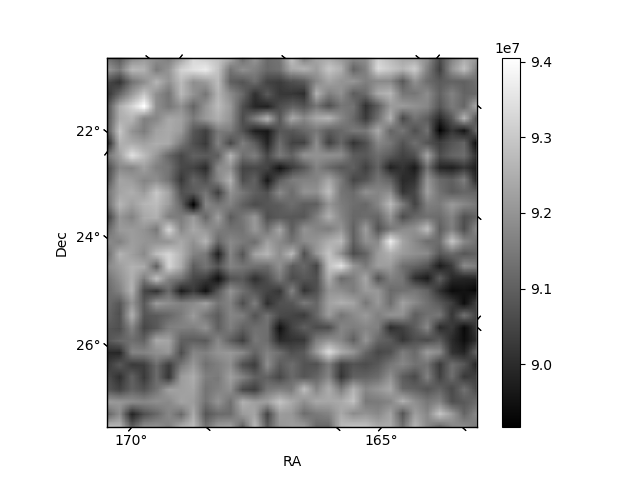
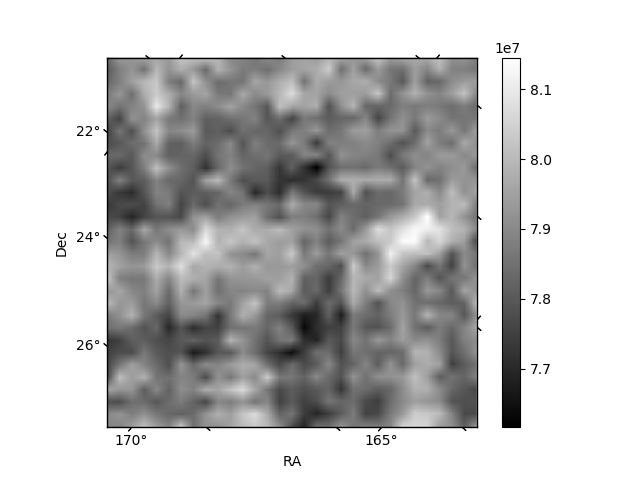
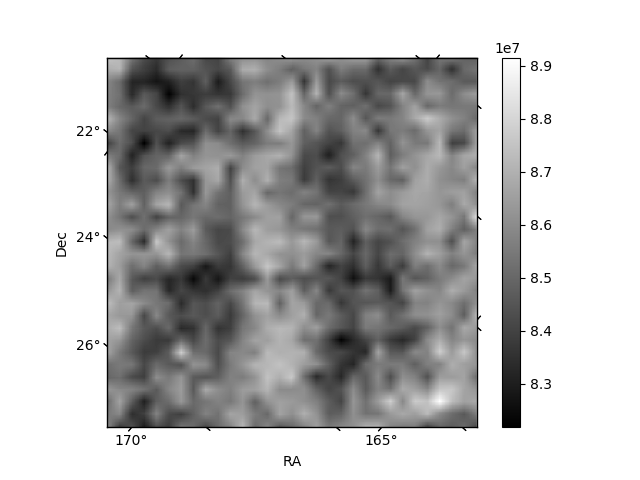
Histogram calculated using DETX and DETY for each event in the final _common_clean file
| Quadrant A | 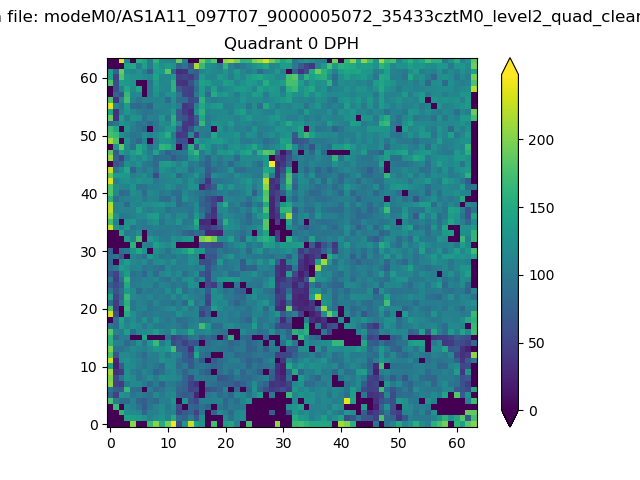 |
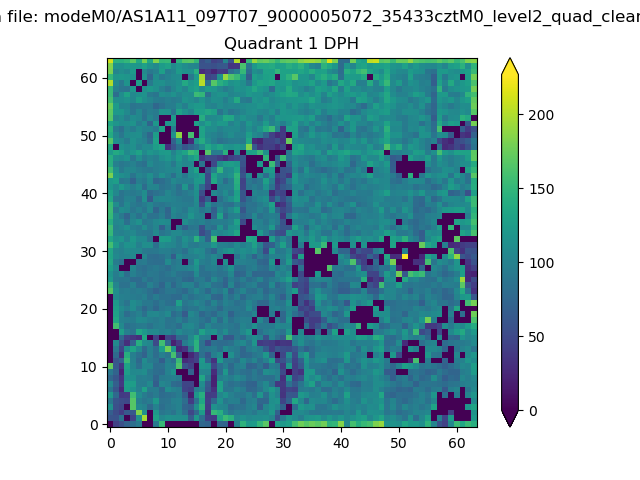 |
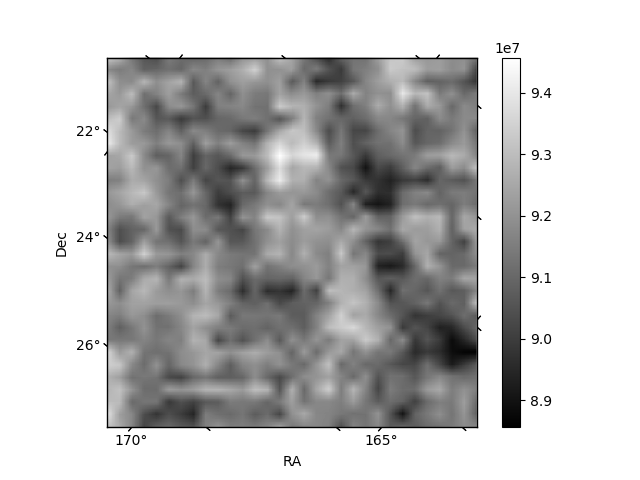
Quadrant B |
|---|---|---|---|
| Quadrant D | 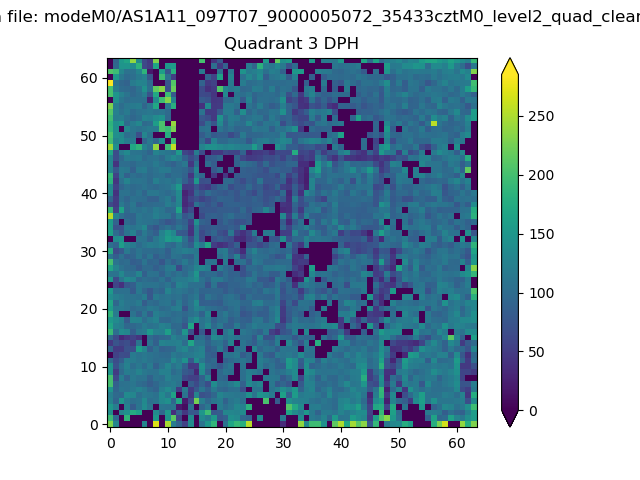 |
 |
Quadrant C |
| Plot type | Count rate plots | Images |
|---|---|---|
| Comparison with Poisson distribution Blue bars denote a histogram of data divided into 1 sec bins. Red curve is a Poisson curve with rate = median count rate of data. |
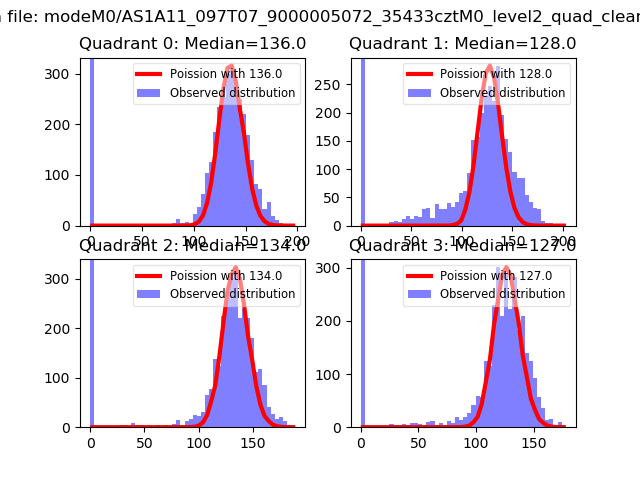 |
 |
| Quadrant-wise count rates Data is divided into 100 sec bins |
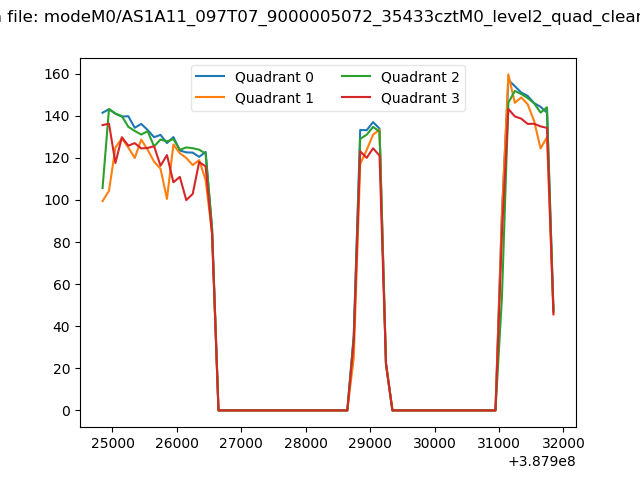 |
|
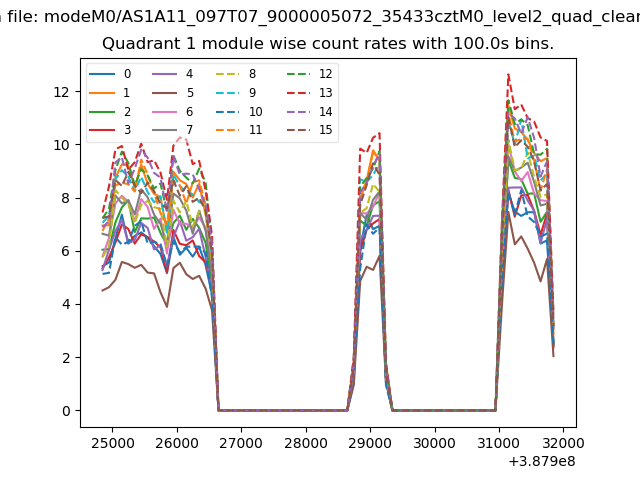
| Module-wise count rates for Quadrant A Data is divided into 100 sec bins |
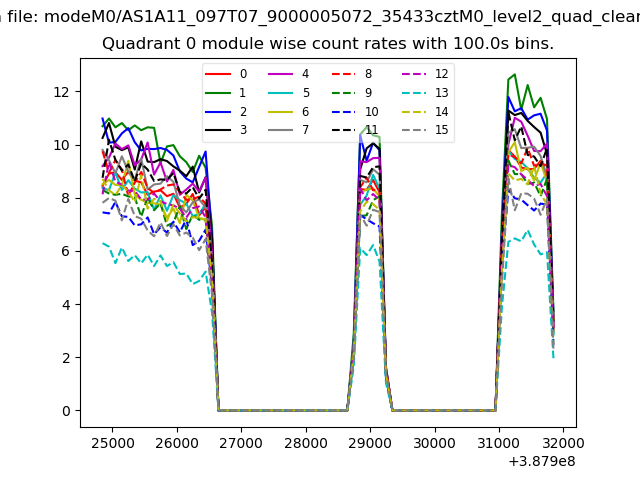 |
 |
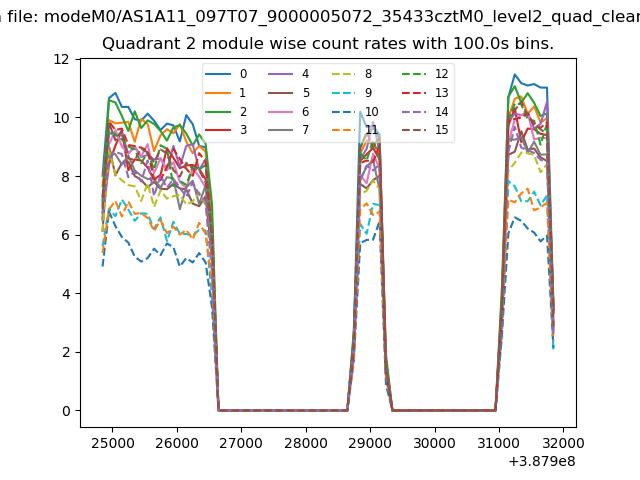
| Module-wise count rates for Quadrant B Data is divided into 100 sec bins |
 |
 |
| Module-wise count rates for Quadrant C Data is divided into 100 sec bins |
 |
 |
| Module-wise count rates for Quadrant D Data is divided into 100 sec bins |
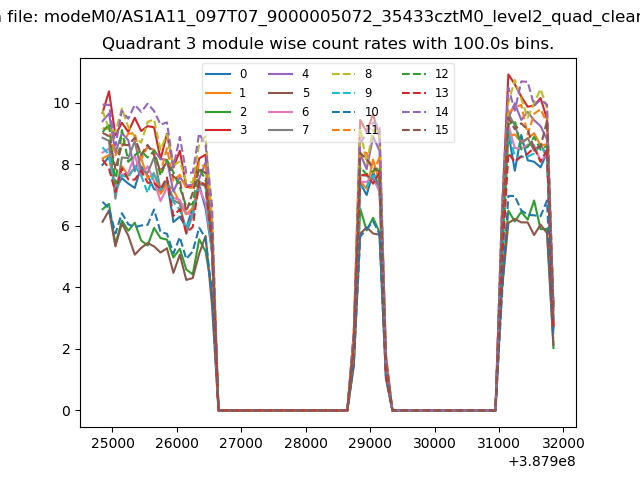 |
 |
| Parameter | Plot |
|---|---|
| CZT HV Monitor | 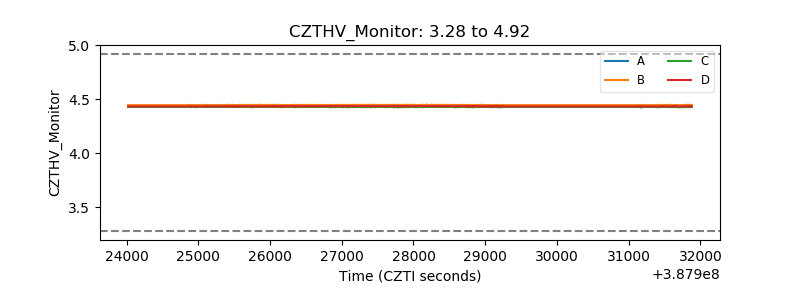 |
| D_VDD | 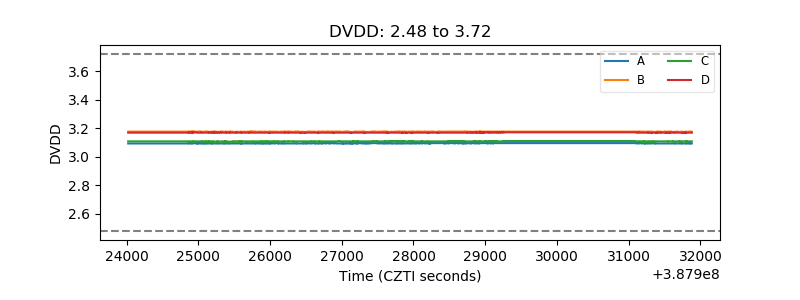 |
| Temperature 1 | 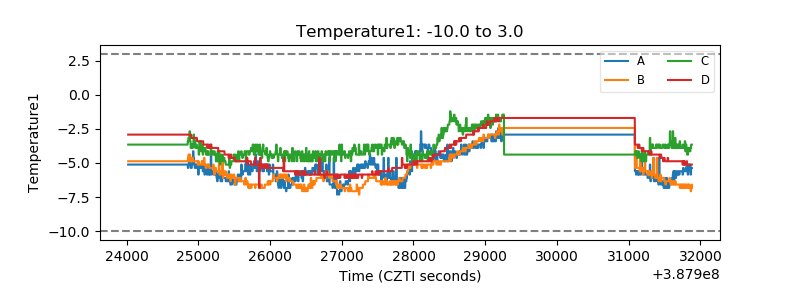 |
| Veto HV Monitor | 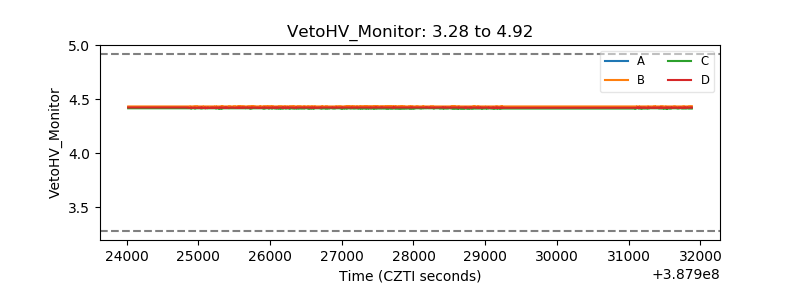 |
| Veto LLD | 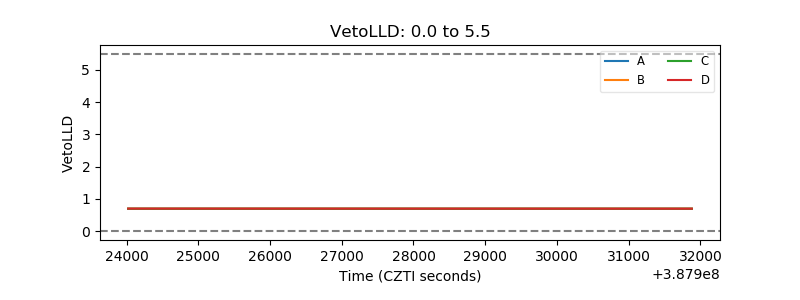 |
| Alpha Counter | 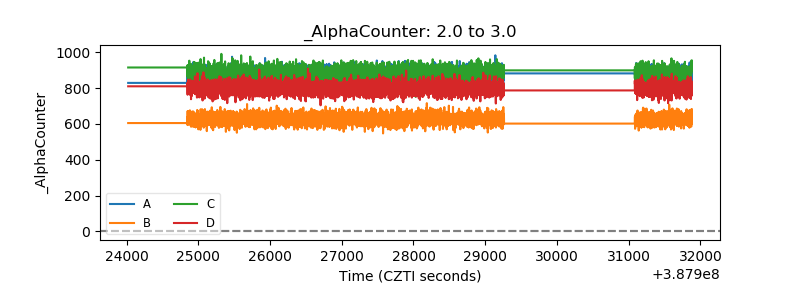 |
| _CPM_Rate | 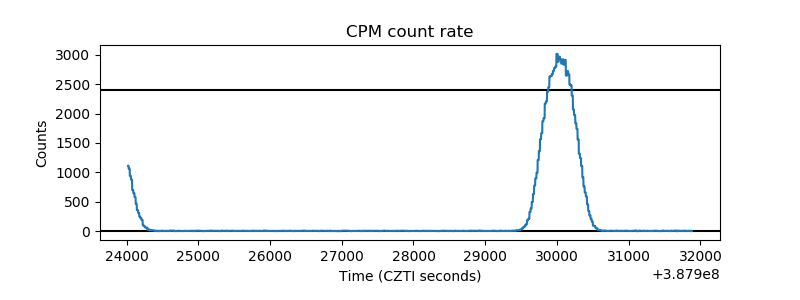 |
| CZT Counter | 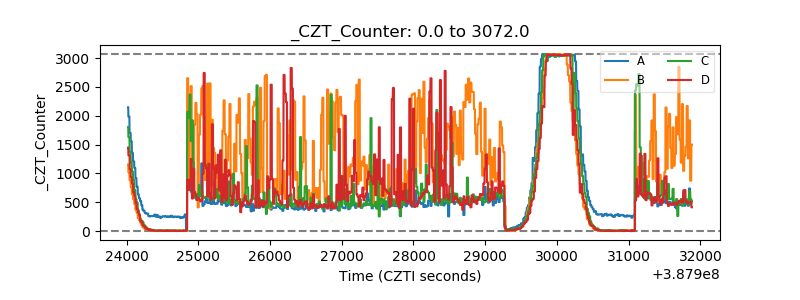 |
| +2.5 Volts monitor | 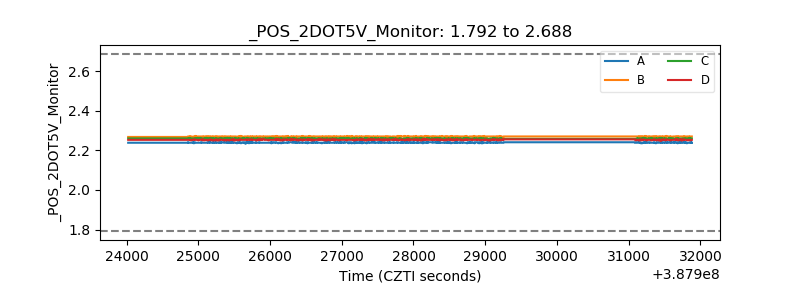 |
| +5 Volts monitor | 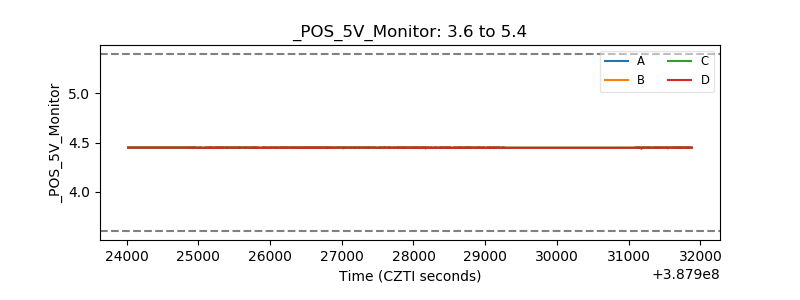 |
| _ROLL_ROT | 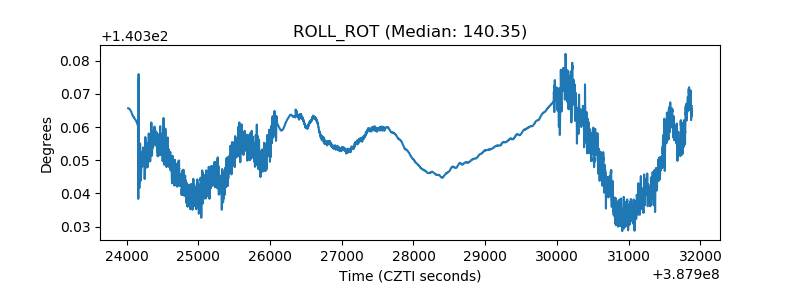 |
| _Roll_DEC | 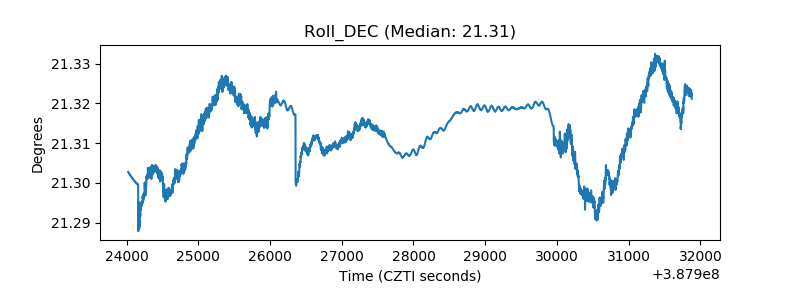 |
| _Roll_RA | 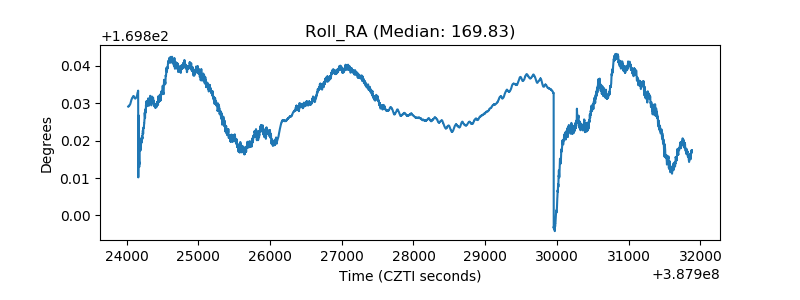 |
| Veto Counter | 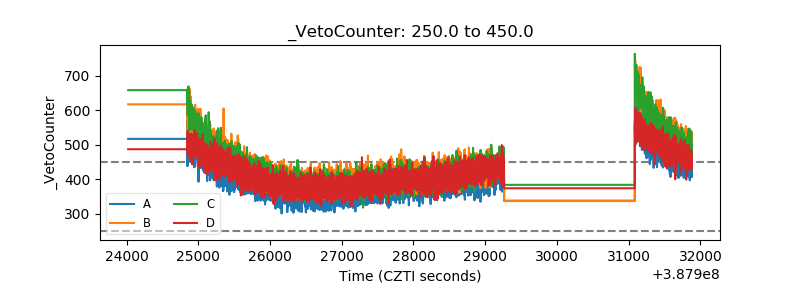 |