| Param | Original file | Final file |
|---|---|---|
| Filename | modeM0/AS1A11_097T07_9000005072_35431cztM0_level2.evt | modeM0/AS1A11_097T07_9000005072_35431cztM0_level2_quad_clean.evt |
| Size (bytes) | 630,132,480 | 63,169,920 |
| Size | 600.9 MB | 60.2 MB |
| Events in quadrant A | 2,578,730 | 418,617 |
| Events in quadrant B | 6,979,490 | 341,327 |
| Events in quadrant C | 3,267,751 | 408,526 |
| Events in quadrant D | 5,888,139 | 360,706 |
| Mode M0 | |||
|---|---|---|---|
| Quadrant | BADHDUFLAG | Total packets | Discarded packets |
| A | 0 | 11314 | 3 |
| B | 0 | 24403 | 2 |
| C | 0 | 13119 | 2 |
| D | 0 | 21298 | 2 |
| Mode M9 | |||
|---|---|---|---|
| Quadrant | BADHDUFLAG | Total packets | Discarded packets |
| A | 0 | 24 | 0 |
| B | 0 | 24 | 0 |
| C | 0 | 24 | 0 |
| D | 0 | 25 | 0 |
| Mode SS | |||
|---|---|---|---|
| Quadrant | BADHDUFLAG | Total packets | Discarded packets |
| A | 0 | 112 | 0 |
| B | 0 | 112 | 0 |
| C | 0 | 112 | 0 |
| D | 0 | 112 | 0 |
| Quadrant | Total seconds | Saturated seconds | Saturation percentage |
|---|---|---|---|
| A | 5463 | 10 | 0.183050% |
| B | 5463 | 1418 | 25.956434% |
| C | 5463 | 132 | 2.416255% |
| D | 5463 | 822 | 15.046678% |
Noise dominated data is calculated using 1-second bins in cleaned event files. If a bin has >2000 counts, and if more than 50% of those come from <1% of pixels, then it is considered to be noise-dominated and hence unusable.
| Quadrant | # 1 sec bins | Bins with >0 counts | Bins with >2000 counts | High rate bins dominated by noise | Noise dominated (total time) | Noise dominated (detector-on time) | Marked lightcurve |
|---|---|---|---|---|---|---|---|
| A | 7167 | 5464 | 2 | 2 | 0.03% | 0.04% | 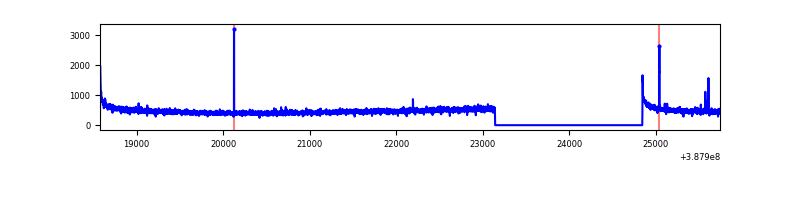 |
| B | 7167 | 5464 | 1167 | 1167 | 16.28% | 21.36% | 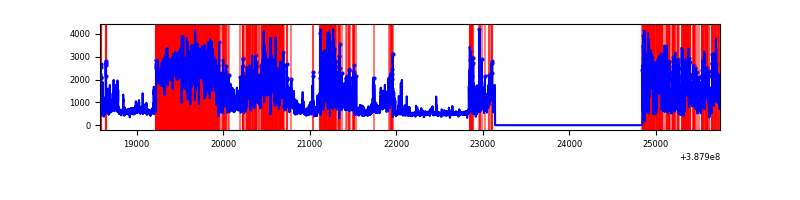 |
| C | 7167 | 5464 | 81 | 81 | 1.13% | 1.48% | 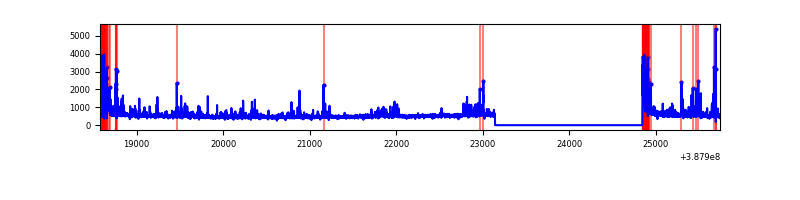 |
| D | 7167 | 5464 | 743 | 743 | 10.37% | 13.60% | 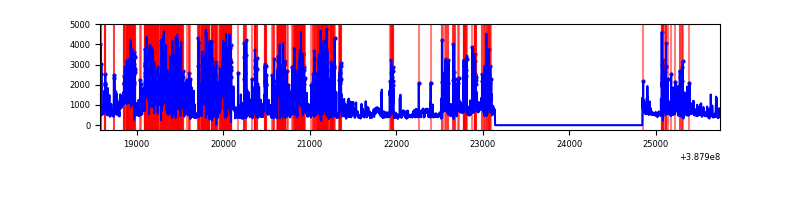 |
Top three noisy pixels from each quadrant. If the there are fewer than three noisy pixels in the level2.evt file, extra rows are filled as -1
| Pixel properties | Quadrant properties | ||||||
|---|---|---|---|---|---|---|---|
| Quadrant | DetID | PixID | Counts | Sigma | Mean | Median | Sigma |
| A | 10 | 83 | 125516 | 994.73 | 627 | 614 | 125.6 |
| A | 7 | 32 | 13614 | 103.53 | 627 | 614 | 125.6 |
| A | 13 | 254 | 10021 | 74.92 | 627 | 614 | 125.6 |
| B | 4 | 251 | 2717938 | 25070.27 | 561 | 545 | 108.4 |
| B | 5 | 236 | 1556074 | 14351.08 | 561 | 545 | 108.4 |
| B | 5 | 31 | 110368 | 1013.21 | 561 | 545 | 108.4 |
| C | 0 | 10 | 314726 | 2214.67 | 611 | 616 | 141.8 |
| C | 0 | 207 | 250542 | 1762.13 | 611 | 616 | 141.8 |
| C | 15 | 214 | 223090 | 1568.58 | 611 | 616 | 141.8 |
| D | 7 | 80 | 2838941 | 20206.87 | 574 | 558 | 140.5 |
| D | 10 | 203 | 404381 | 2874.88 | 574 | 558 | 140.5 |
| D | 1 | 47 | 94833 | 671.16 | 574 | 558 | 140.5 |
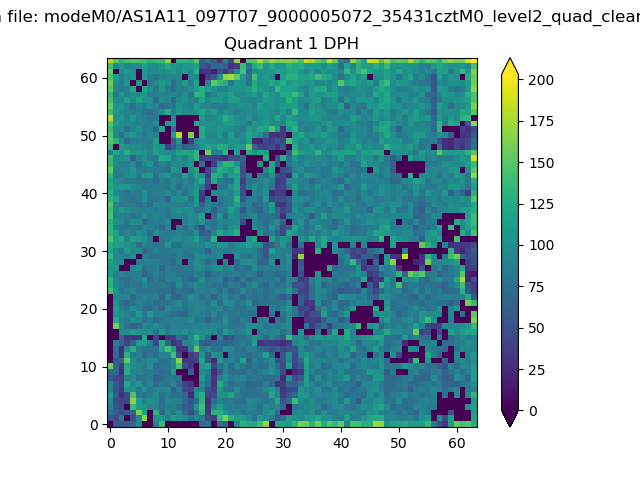
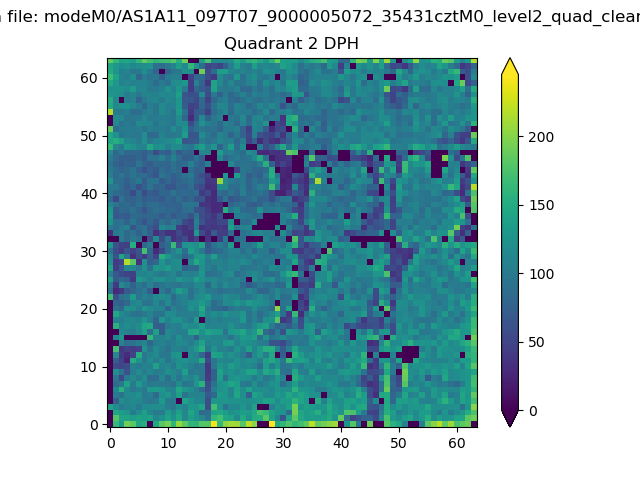
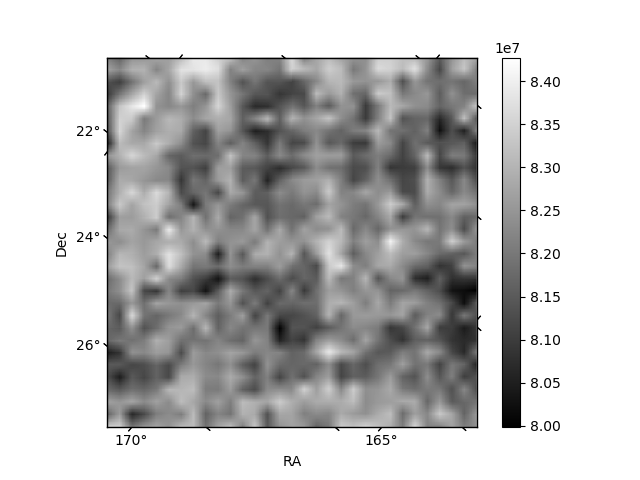
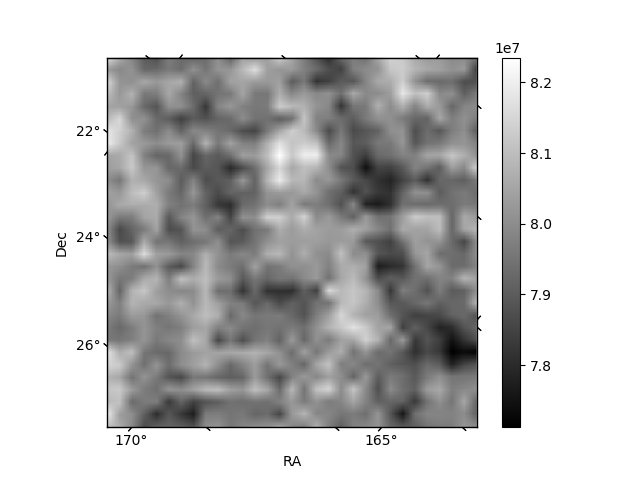
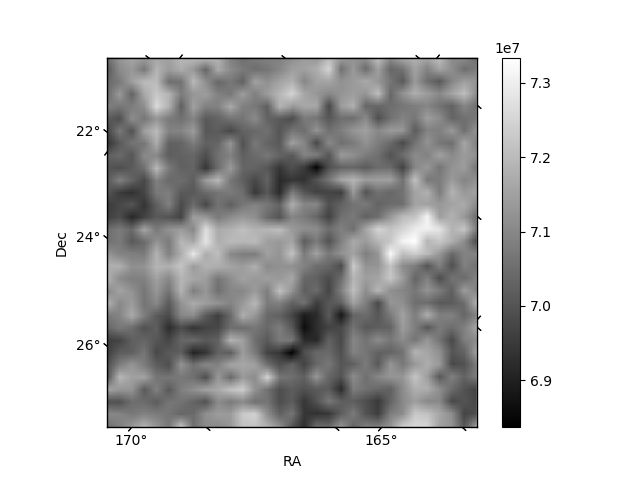
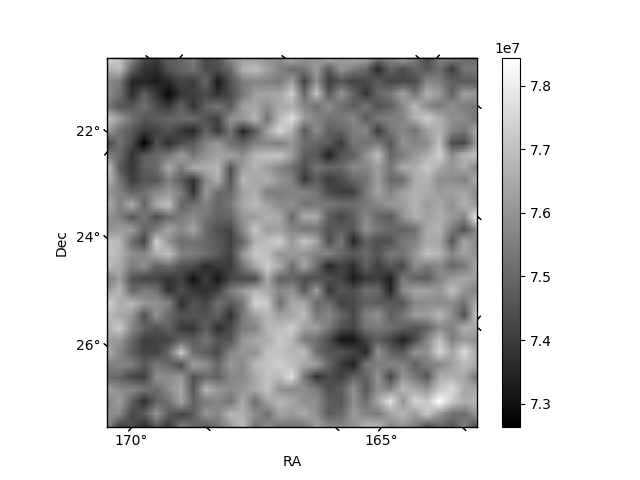
Histogram calculated using DETX and DETY for each event in the final _common_clean file
| Quadrant A |  |
 |
Quadrant B |
|---|---|---|---|
| Quadrant D | 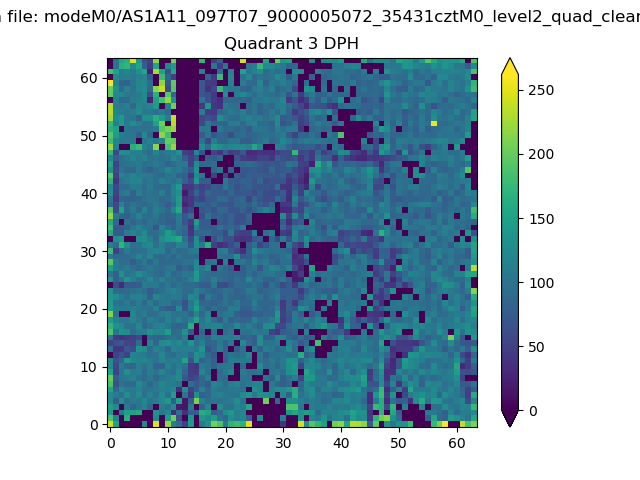 |
 |
Quadrant C |
| Plot type | Count rate plots | Images |
|---|---|---|
| Comparison with Poisson distribution Blue bars denote a histogram of data divided into 1 sec bins. Red curve is a Poisson curve with rate = median count rate of data. |
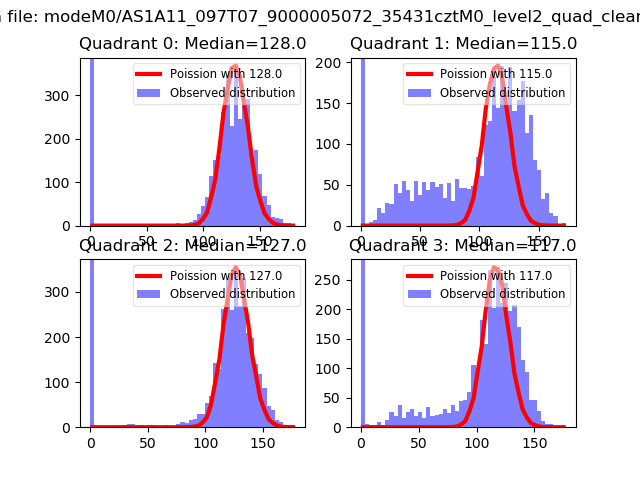 |
 |
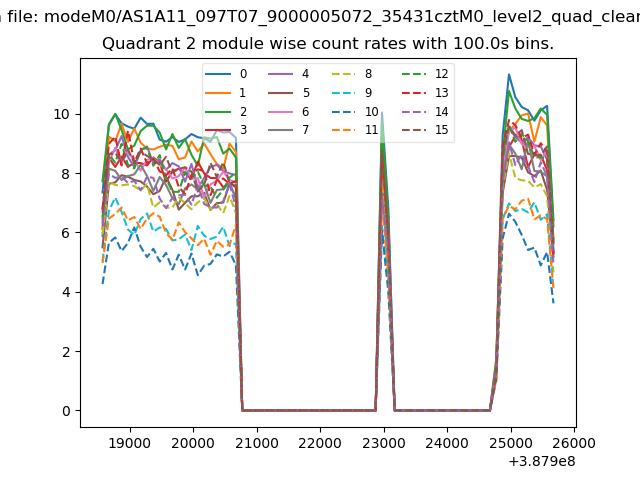
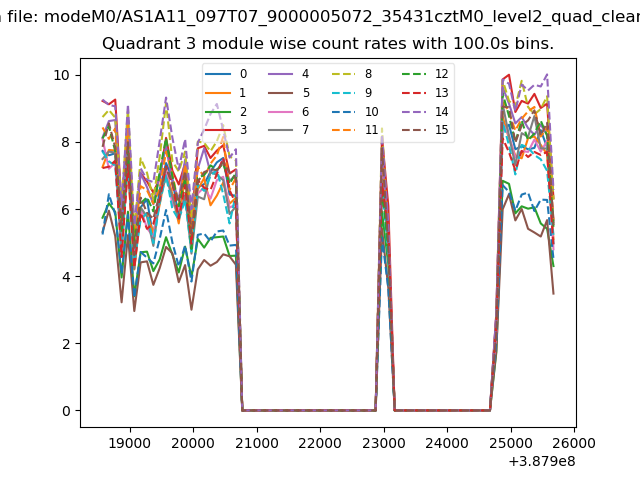
| Quadrant-wise count rates Data is divided into 100 sec bins |
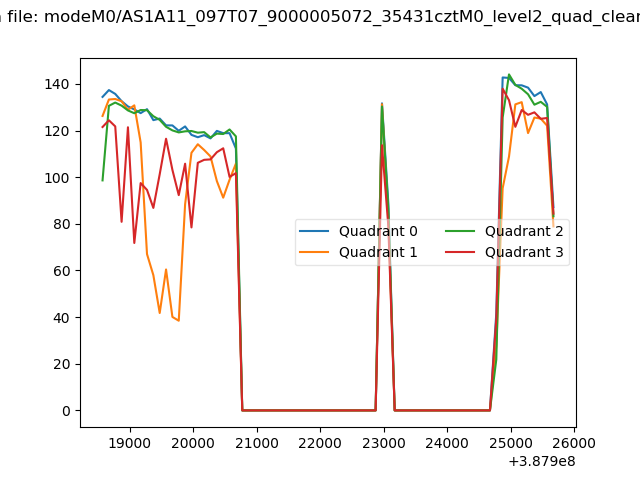 |
|
| Module-wise count rates for Quadrant A Data is divided into 100 sec bins |
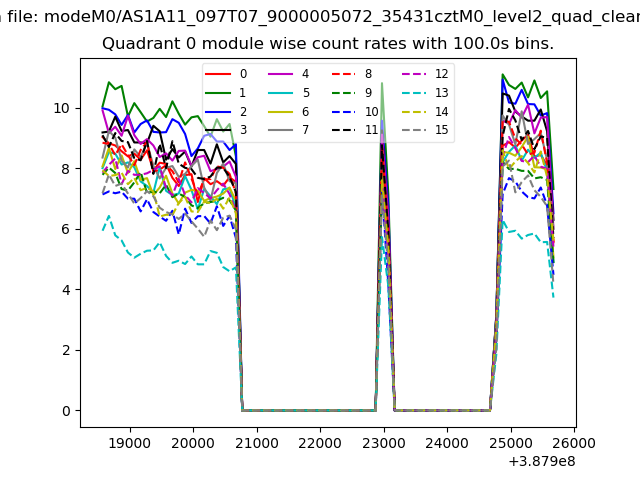 |
 |
| Module-wise count rates for Quadrant B Data is divided into 100 sec bins |
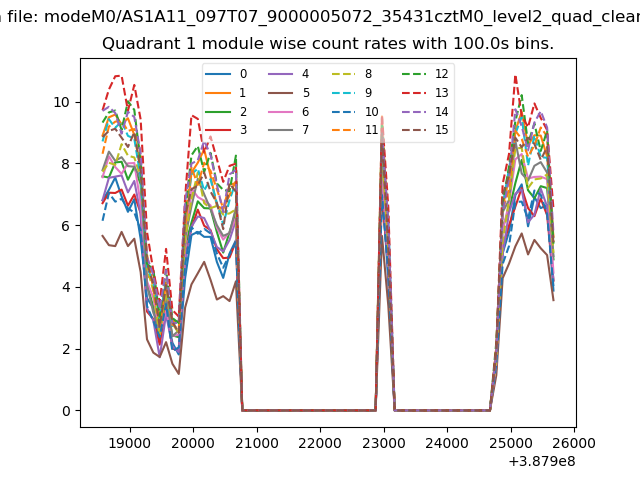 |
 |
| Module-wise count rates for Quadrant C Data is divided into 100 sec bins |
 |
 |
| Module-wise count rates for Quadrant D Data is divided into 100 sec bins |
 |
 |
| Parameter | Plot |
|---|---|
| CZT HV Monitor | 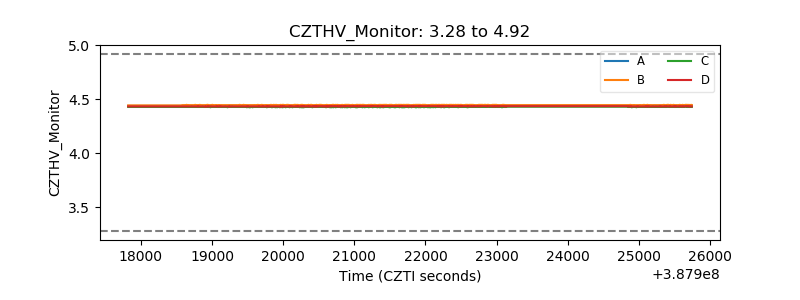 |
| D_VDD | 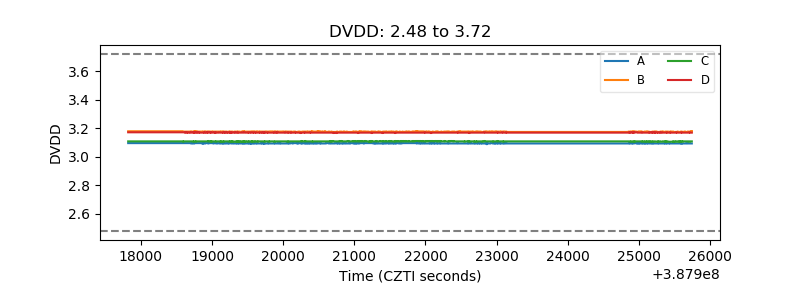 |
| Temperature 1 | 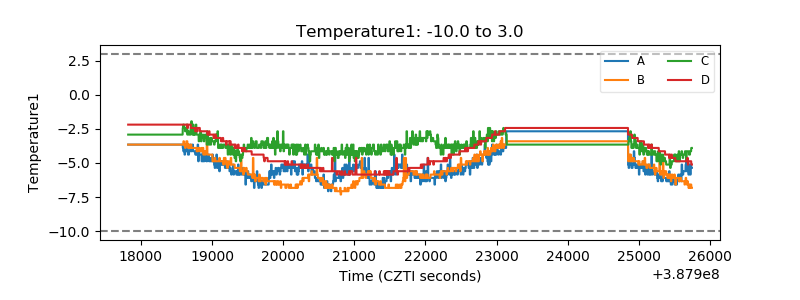 |
| Veto HV Monitor | 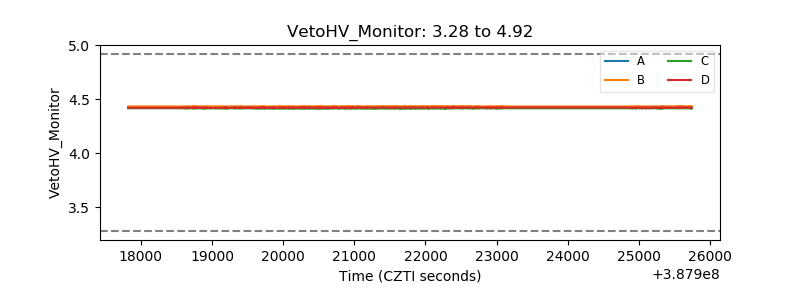 |
| Veto LLD | 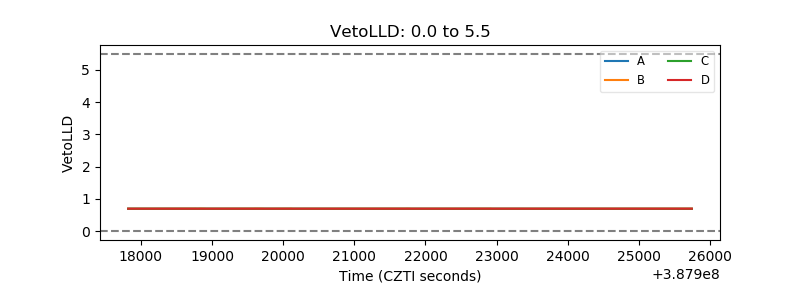 |
| Alpha Counter |  |
| _CPM_Rate | 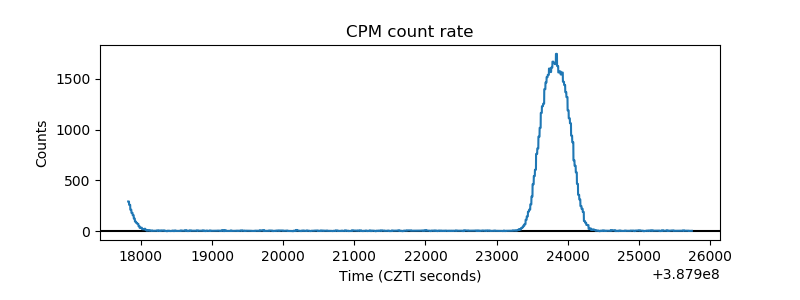 |
| CZT Counter | 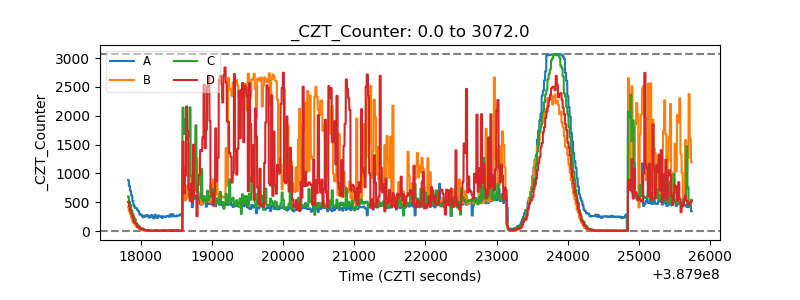 |
| +2.5 Volts monitor | 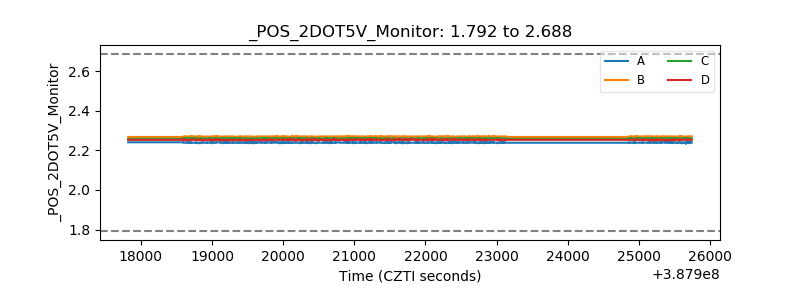 |
| +5 Volts monitor | 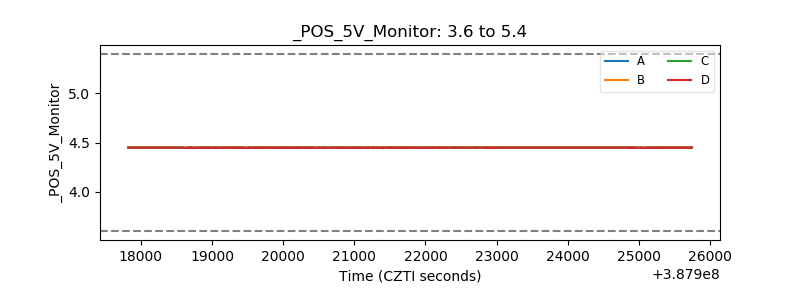 |
| _ROLL_ROT | 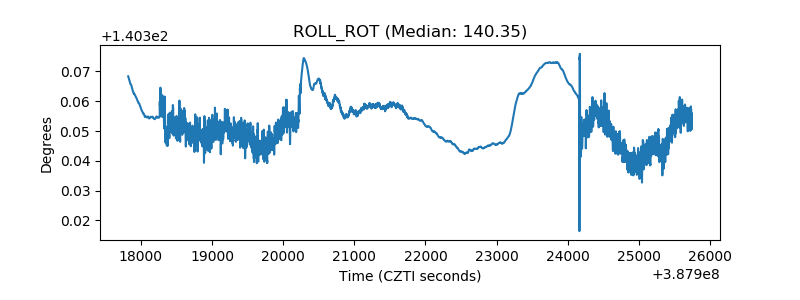 |
| _Roll_DEC | 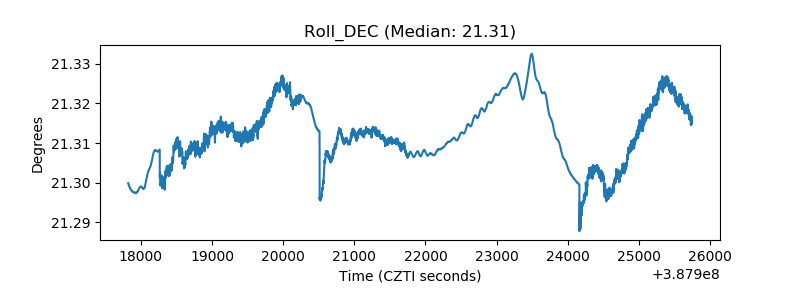 |
| _Roll_RA | 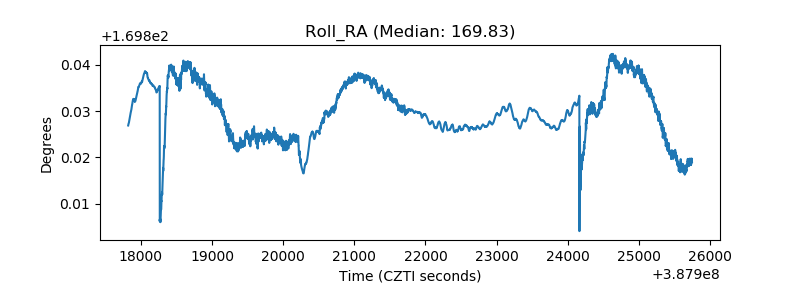 |
| Veto Counter | 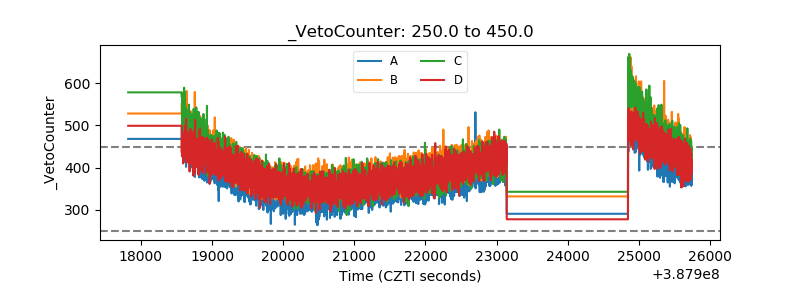 |