| Param | Original file | Final file |
|---|---|---|
| Filename | modeM0/AS1A11_097T07_9000005072_35430cztM0_level2.evt | modeM0/AS1A11_097T07_9000005072_35430cztM0_level2_quad_clean.evt |
| Size (bytes) | 687,611,520 | 64,932,480 |
| Size | 655.8 MB | 61.9 MB |
| Events in quadrant A | 2,629,525 | 440,798 |
| Events in quadrant B | 10,042,601 | 308,965 |
| Events in quadrant C | 3,503,096 | 429,217 |
| Events in quadrant D | 4,268,814 | 392,523 |
| Mode M0 | |||
|---|---|---|---|
| Quadrant | BADHDUFLAG | Total packets | Discarded packets |
| A | 0 | 11614 | 3 |
| B | 0 | 33652 | 2 |
| C | 0 | 13963 | 2 |
| D | 0 | 16544 | 2 |
| Mode M9 | |||
|---|---|---|---|
| Quadrant | BADHDUFLAG | Total packets | Discarded packets |
| A | 0 | 21 | 0 |
| B | 0 | 21 | 0 |
| C | 0 | 21 | 0 |
| D | 0 | 22 | 0 |
| Mode SS | |||
|---|---|---|---|
| Quadrant | BADHDUFLAG | Total packets | Discarded packets |
| A | 0 | 114 | 0 |
| B | 0 | 114 | 0 |
| C | 0 | 114 | 0 |
| D | 0 | 114 | 0 |
| Quadrant | Total seconds | Saturated seconds | Saturation percentage |
|---|---|---|---|
| A | 5623 | 7 | 0.124489% |
| B | 5623 | 2911 | 51.769518% |
| C | 5623 | 175 | 3.112218% |
| D | 5623 | 469 | 8.340743% |
Noise dominated data is calculated using 1-second bins in cleaned event files. If a bin has >2000 counts, and if more than 50% of those come from <1% of pixels, then it is considered to be noise-dominated and hence unusable.
| Quadrant | # 1 sec bins | Bins with >0 counts | Bins with >2000 counts | High rate bins dominated by noise | Noise dominated (total time) | Noise dominated (detector-on time) | Marked lightcurve |
|---|---|---|---|---|---|---|---|
| A | 7206 | 5624 | 0 | 0 | 0.00% | 0.00% | 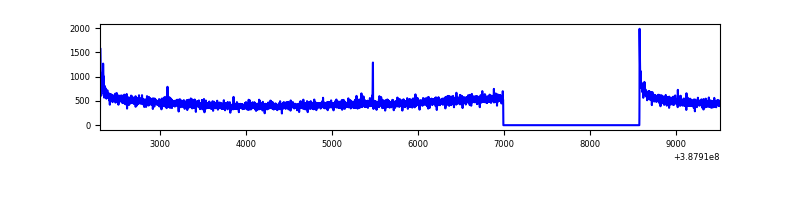 |
| B | 7206 | 5623 | 2481 | 2481 | 34.43% | 44.12% | 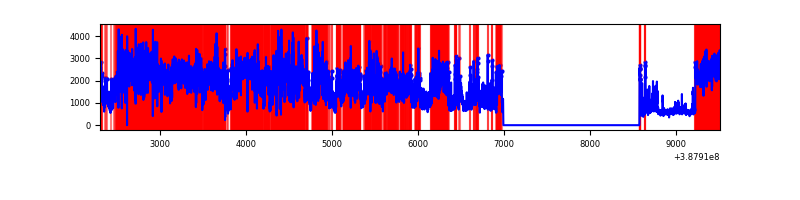 |
| C | 7206 | 5624 | 114 | 114 | 1.58% | 2.03% | 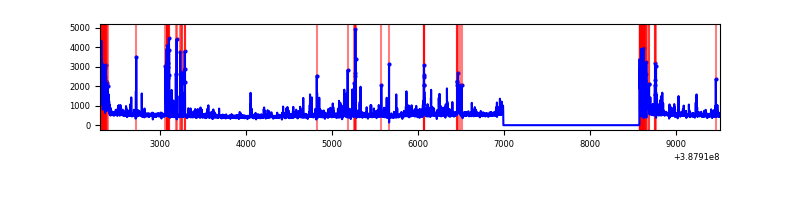 |
| D | 7206 | 5623 | 386 | 386 | 5.36% | 6.86% | 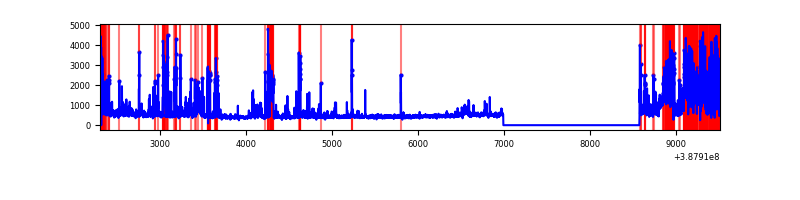 |
Top three noisy pixels from each quadrant. If the there are fewer than three noisy pixels in the level2.evt file, extra rows are filled as -1
| Pixel properties | Quadrant properties | ||||||
|---|---|---|---|---|---|---|---|
| Quadrant | DetID | PixID | Counts | Sigma | Mean | Median | Sigma |
| A | 10 | 83 | 130372 | 1000.05 | 641 | 628 | 129.7 |
| A | 9 | 143 | 10333 | 74.8 | 641 | 628 | 129.7 |
| A | 13 | 254 | 9271 | 66.62 | 641 | 628 | 129.7 |
| B | 4 | 251 | 3486008 | 34668.39 | 514 | 500 | 100.5 |
| B | 5 | 236 | 1136143 | 11295.6 | 514 | 500 | 100.5 |
| B | 5 | 31 | 1098107 | 10917.28 | 514 | 500 | 100.5 |
| C | 0 | 10 | 431612 | 2960.24 | 622 | 627 | 145.6 |
| C | 0 | 207 | 372368 | 2553.32 | 622 | 627 | 145.6 |
| C | 15 | 214 | 228070 | 1562.2 | 622 | 627 | 145.6 |
| D | 7 | 80 | 1229075 | 8292.07 | 607 | 591 | 148.2 |
| D | 12 | 233 | 178491 | 1200.8 | 607 | 591 | 148.2 |
| D | 13 | 249 | 127313 | 855.35 | 607 | 591 | 148.2 |
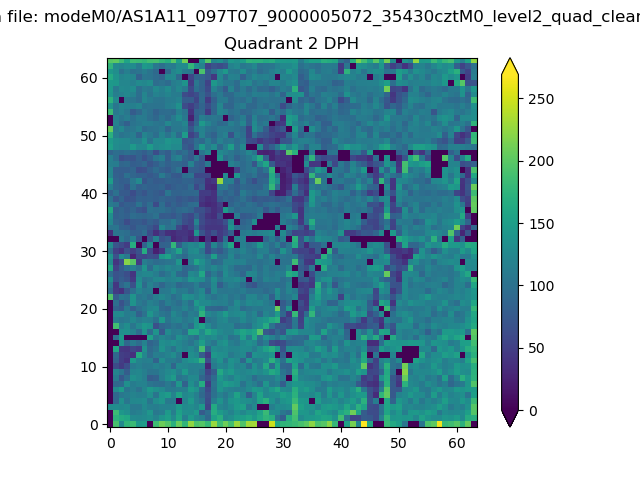
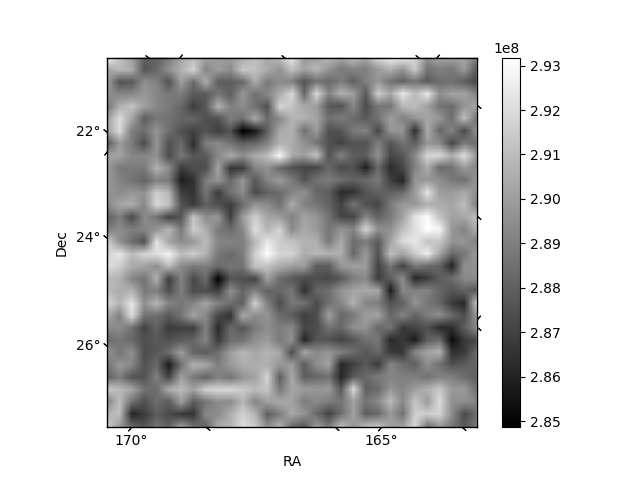
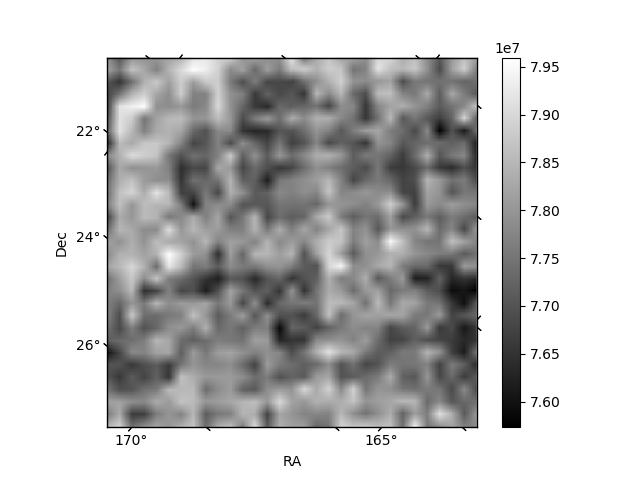
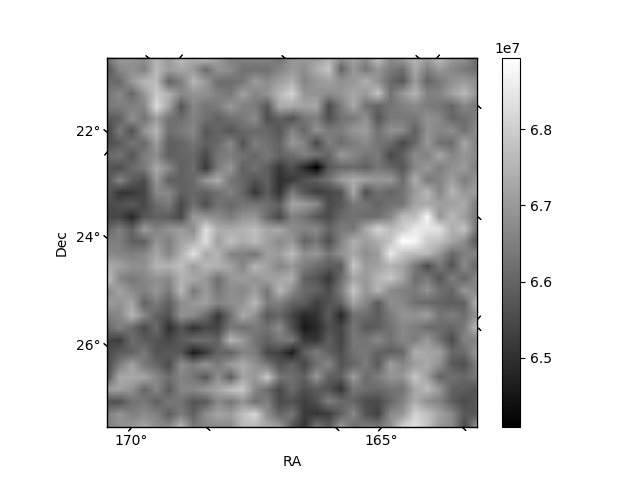
Histogram calculated using DETX and DETY for each event in the final _common_clean file
| Quadrant A | 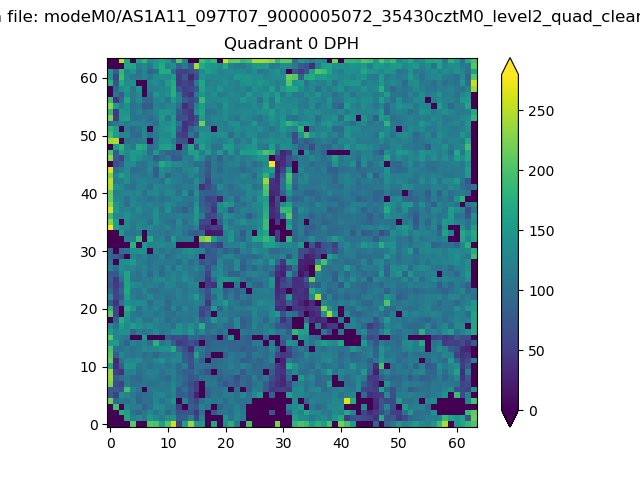 |
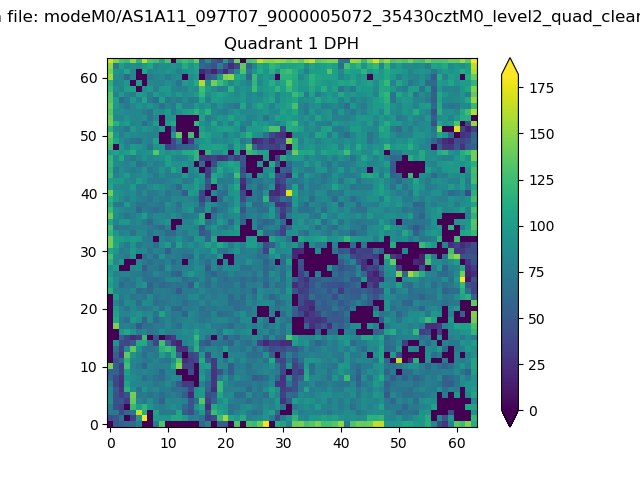 |
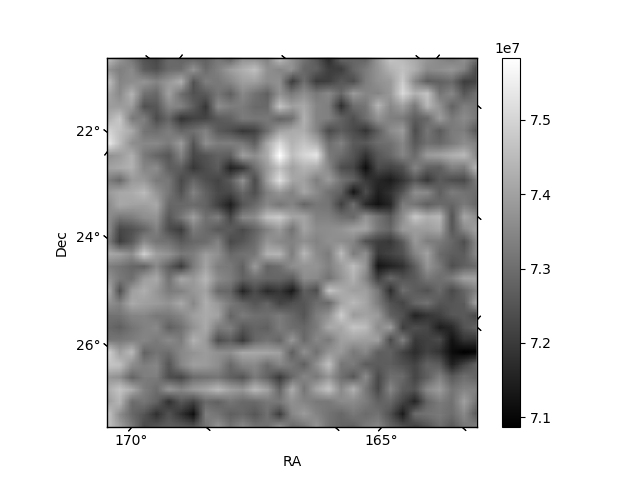
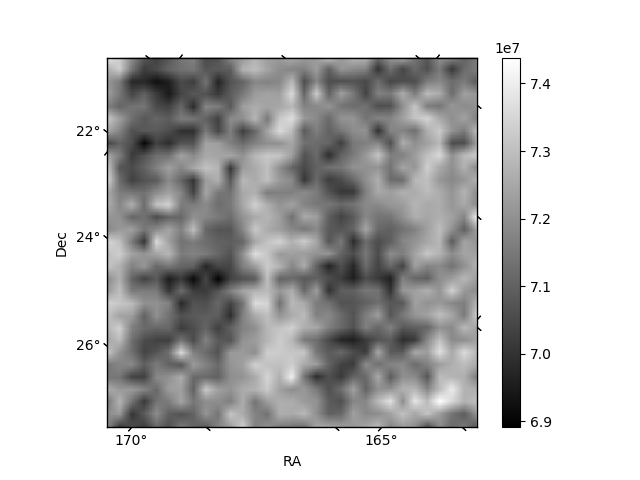
Quadrant B |
|---|---|---|---|
| Quadrant D | 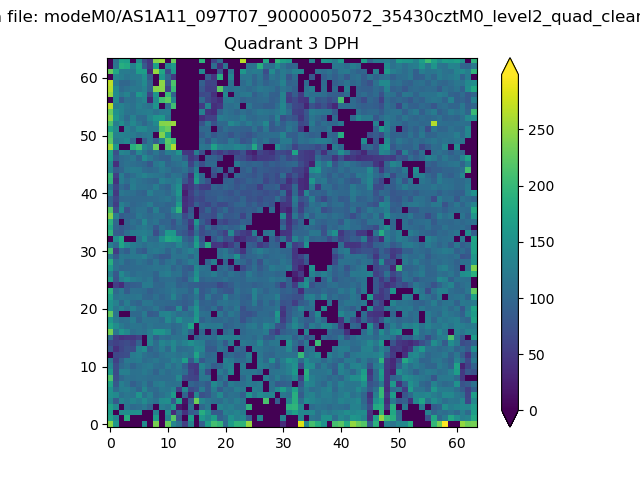 |
 |
Quadrant C |
| Plot type | Count rate plots | Images |
|---|---|---|
| Comparison with Poisson distribution Blue bars denote a histogram of data divided into 1 sec bins. Red curve is a Poisson curve with rate = median count rate of data. |
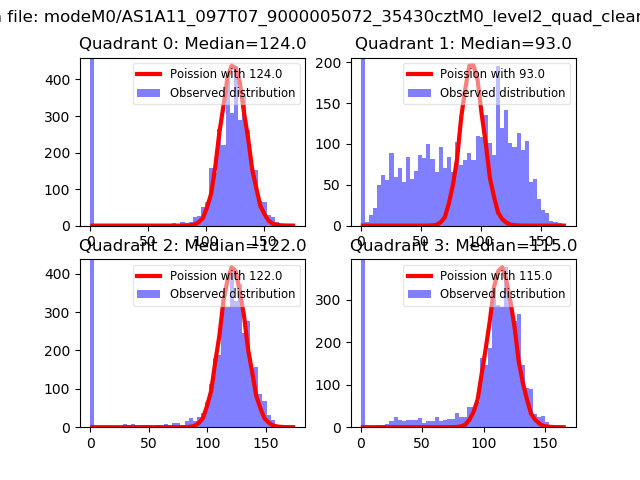 |
 |
| Quadrant-wise count rates Data is divided into 100 sec bins |
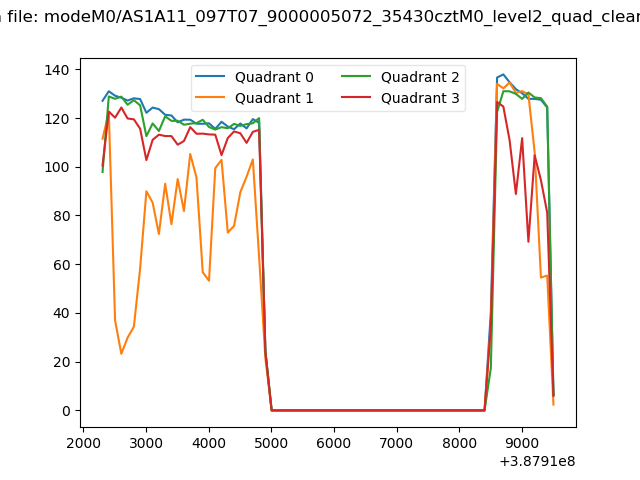 |
|
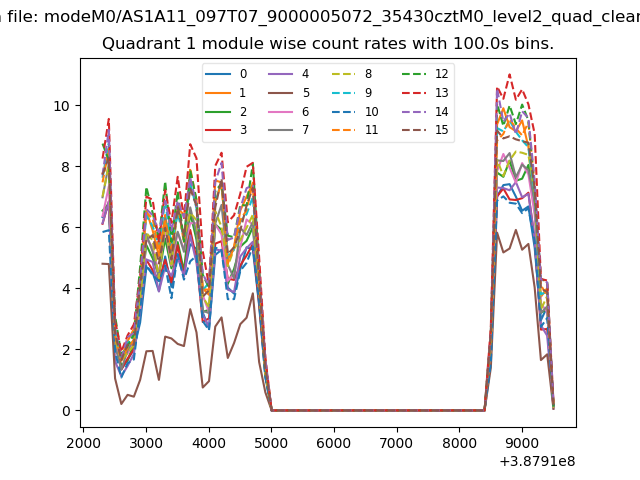
| Module-wise count rates for Quadrant A Data is divided into 100 sec bins |
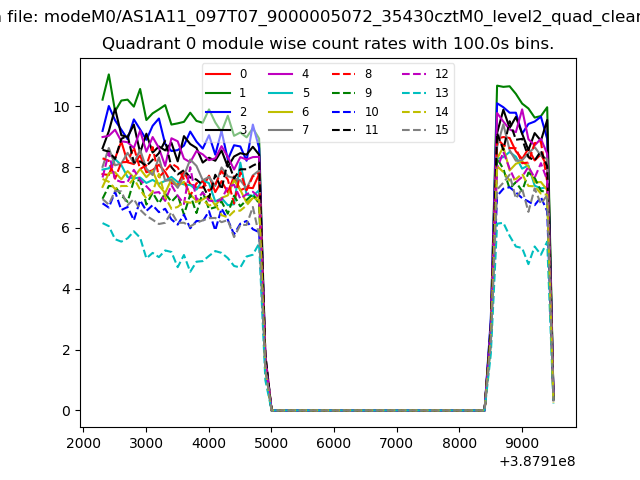 |
 |
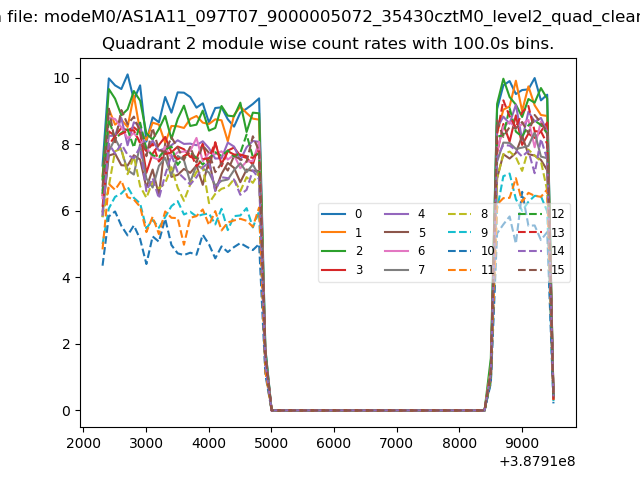
| Module-wise count rates for Quadrant B Data is divided into 100 sec bins |
 |
 |
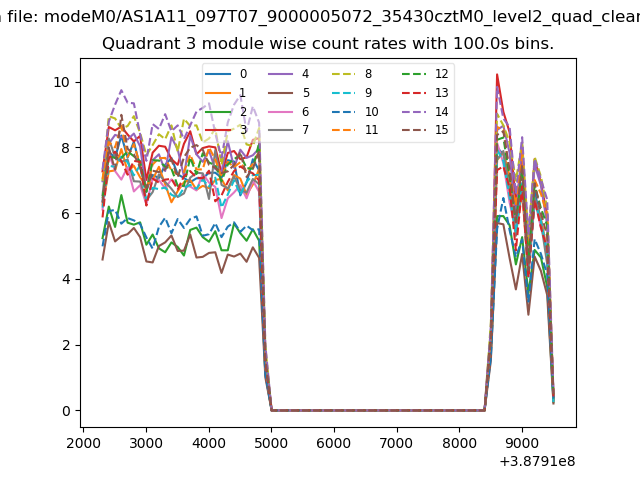
| Module-wise count rates for Quadrant C Data is divided into 100 sec bins |
 |
 |
| Module-wise count rates for Quadrant D Data is divided into 100 sec bins |
 |
 |
| Parameter | Plot |
|---|---|
| CZT HV Monitor | 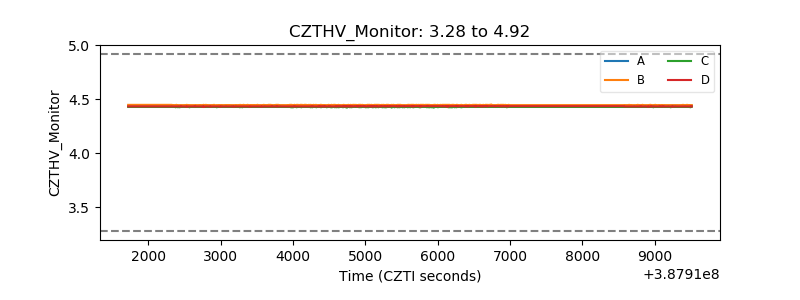 |
| D_VDD | 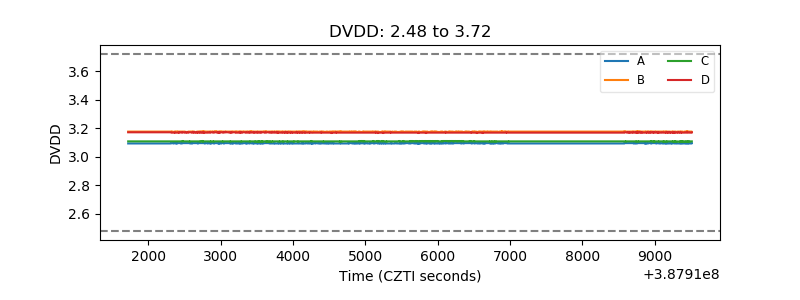 |
| Temperature 1 | 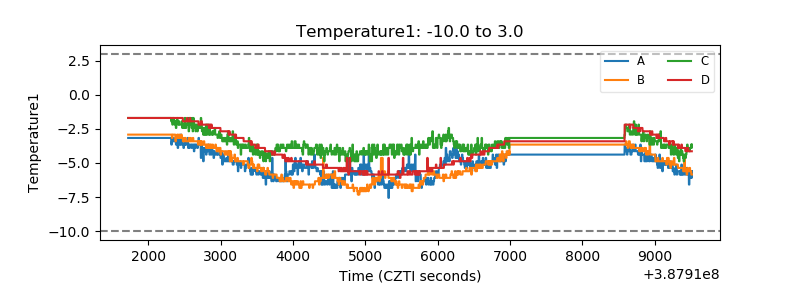 |
| Veto HV Monitor | 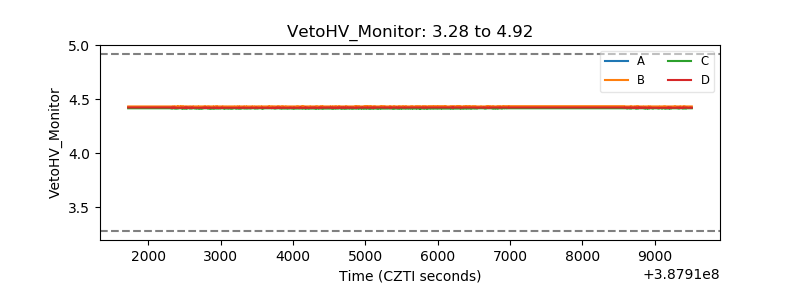 |
| Veto LLD | 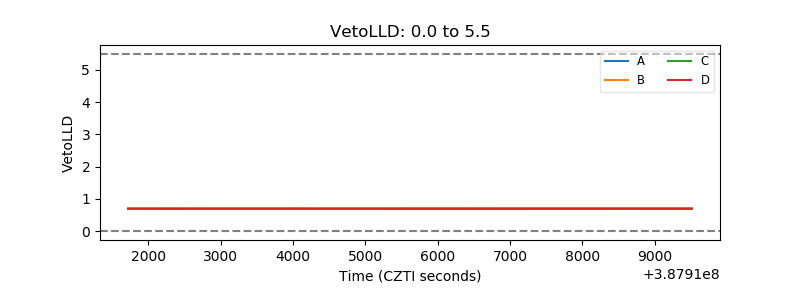 |
| Alpha Counter | 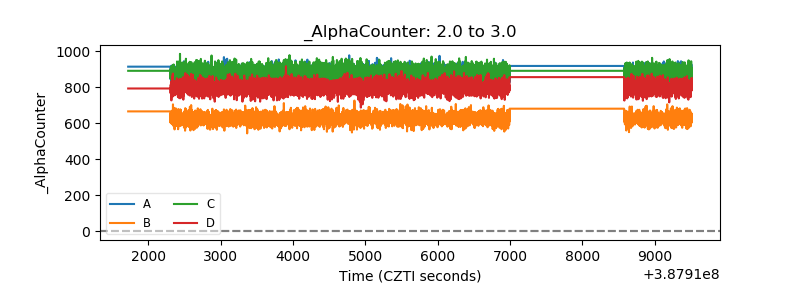 |
| _CPM_Rate | 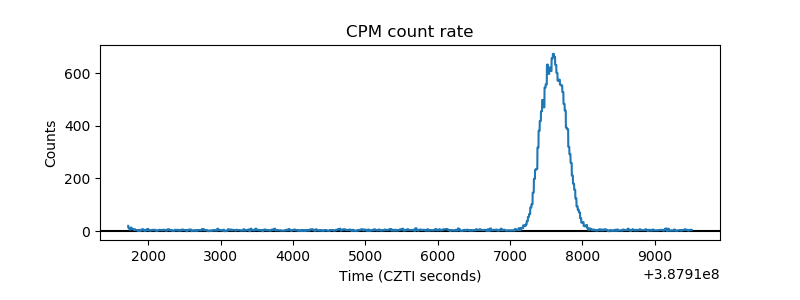 |
| CZT Counter | 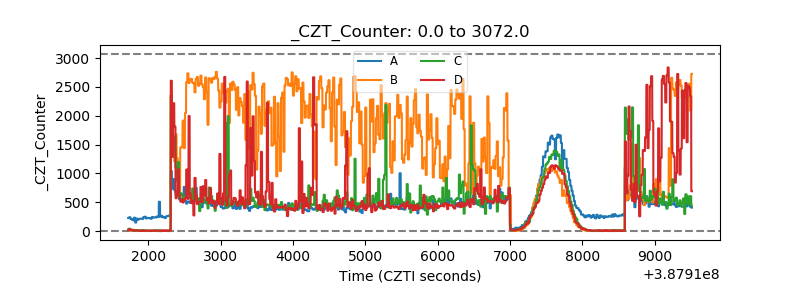 |
| +2.5 Volts monitor | 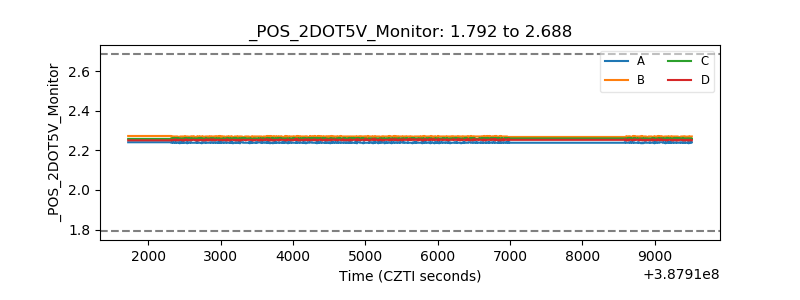 |
| +5 Volts monitor | 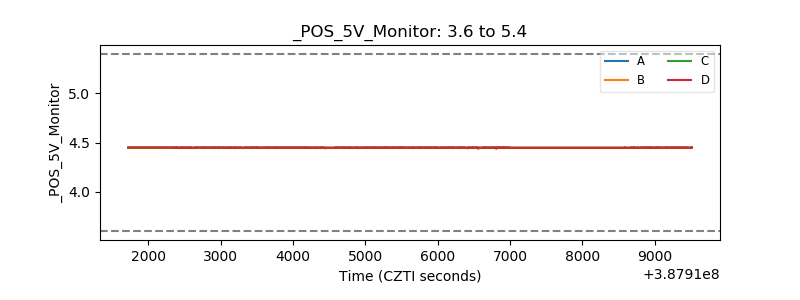 |
| _ROLL_ROT | 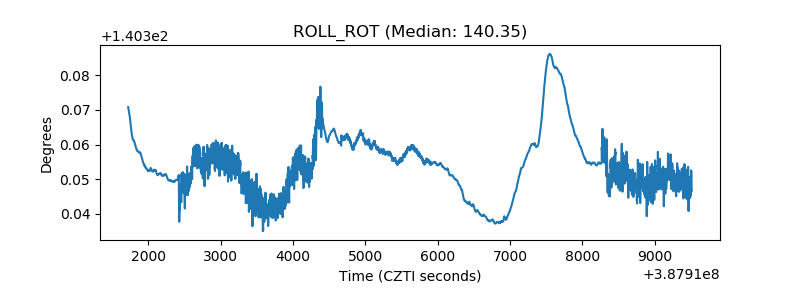 |
| _Roll_DEC | 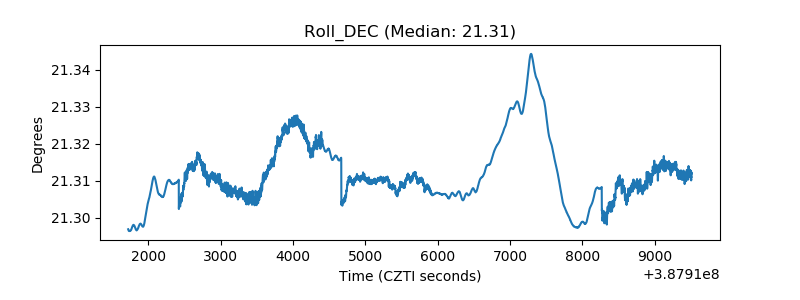 |
| _Roll_RA | 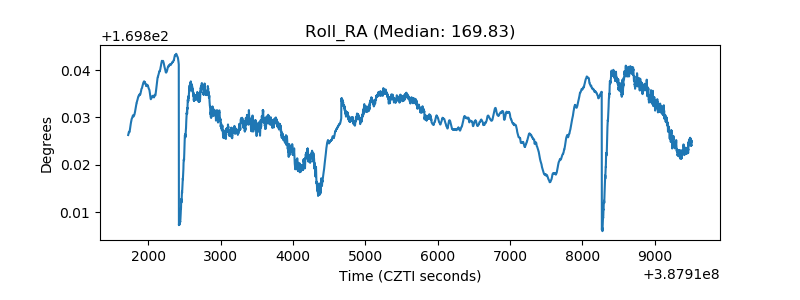 |
| Veto Counter | 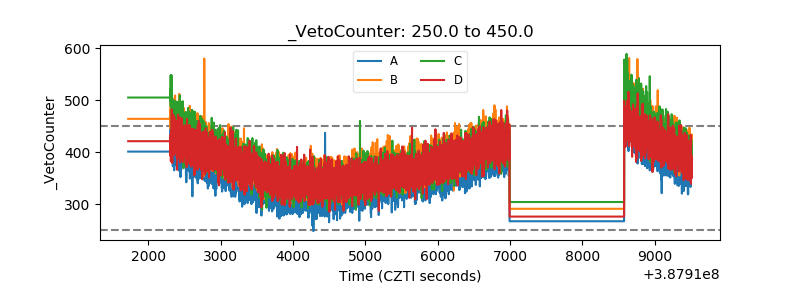 |