| Param | Original file | Final file |
|---|---|---|
| Filename | modeM0/AS1A11_097T07_9000005072_35429cztM0_level2.evt | modeM0/AS1A11_097T07_9000005072_35429cztM0_level2_quad_clean.evt |
| Size (bytes) | 1,499,253,120 | 130,020,480 |
| Size | 1.4 GB | 124.0 MB |
| Events in quadrant A | 5,013,877 | 916,330 |
| Events in quadrant B | 22,380,471 | 573,871 |
| Events in quadrant C | 6,207,592 | 894,458 |
| Events in quadrant D | 11,082,458 | 807,992 |
| Mode M0 | |||
|---|---|---|---|
| Quadrant | BADHDUFLAG | Total packets | Discarded packets |
| A | 0 | 21949 | 4 |
| B | 0 | 73794 | 3 |
| C | 0 | 25071 | 3 |
| D | 0 | 40047 | 3 |
| Mode M9 | |||
|---|---|---|---|
| Quadrant | BADHDUFLAG | Total packets | Discarded packets |
| A | 0 | 41 | 0 |
| B | 0 | 41 | 0 |
| C | 0 | 41 | 0 |
| D | 0 | 41 | 0 |
| Mode SS | |||
|---|---|---|---|
| Quadrant | BADHDUFLAG | Total packets | Discarded packets |
| A | 0 | 220 | 0 |
| B | 0 | 220 | 0 |
| C | 0 | 220 | 0 |
| D | 0 | 220 | 0 |
| Quadrant | Total seconds | Saturated seconds | Saturation percentage |
|---|---|---|---|
| A | 10714 | 12 | 0.112003% |
| B | 10714 | 8058 | 75.210006% |
| C | 10714 | 191 | 1.782714% |
| D | 10714 | 1838 | 17.155124% |
Noise dominated data is calculated using 1-second bins in cleaned event files. If a bin has >2000 counts, and if more than 50% of those come from <1% of pixels, then it is considered to be noise-dominated and hence unusable.
| Quadrant | # 1 sec bins | Bins with >0 counts | Bins with >2000 counts | High rate bins dominated by noise | Noise dominated (total time) | Noise dominated (detector-on time) | Marked lightcurve |
|---|---|---|---|---|---|---|---|
| A | 14864 | 10717 | 0 | 0 | 0.00% | 0.00% | 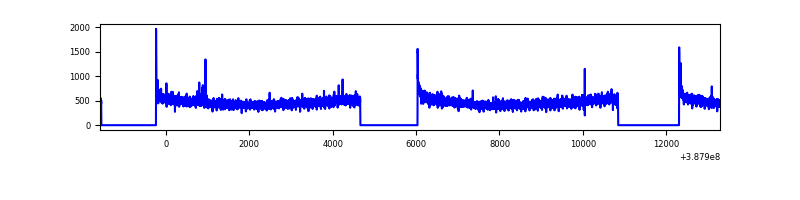 |
| B | 14864 | 10716 | 6719 | 6719 | 45.20% | 62.70% | 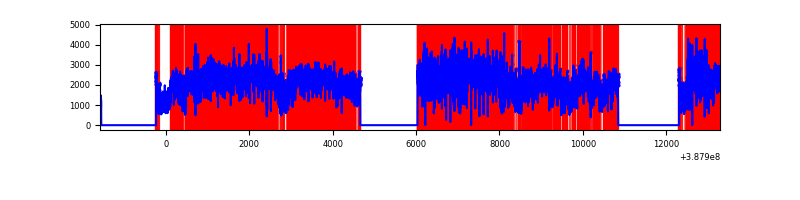 |
| C | 14864 | 10717 | 132 | 132 | 0.89% | 1.23% | 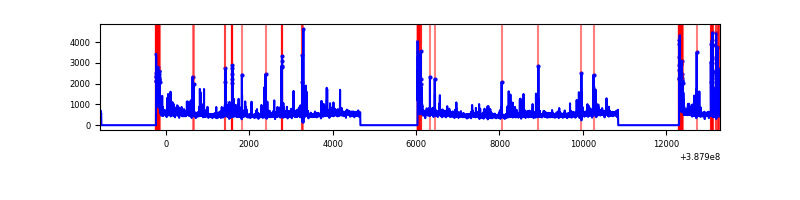 |
| D | 14864 | 10716 | 1406 | 1406 | 9.46% | 13.12% | 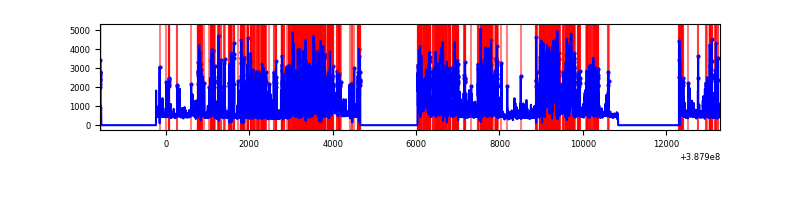 |
Top three noisy pixels from each quadrant. If the there are fewer than three noisy pixels in the level2.evt file, extra rows are filled as -1
| Pixel properties | Quadrant properties | ||||||
|---|---|---|---|---|---|---|---|
| Quadrant | DetID | PixID | Counts | Sigma | Mean | Median | Sigma |
| A | 10 | 83 | 218034 | 866.45 | 1234 | 1209 | 250.2 |
| A | 13 | 254 | 17237 | 64.05 | 1234 | 1209 | 250.2 |
| A | 3 | 137 | 13103 | 47.53 | 1234 | 1209 | 250.2 |
| B | 4 | 251 | 7841382 | 46753.55 | 860 | 835 | 167.7 |
| B | 5 | 31 | 3214401 | 19162.65 | 860 | 835 | 167.7 |
| B | 5 | 14 | 3190566 | 19020.52 | 860 | 835 | 167.7 |
| C | 0 | 10 | 557899 | 2006.94 | 1194 | 1199 | 277.4 |
| C | 0 | 207 | 516761 | 1858.63 | 1194 | 1199 | 277.4 |
| C | 15 | 214 | 431637 | 1551.76 | 1194 | 1199 | 277.4 |
| D | 7 | 80 | 5148012 | 18904.6 | 1112 | 1080 | 272.3 |
| D | 2 | 249 | 762479 | 2796.61 | 1112 | 1080 | 272.3 |
| D | 13 | 249 | 217552 | 795.1 | 1112 | 1080 | 272.3 |
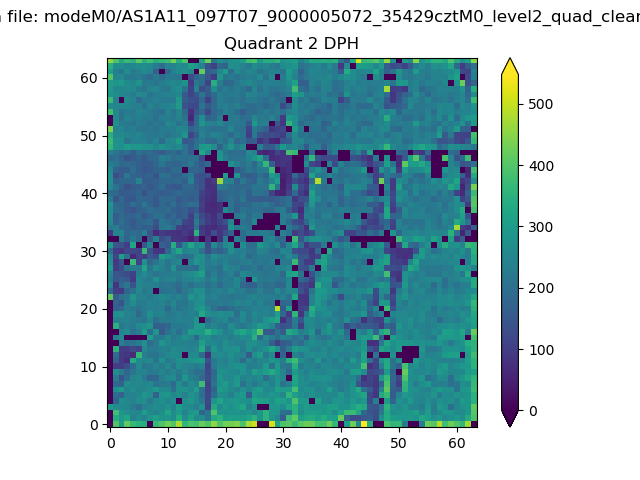
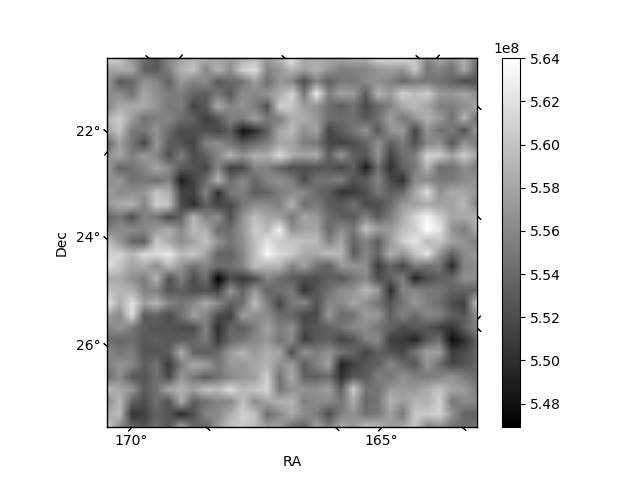
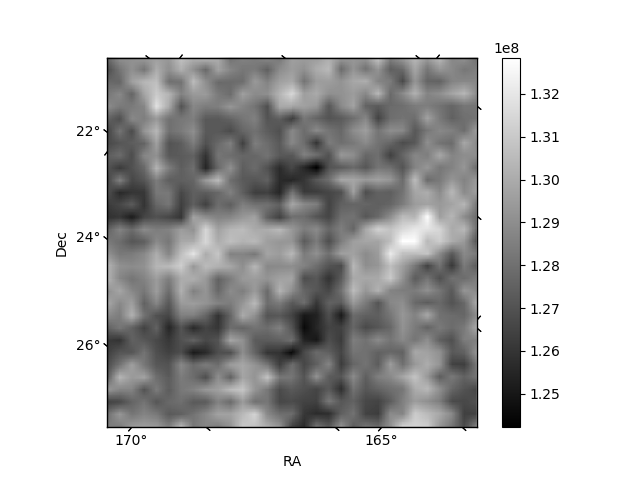
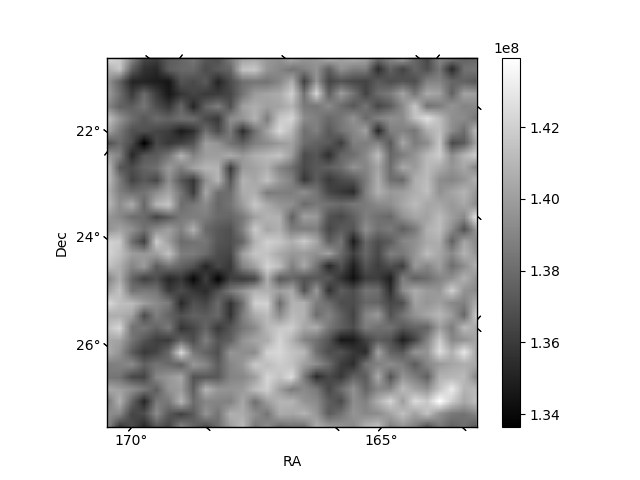
Histogram calculated using DETX and DETY for each event in the final _common_clean file
| Quadrant A | 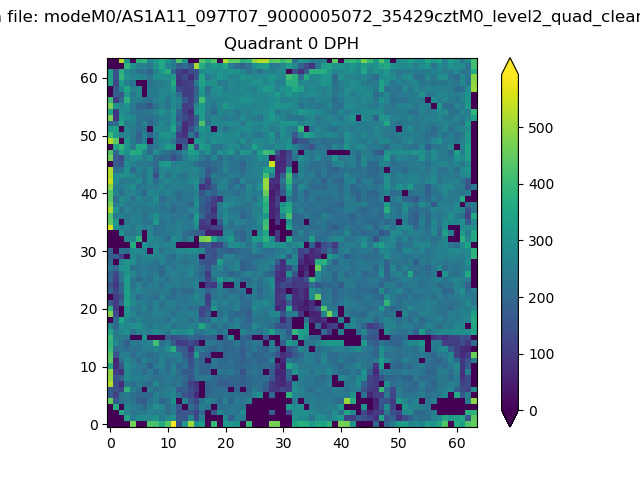 |
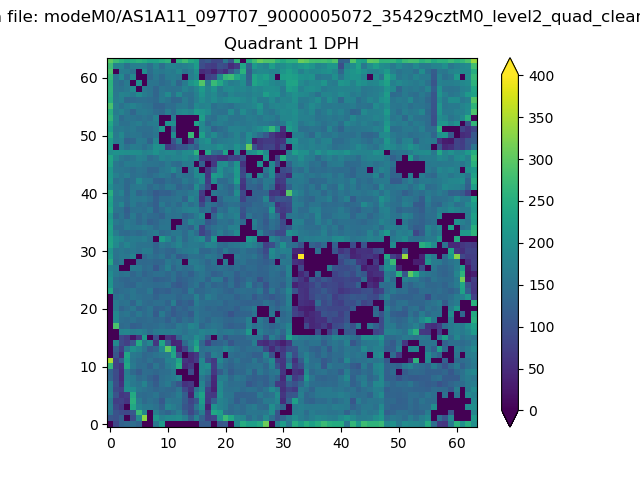 |
Quadrant B |
|---|---|---|---|
| Quadrant D | 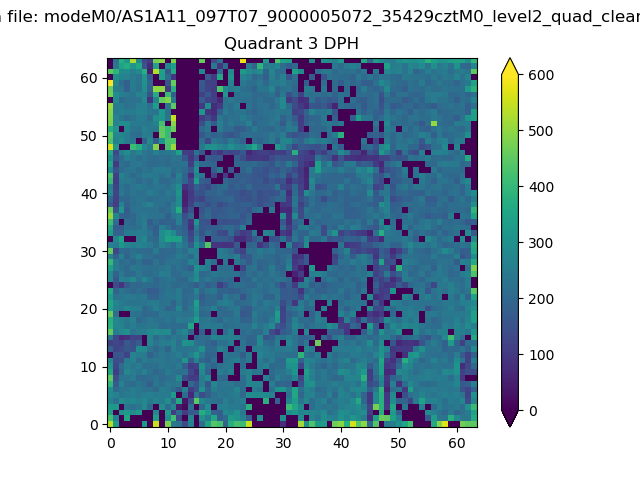 |
 |
Quadrant C |
| Plot type | Count rate plots | Images |
|---|---|---|
| Comparison with Poisson distribution Blue bars denote a histogram of data divided into 1 sec bins. Red curve is a Poisson curve with rate = median count rate of data. |
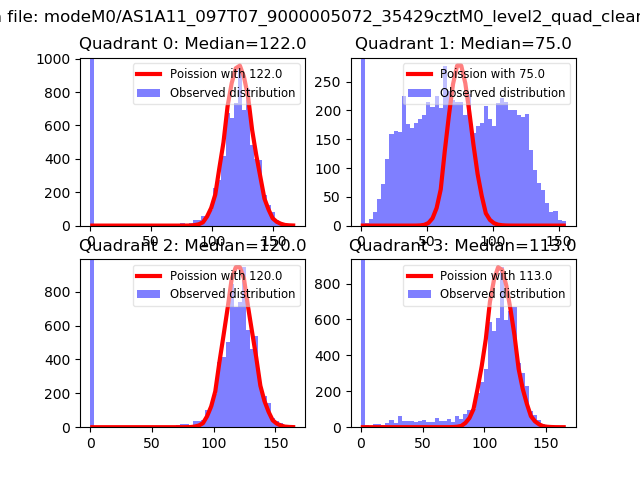 |
 |
| Quadrant-wise count rates Data is divided into 100 sec bins |
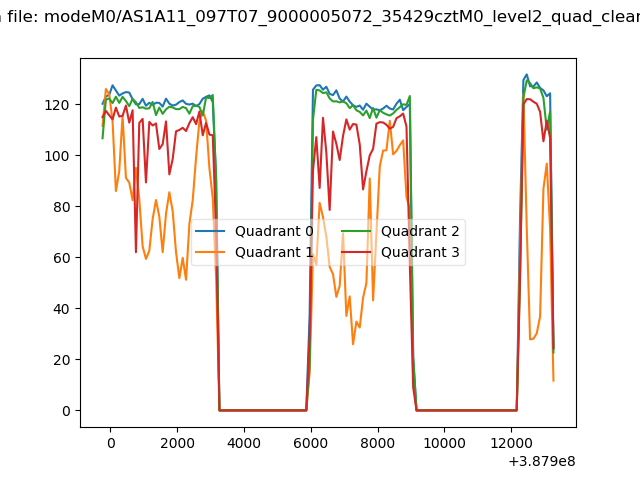 |
|
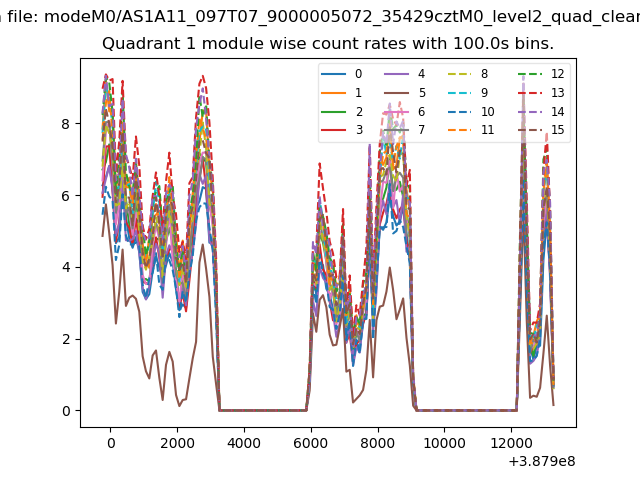
| Module-wise count rates for Quadrant A Data is divided into 100 sec bins |
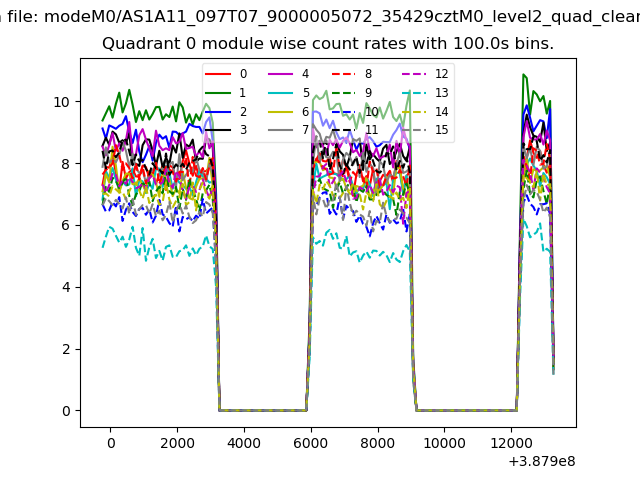 |
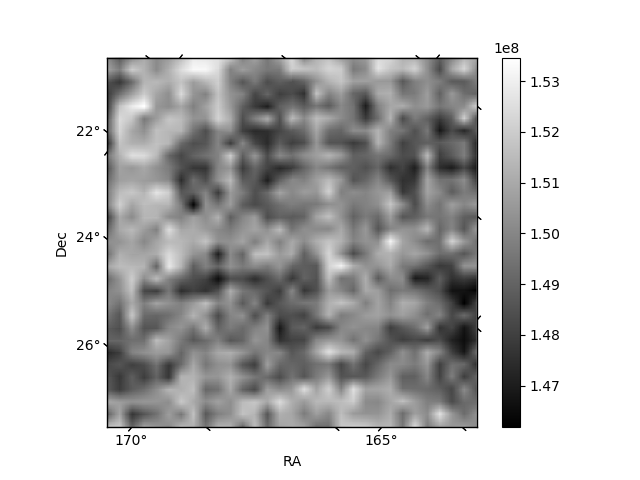 |
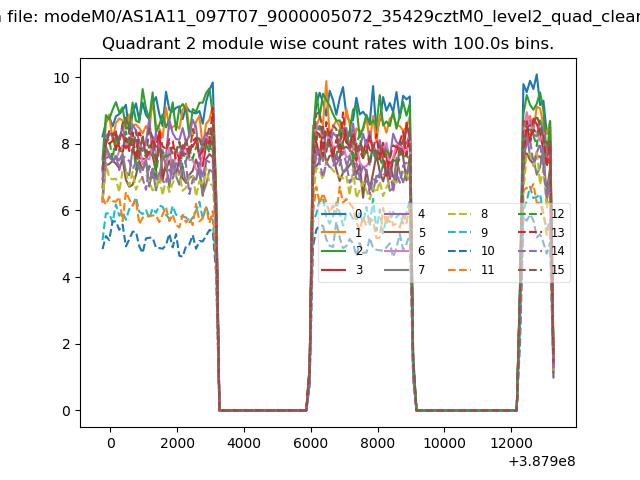
| Module-wise count rates for Quadrant B Data is divided into 100 sec bins |
 |
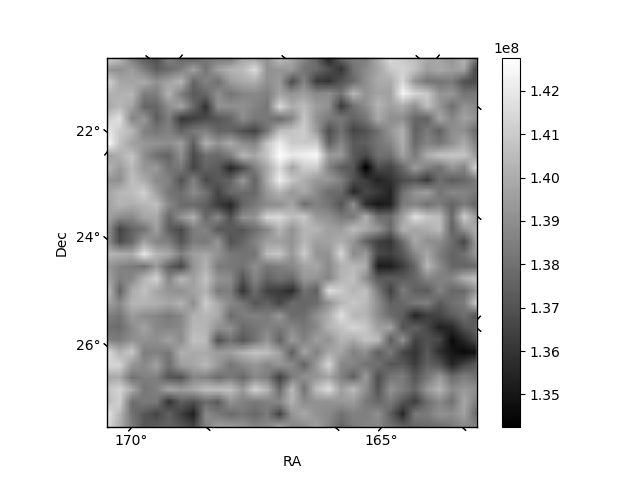 |
| Module-wise count rates for Quadrant C Data is divided into 100 sec bins |
 |
 |
| Module-wise count rates for Quadrant D Data is divided into 100 sec bins |
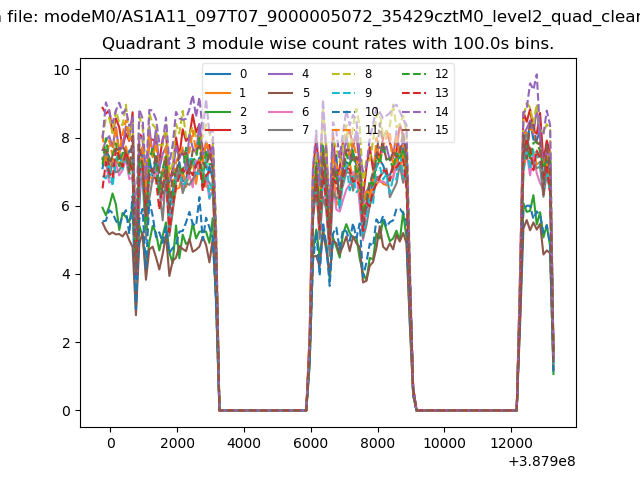 |
 |
| Parameter | Plot |
|---|---|
| CZT HV Monitor | 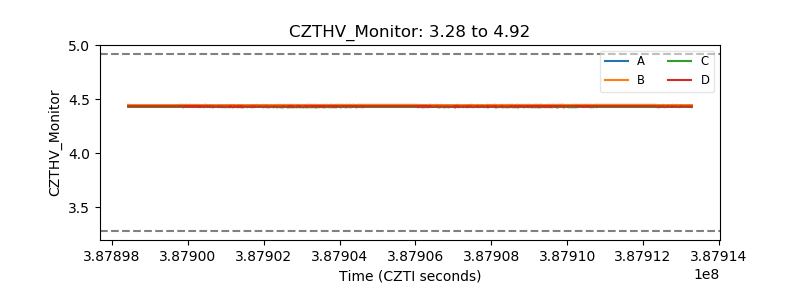 |
| D_VDD | 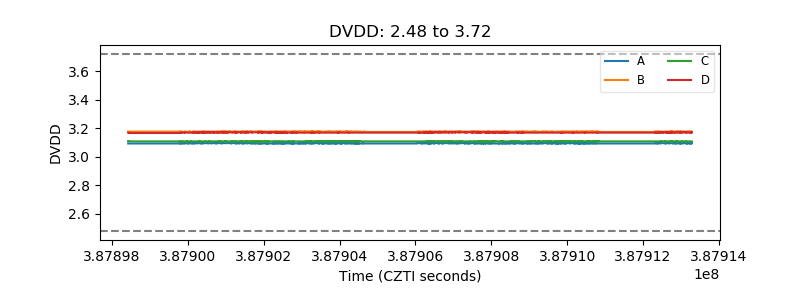 |
| Temperature 1 |  |
| Veto HV Monitor | 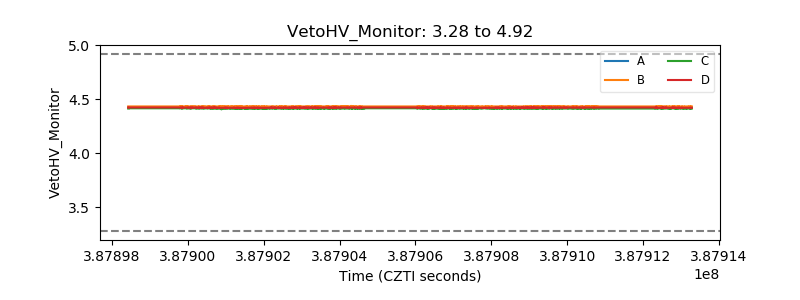 |
| Veto LLD | 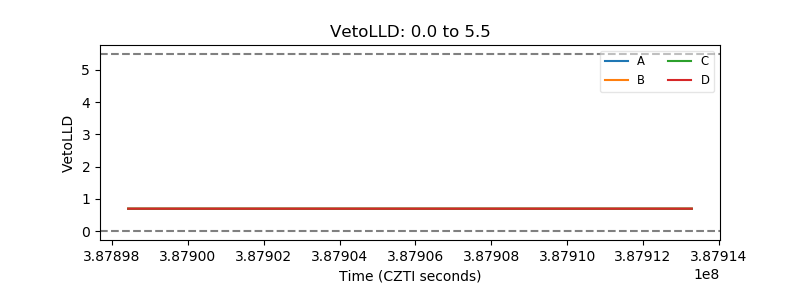 |
| Alpha Counter | 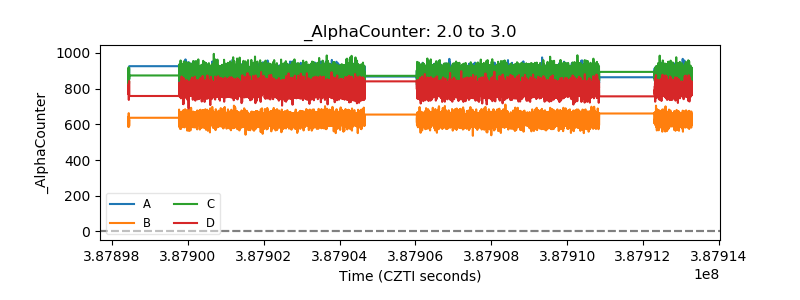 |
| _CPM_Rate | 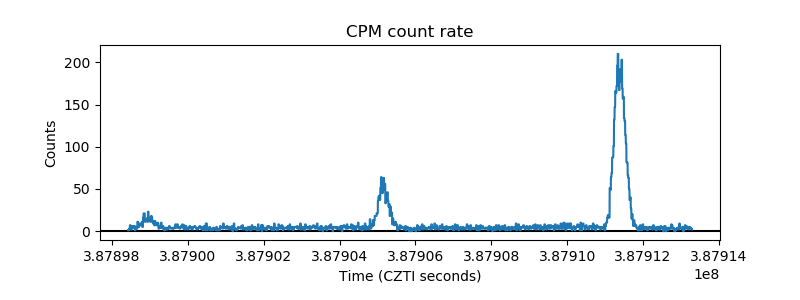 |
| CZT Counter | 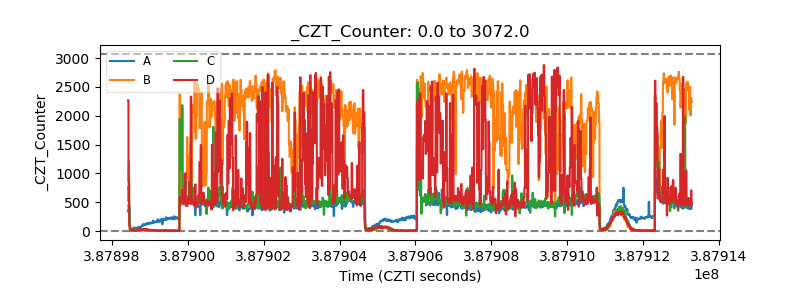 |
| +2.5 Volts monitor | 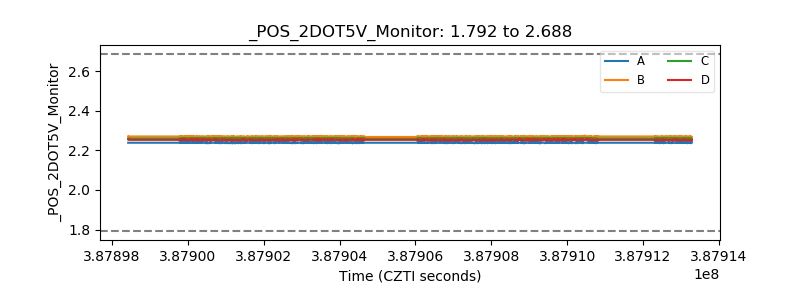 |
| +5 Volts monitor | 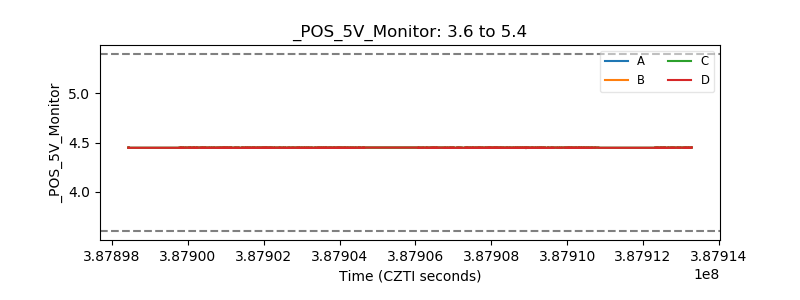 |
| _ROLL_ROT | 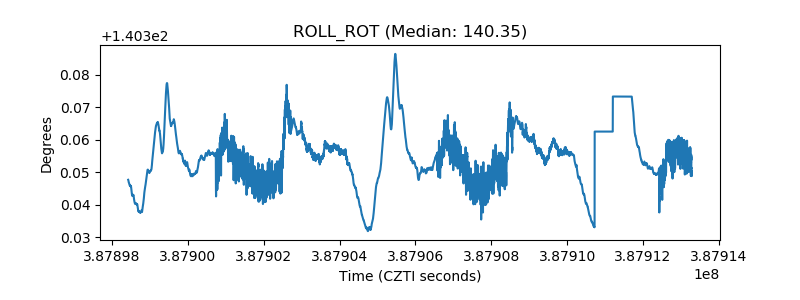 |
| _Roll_DEC | 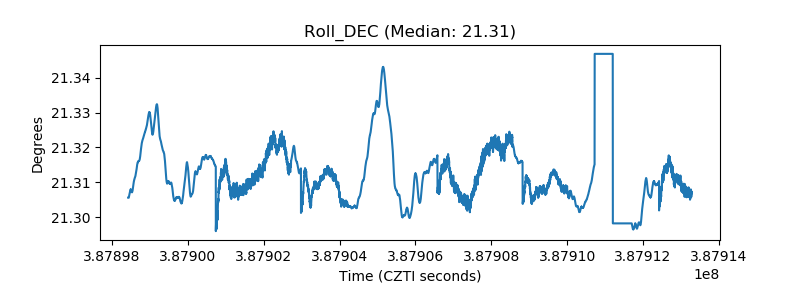 |
| _Roll_RA | 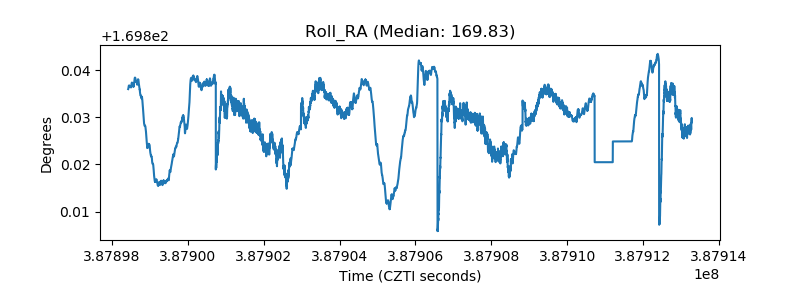 |
| Veto Counter | 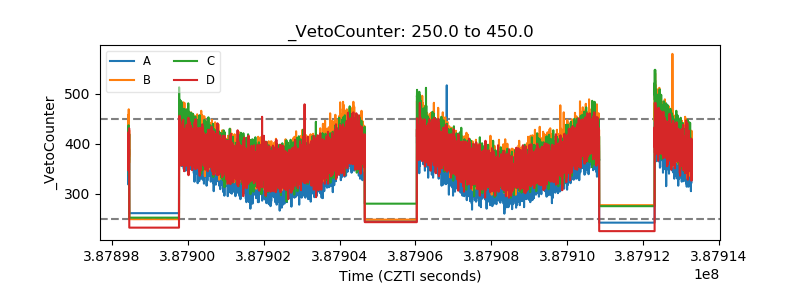 |