| Param | Original file | Final file |
|---|---|---|
| Filename | modeM0/AS1A11_097T07_9000005072_35427cztM0_level2.evt | modeM0/AS1A11_097T07_9000005072_35427cztM0_level2_quad_clean.evt |
| Size (bytes) | 777,401,280 | 78,871,680 |
| Size | 741.4 MB | 75.2 MB |
| Events in quadrant A | 2,904,580 | 567,783 |
| Events in quadrant B | 11,646,083 | 332,667 |
| Events in quadrant C | 3,550,442 | 557,435 |
| Events in quadrant D | 5,041,276 | 513,786 |
| Mode M0 | |||
|---|---|---|---|
| Quadrant | BADHDUFLAG | Total packets | Discarded packets |
| A | 0 | 12399 | 3 |
| B | 0 | 38651 | 10 |
| C | 0 | 14144 | 2 |
| D | 0 | 18784 | 2 |
| Mode M9 | |||
|---|---|---|---|
| Quadrant | BADHDUFLAG | Total packets | Discarded packets |
| A | 0 | 17 | 0 |
| B | 0 | 17 | 0 |
| C | 0 | 17 | 0 |
| D | 0 | 18 | 0 |
| Mode SS | |||
|---|---|---|---|
| Quadrant | BADHDUFLAG | Total packets | Discarded packets |
| A | 0 | 122 | 0 |
| B | 0 | 122 | 0 |
| C | 0 | 122 | 0 |
| D | 0 | 122 | 0 |
| Quadrant | Total seconds | Saturated seconds | Saturation percentage |
|---|---|---|---|
| A | 5932 | 21 | 0.354012% |
| B | 5931 | 3994 | 67.341089% |
| C | 5932 | 107 | 1.803776% |
| D | 5932 | 491 | 8.277141% |
Noise dominated data is calculated using 1-second bins in cleaned event files. If a bin has >2000 counts, and if more than 50% of those come from <1% of pixels, then it is considered to be noise-dominated and hence unusable.
| Quadrant | # 1 sec bins | Bins with >0 counts | Bins with >2000 counts | High rate bins dominated by noise | Noise dominated (total time) | Noise dominated (detector-on time) | Marked lightcurve |
|---|---|---|---|---|---|---|---|
| A | 7245 | 5933 | 8 | 8 | 0.11% | 0.13% | 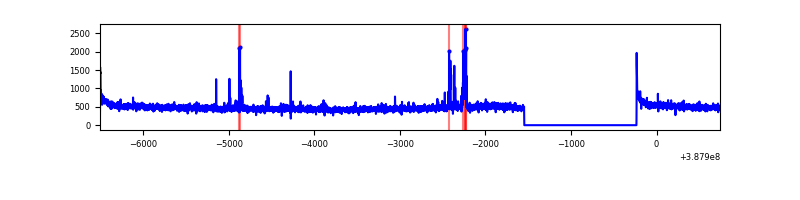 |
| B | 7245 | 5933 | 3324 | 3324 | 45.88% | 56.03% | 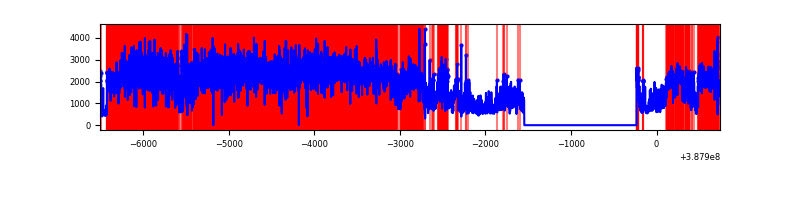 |
| C | 7245 | 5933 | 75 | 75 | 1.04% | 1.26% | 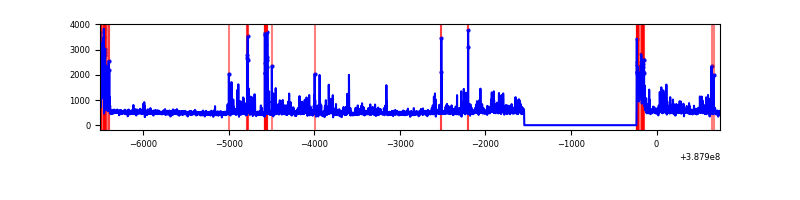 |
| D | 7245 | 5933 | 394 | 394 | 5.44% | 6.64% | 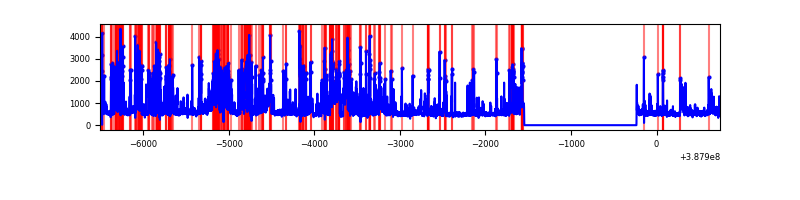 |
Top three noisy pixels from each quadrant. If the there are fewer than three noisy pixels in the level2.evt file, extra rows are filled as -1
| Pixel properties | Quadrant properties | ||||||
|---|---|---|---|---|---|---|---|
| Quadrant | DetID | PixID | Counts | Sigma | Mean | Median | Sigma |
| A | 10 | 83 | 132302 | 932.32 | 692 | 677 | 141.2 |
| A | 9 | 143 | 79224 | 556.36 | 692 | 677 | 141.2 |
| A | 13 | 6 | 12476 | 83.57 | 692 | 677 | 141.2 |
| B | 4 | 251 | 4913426 | 51837.9 | 488 | 474 | 94.8 |
| B | 5 | 14 | 1202039 | 12678.04 | 488 | 474 | 94.8 |
| B | 5 | 31 | 1160610 | 12240.91 | 488 | 474 | 94.8 |
| C | 0 | 207 | 413081 | 2623.09 | 670 | 673 | 157.2 |
| C | 0 | 10 | 277428 | 1760.28 | 670 | 673 | 157.2 |
| C | 15 | 214 | 240130 | 1523.05 | 670 | 673 | 157.2 |
| D | 7 | 80 | 1429397 | 8973.44 | 653 | 634 | 159.2 |
| D | 8 | 195 | 225166 | 1410.19 | 653 | 634 | 159.2 |
| D | 13 | 249 | 206606 | 1293.62 | 653 | 634 | 159.2 |
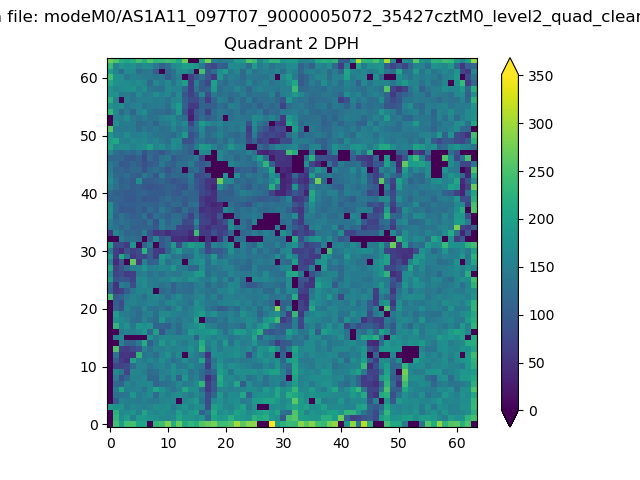
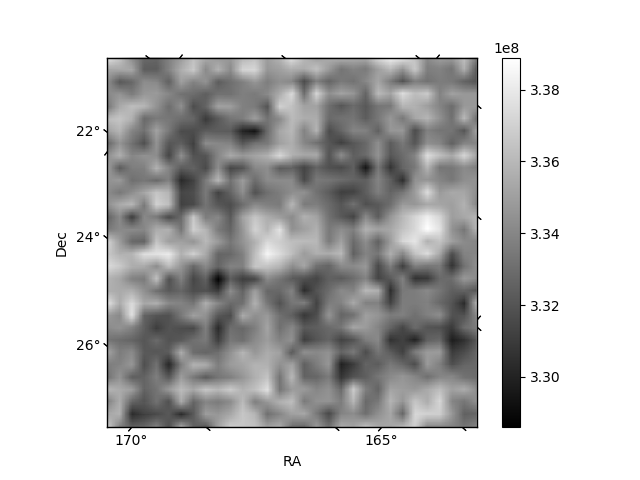
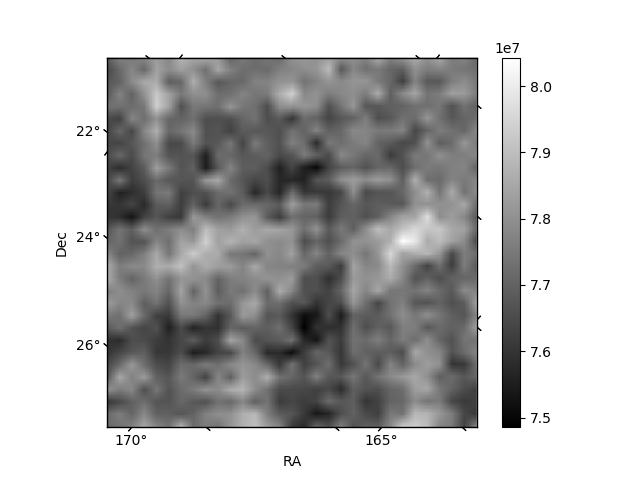
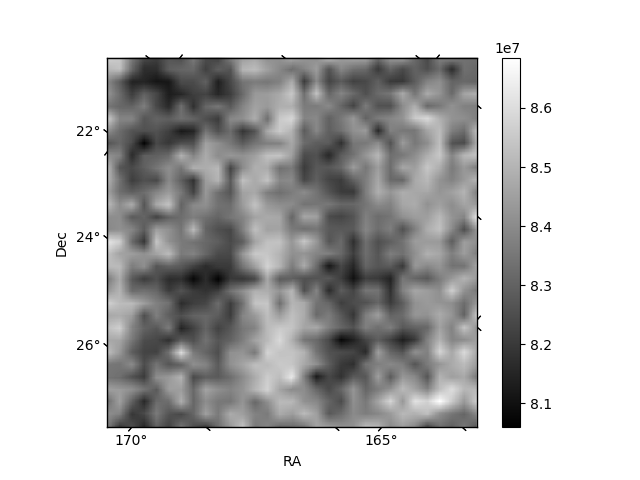
Histogram calculated using DETX and DETY for each event in the final _common_clean file
| Quadrant A | 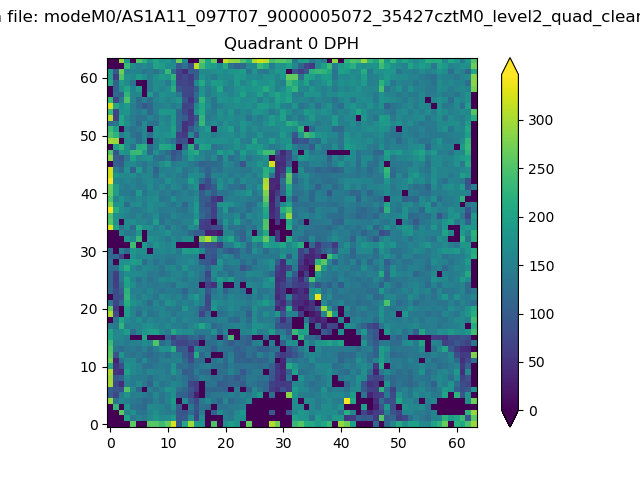 |
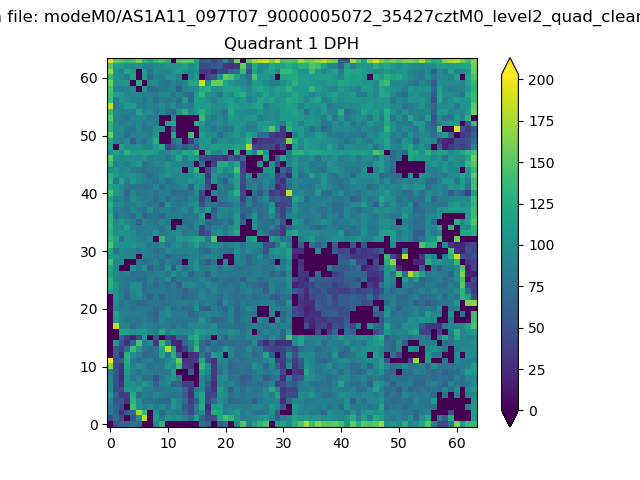 |
Quadrant B |
|---|---|---|---|
| Quadrant D | 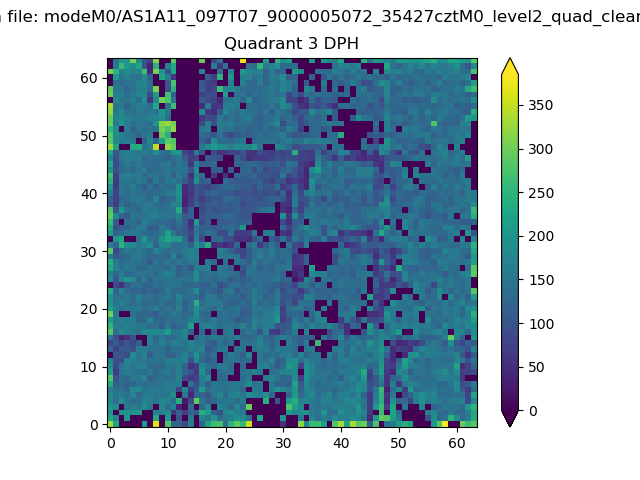 |
 |
Quadrant C |
| Plot type | Count rate plots | Images |
|---|---|---|
| Comparison with Poisson distribution Blue bars denote a histogram of data divided into 1 sec bins. Red curve is a Poisson curve with rate = median count rate of data. |
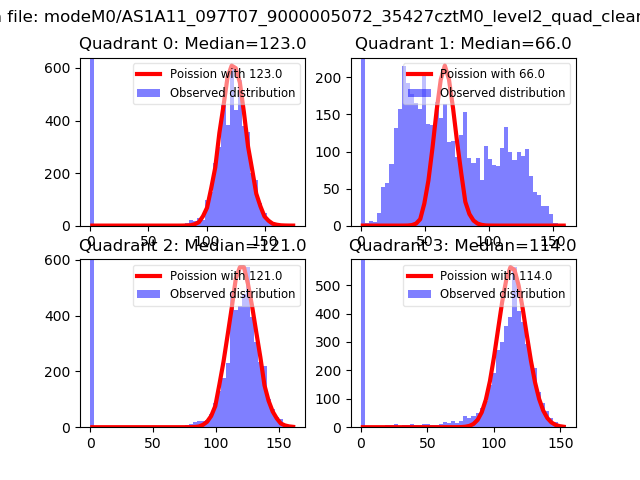 |
 |
| Quadrant-wise count rates Data is divided into 100 sec bins |
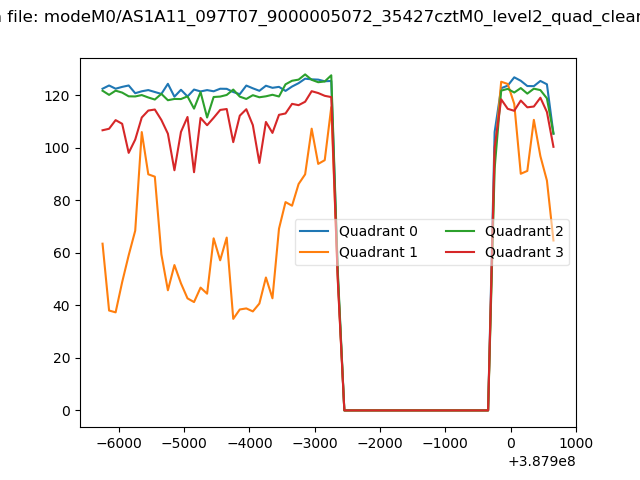 |
|
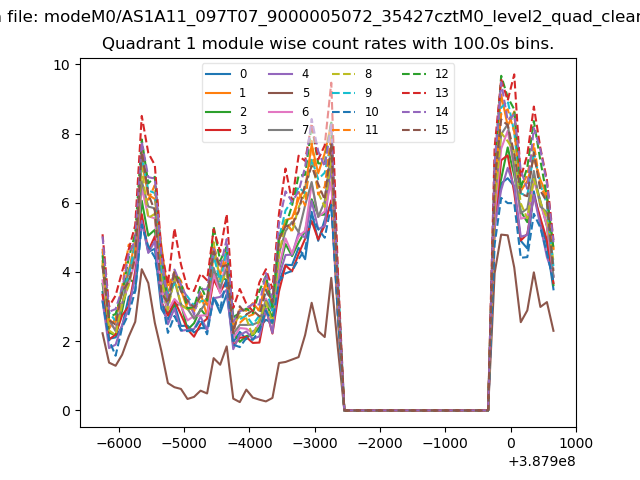
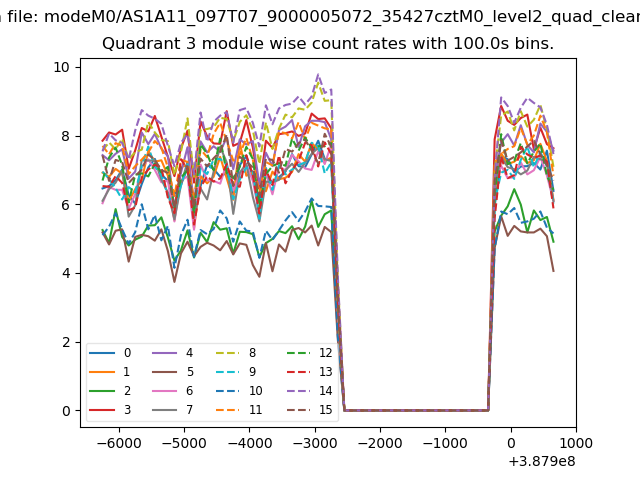
| Module-wise count rates for Quadrant A Data is divided into 100 sec bins |
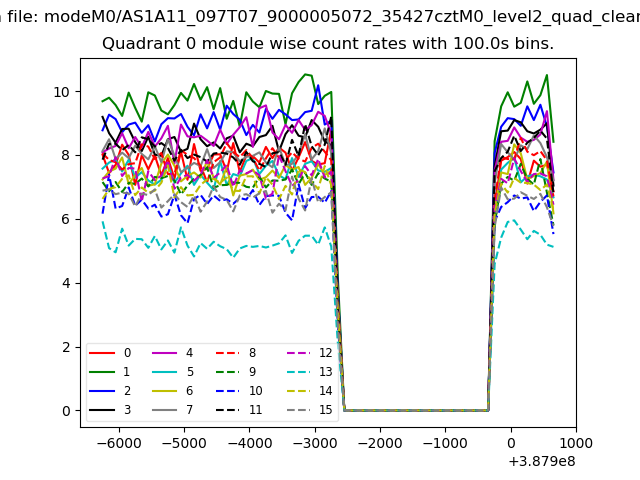 |
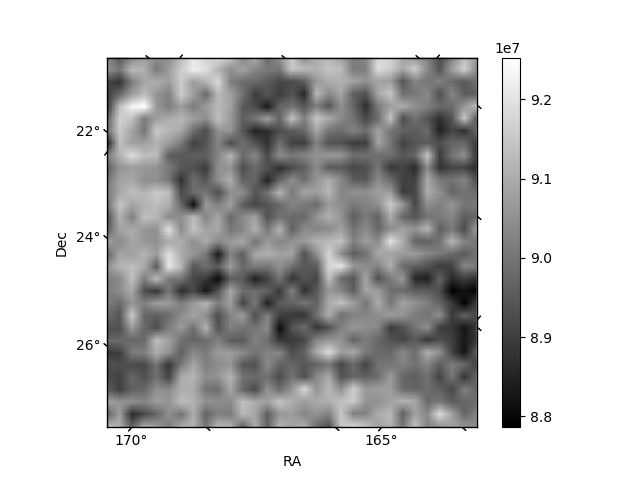 |
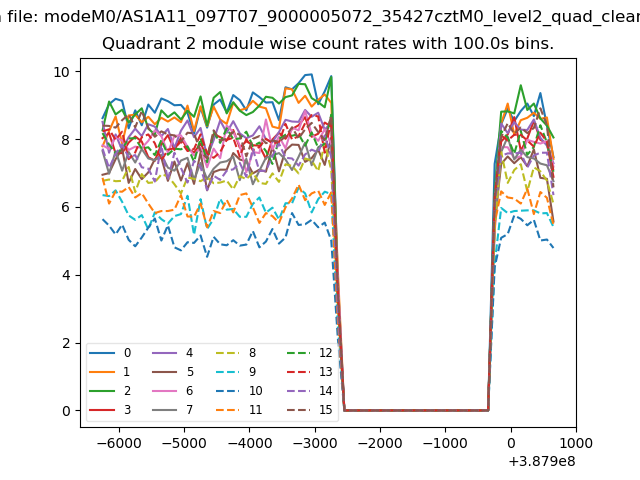
| Module-wise count rates for Quadrant B Data is divided into 100 sec bins |
 |
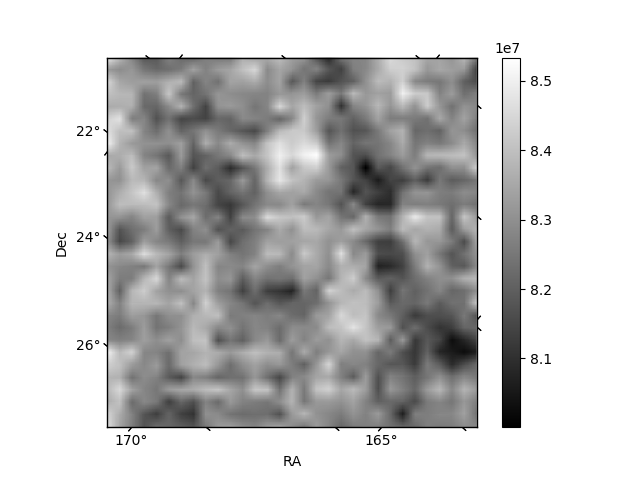 |
| Module-wise count rates for Quadrant C Data is divided into 100 sec bins |
 |
 |
| Module-wise count rates for Quadrant D Data is divided into 100 sec bins |
 |
 |
| Parameter | Plot |
|---|---|
| CZT HV Monitor |  |
| D_VDD | 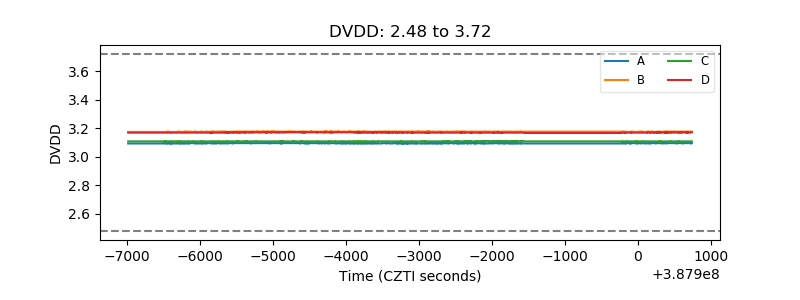 |
| Temperature 1 | 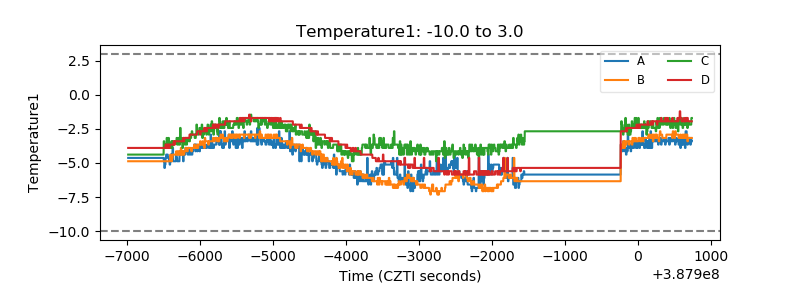 |
| Veto HV Monitor | 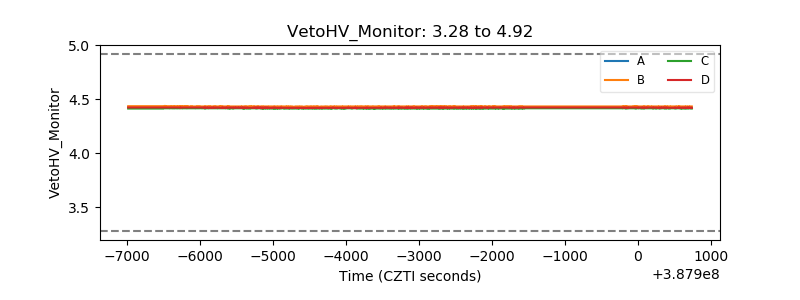 |
| Veto LLD | 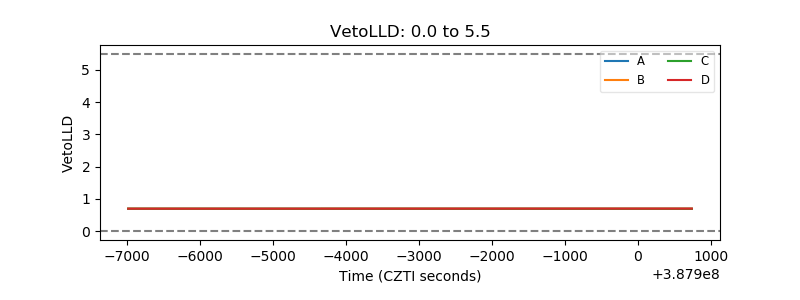 |
| Alpha Counter | 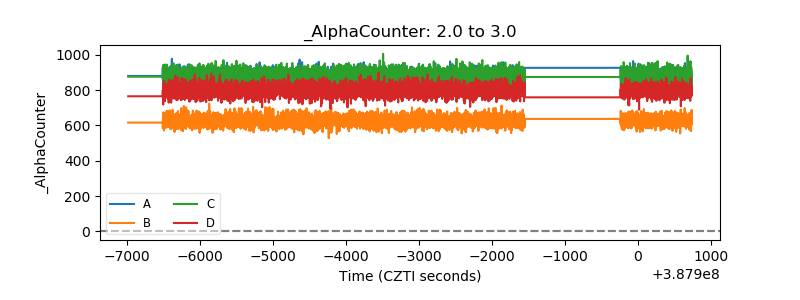 |
| _CPM_Rate | 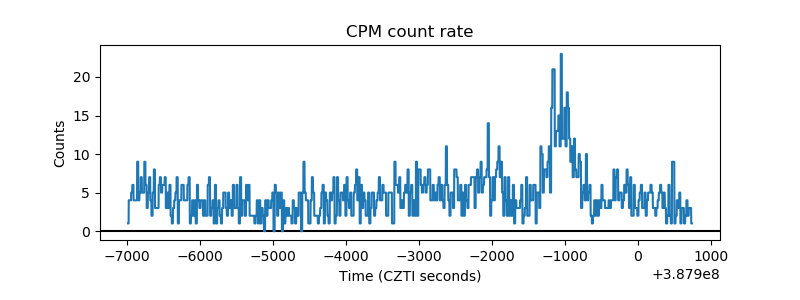 |
| CZT Counter | 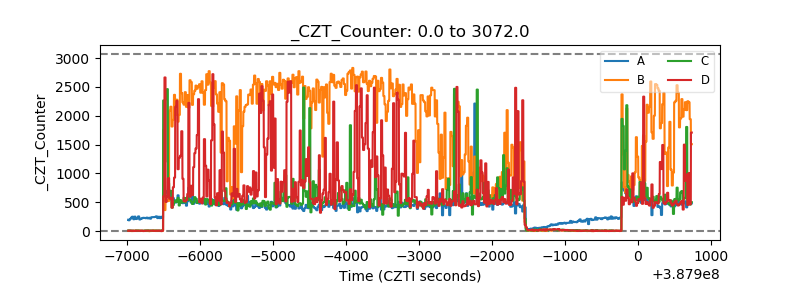 |
| +2.5 Volts monitor | 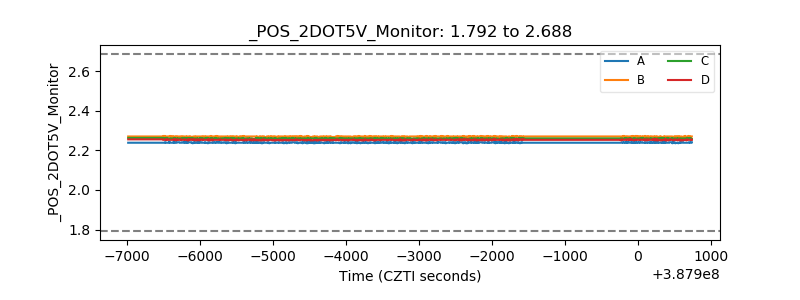 |
| +5 Volts monitor | 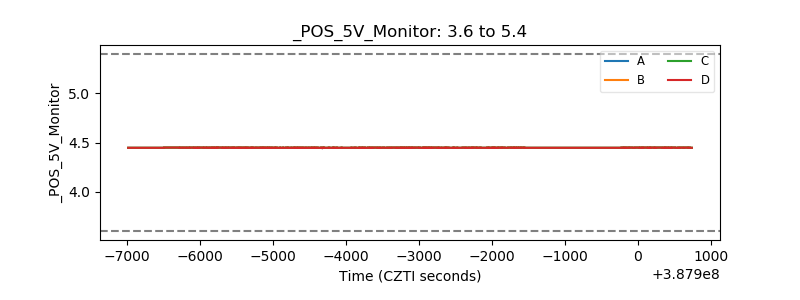 |
| _ROLL_ROT | 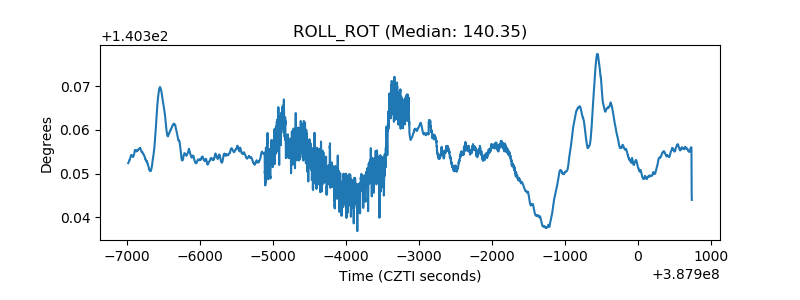 |
| _Roll_DEC | 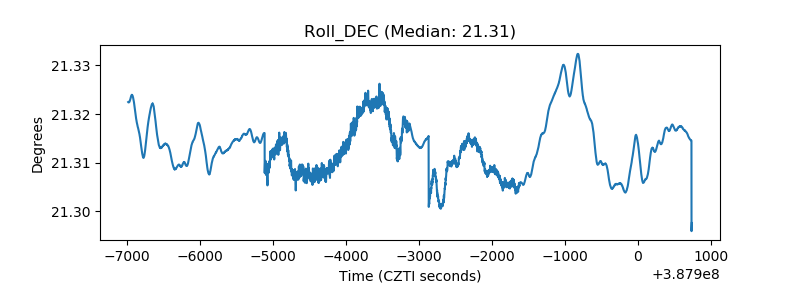 |
| _Roll_RA | 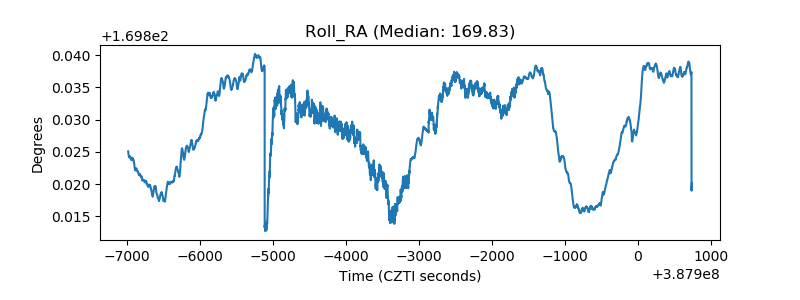 |
| Veto Counter | 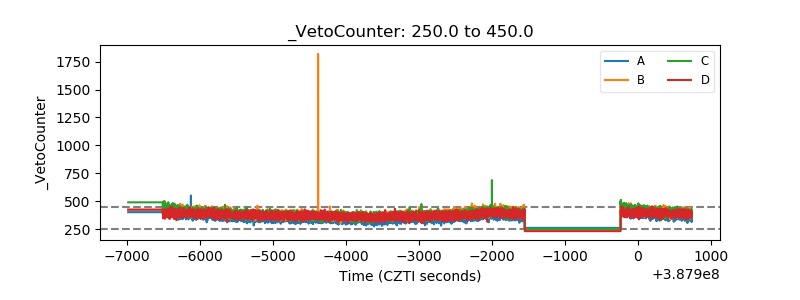 |