| Param | Original file | Final file |
|---|---|---|
| Filename | modeM0/AS1A11_097T07_9000005072_35426cztM0_level2.evt | modeM0/AS1A11_097T07_9000005072_35426cztM0_level2_quad_clean.evt |
| Size (bytes) | 848,983,680 | 82,647,360 |
| Size | 809.7 MB | 78.8 MB |
| Events in quadrant A | 3,002,114 | 592,450 |
| Events in quadrant B | 12,419,150 | 359,910 |
| Events in quadrant C | 3,605,967 | 585,858 |
| Events in quadrant D | 6,258,479 | 522,481 |
| Mode M0 | |||
|---|---|---|---|
| Quadrant | BADHDUFLAG | Total packets | Discarded packets |
| A | 0 | 12896 | 3 |
| B | 0 | 41178 | 2 |
| C | 0 | 14387 | 2 |
| D | 0 | 22736 | 2 |
| Mode M9 | |||
|---|---|---|---|
| Quadrant | BADHDUFLAG | Total packets | Discarded packets |
| A | 0 | 29 | 0 |
| B | 0 | 29 | 0 |
| C | 0 | 29 | 0 |
| D | 0 | 29 | 0 |
| Mode SS | |||
|---|---|---|---|
| Quadrant | BADHDUFLAG | Total packets | Discarded packets |
| A | 0 | 130 | 0 |
| B | 0 | 130 | 0 |
| C | 0 | 130 | 0 |
| D | 0 | 130 | 0 |
| Quadrant | Total seconds | Saturated seconds | Saturation percentage |
|---|---|---|---|
| A | 6306 | 4 | 0.063432% |
| B | 6306 | 4354 | 69.045354% |
| C | 6306 | 95 | 1.506502% |
| D | 6306 | 802 | 12.718046% |
Noise dominated data is calculated using 1-second bins in cleaned event files. If a bin has >2000 counts, and if more than 50% of those come from <1% of pixels, then it is considered to be noise-dominated and hence unusable.
| Quadrant | # 1 sec bins | Bins with >0 counts | Bins with >2000 counts | High rate bins dominated by noise | Noise dominated (total time) | Noise dominated (detector-on time) | Marked lightcurve |
|---|---|---|---|---|---|---|---|
| A | 9204 | 6308 | 1 | 1 | 0.01% | 0.02% | 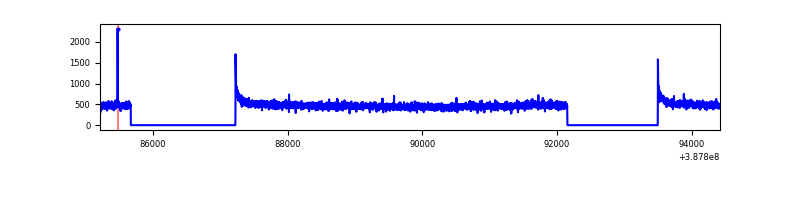 |
| B | 9204 | 6308 | 3568 | 3568 | 38.77% | 56.56% | 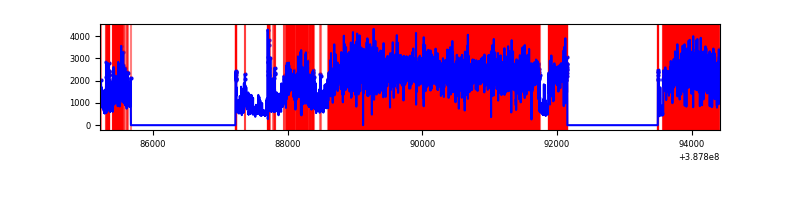 |
| C | 9204 | 6308 | 64 | 64 | 0.70% | 1.01% |  |
| D | 9204 | 6308 | 700 | 700 | 7.61% | 11.10% | 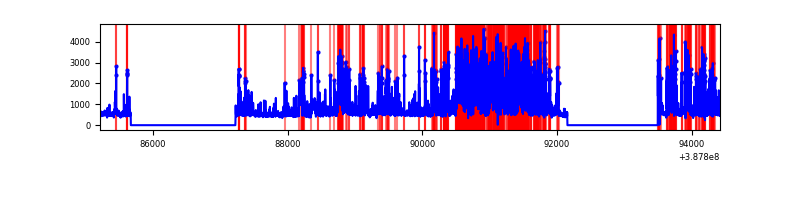 |
Top three noisy pixels from each quadrant. If the there are fewer than three noisy pixels in the level2.evt file, extra rows are filled as -1
| Pixel properties | Quadrant properties | ||||||
|---|---|---|---|---|---|---|---|
| Quadrant | DetID | PixID | Counts | Sigma | Mean | Median | Sigma |
| A | 10 | 83 | 136018 | 909.14 | 737 | 722 | 148.8 |
| A | 13 | 254 | 10494 | 65.66 | 737 | 722 | 148.8 |
| A | 13 | 6 | 8278 | 50.77 | 737 | 722 | 148.8 |
| B | 4 | 251 | 6497497 | 64498.22 | 516 | 503 | 100.7 |
| B | 5 | 236 | 1048237 | 10401.27 | 516 | 503 | 100.7 |
| B | 5 | 31 | 869143 | 8623.33 | 516 | 503 | 100.7 |
| C | 0 | 10 | 304542 | 1819.37 | 715 | 719 | 167.0 |
| C | 15 | 214 | 256102 | 1529.29 | 715 | 719 | 167.0 |
| C | 0 | 207 | 250176 | 1493.81 | 715 | 719 | 167.0 |
| D | 7 | 80 | 1141379 | 6724.11 | 688 | 668 | 169.6 |
| D | 12 | 233 | 933703 | 5499.93 | 688 | 668 | 169.6 |
| D | 1 | 52 | 689608 | 4061.07 | 688 | 668 | 169.6 |
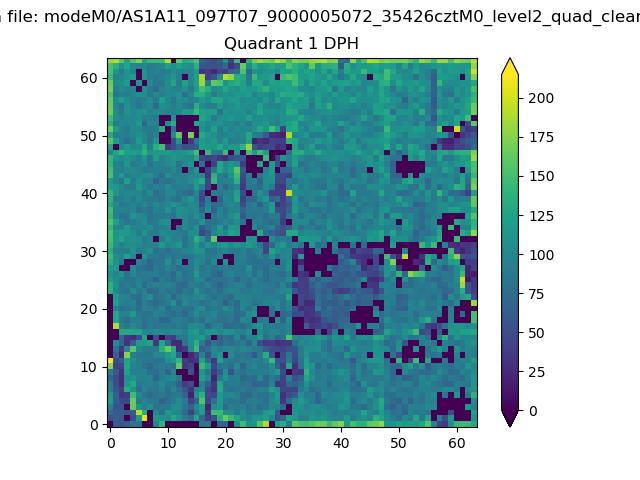
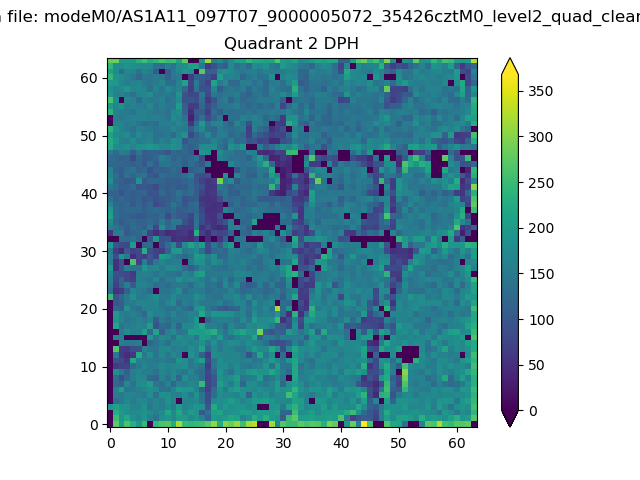
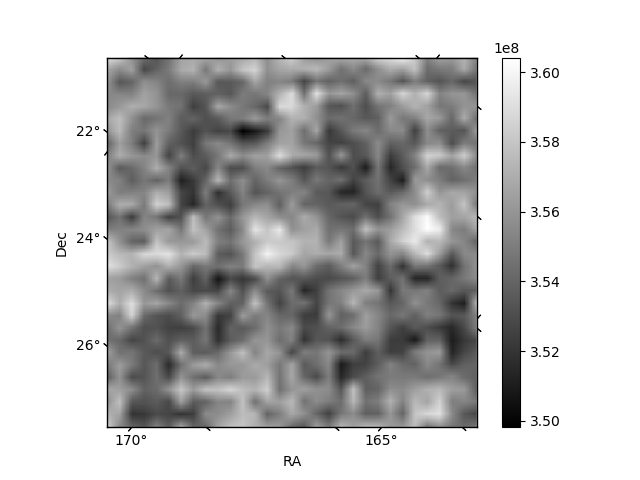
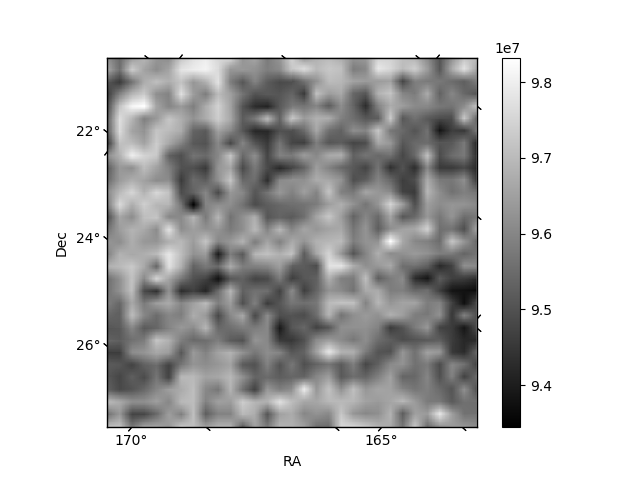
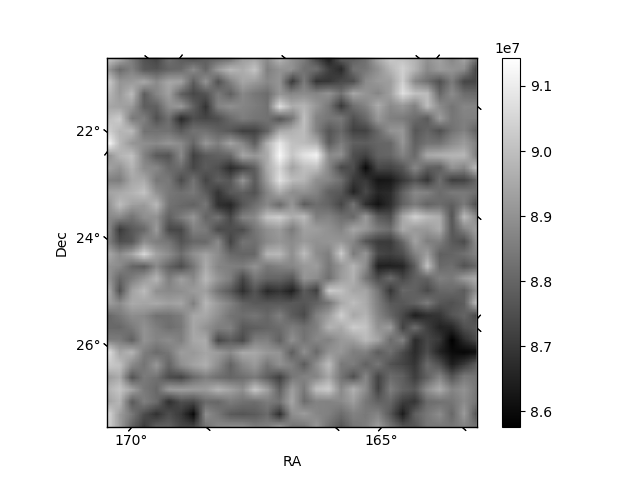
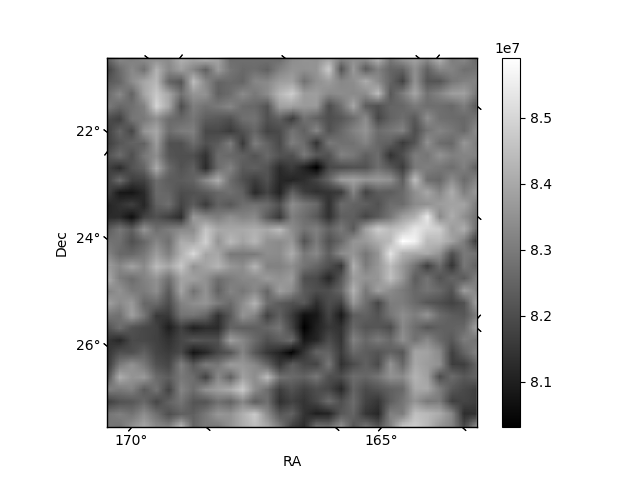
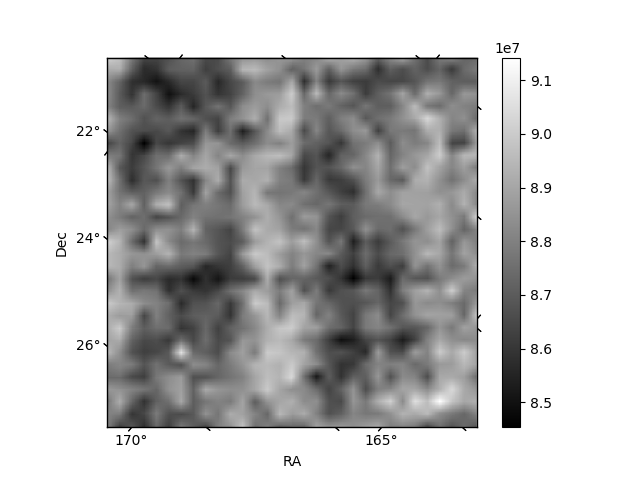
Histogram calculated using DETX and DETY for each event in the final _common_clean file
| Quadrant A | 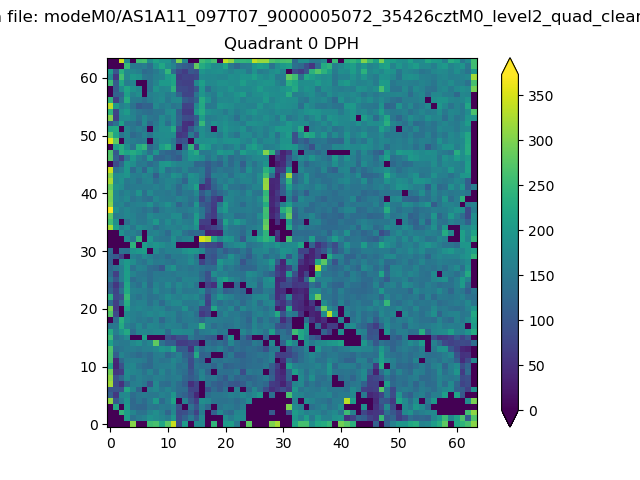 |
 |
Quadrant B |
|---|---|---|---|
| Quadrant D | 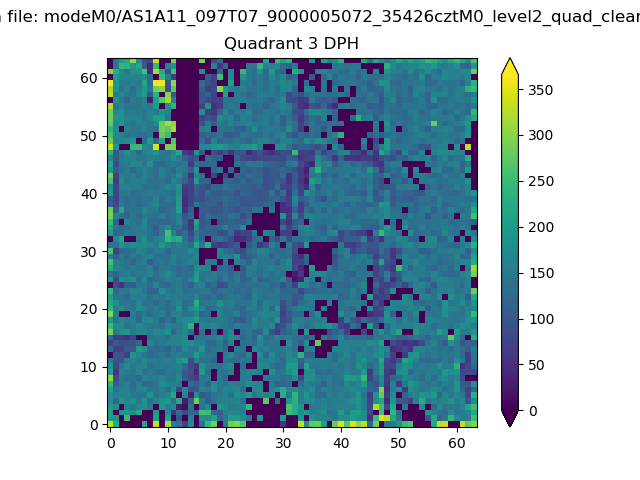 |
 |
Quadrant C |
| Plot type | Count rate plots | Images |
|---|---|---|
| Comparison with Poisson distribution Blue bars denote a histogram of data divided into 1 sec bins. Red curve is a Poisson curve with rate = median count rate of data. |
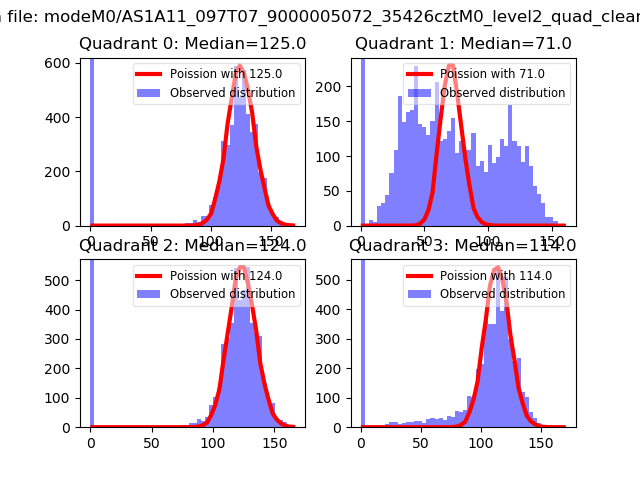 |
 |
| Quadrant-wise count rates Data is divided into 100 sec bins |
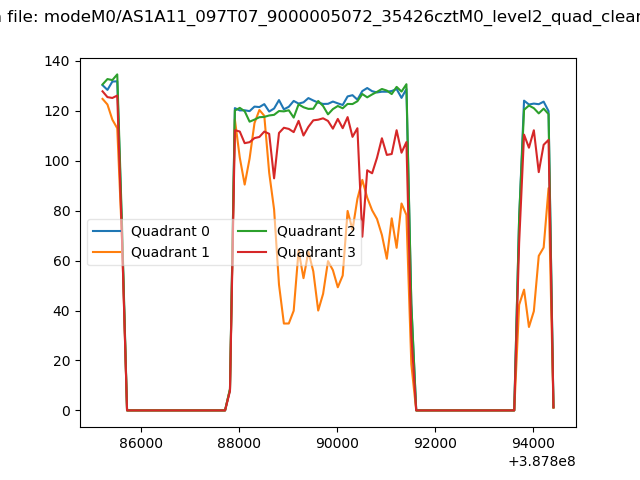 |
|
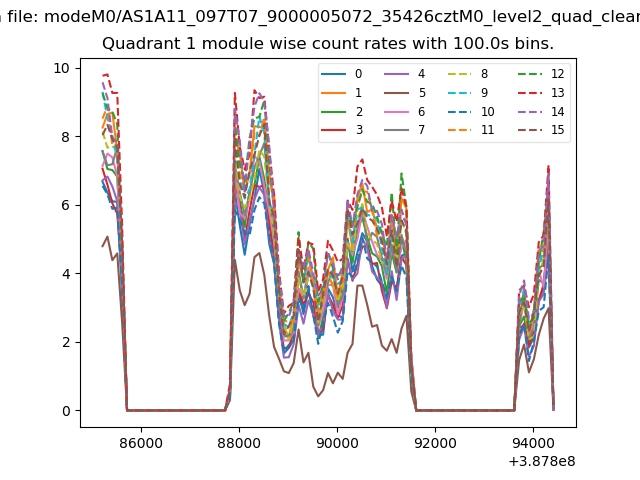
| Module-wise count rates for Quadrant A Data is divided into 100 sec bins |
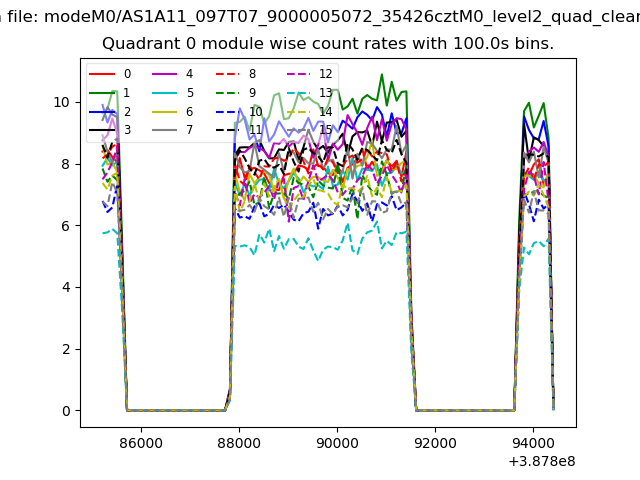 |
 |
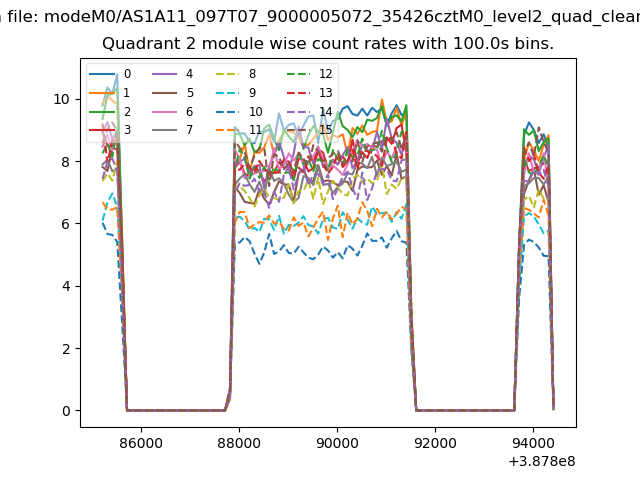
| Module-wise count rates for Quadrant B Data is divided into 100 sec bins |
 |
 |
| Module-wise count rates for Quadrant C Data is divided into 100 sec bins |
 |
 |
| Module-wise count rates for Quadrant D Data is divided into 100 sec bins |
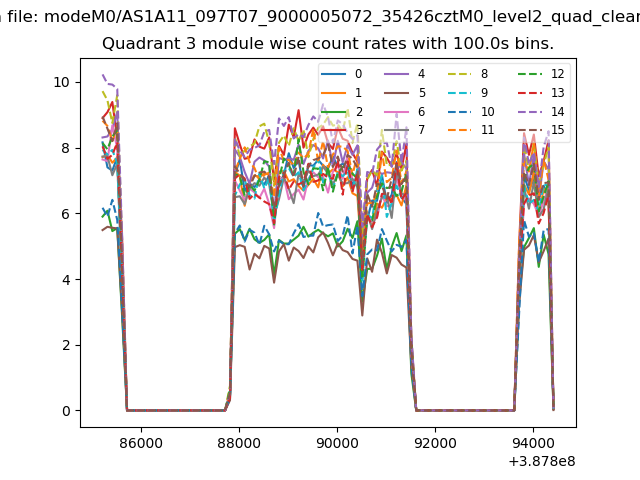 |
 |
| Parameter | Plot |
|---|---|
| CZT HV Monitor | 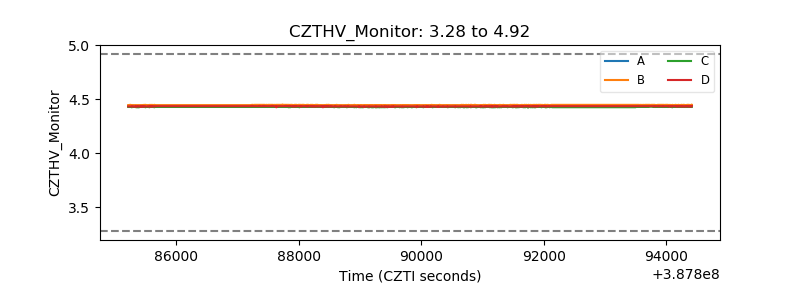 |
| D_VDD | 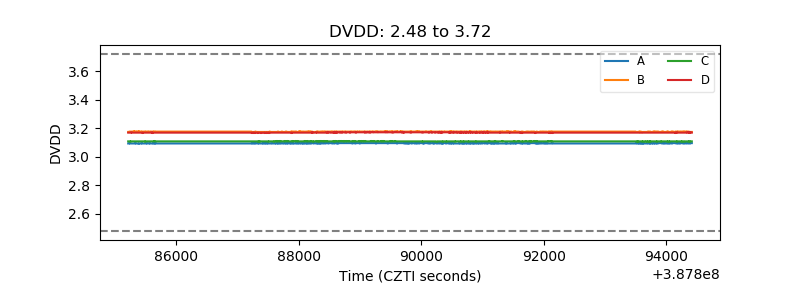 |
| Temperature 1 | 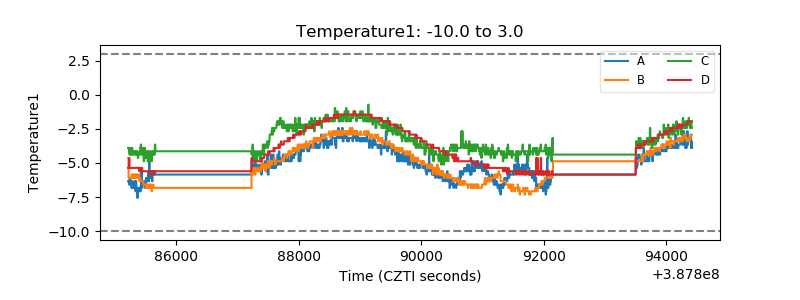 |
| Veto HV Monitor | 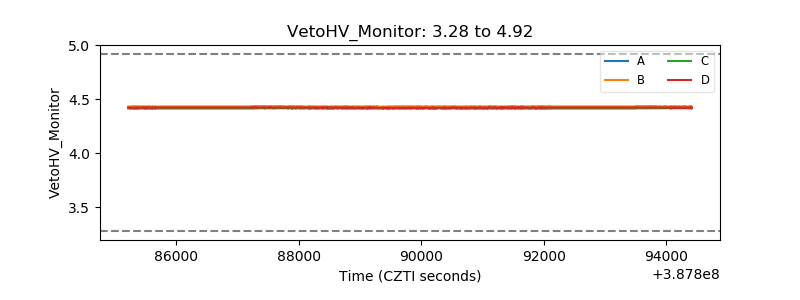 |
| Veto LLD | 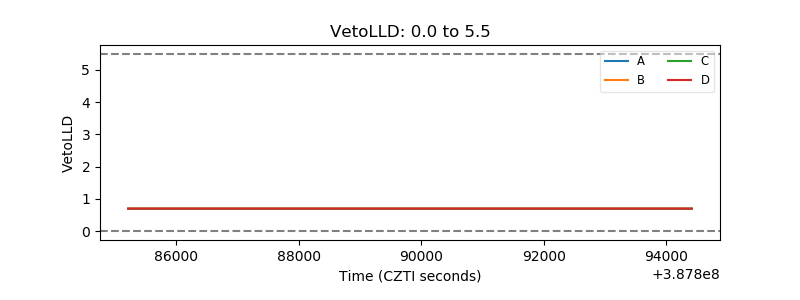 |
| Alpha Counter | 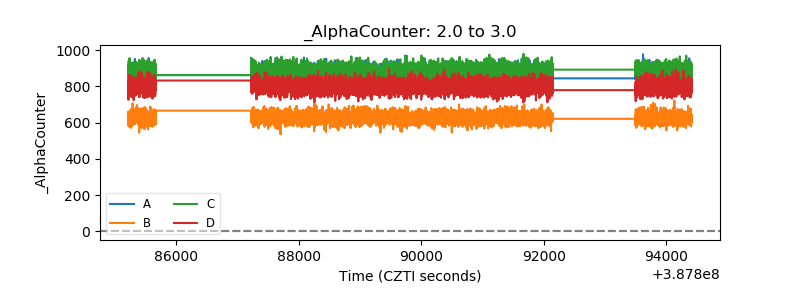 |
| _CPM_Rate | 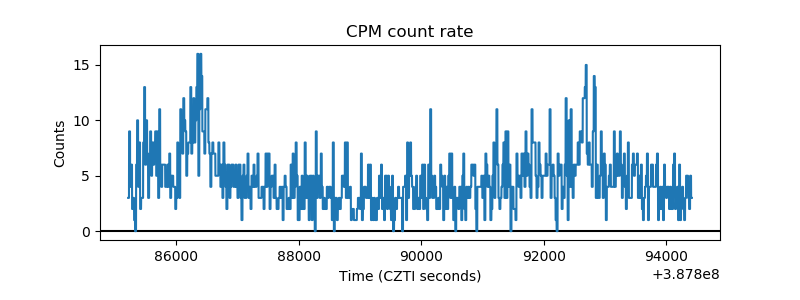 |
| CZT Counter | 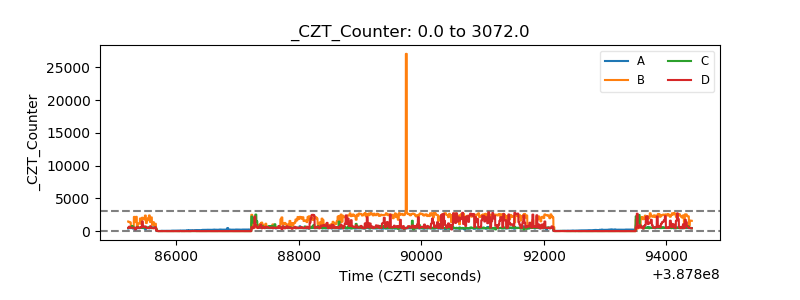 |
| +2.5 Volts monitor | 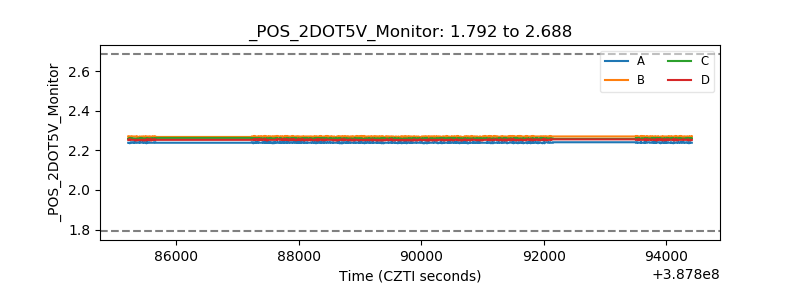 |
| +5 Volts monitor | 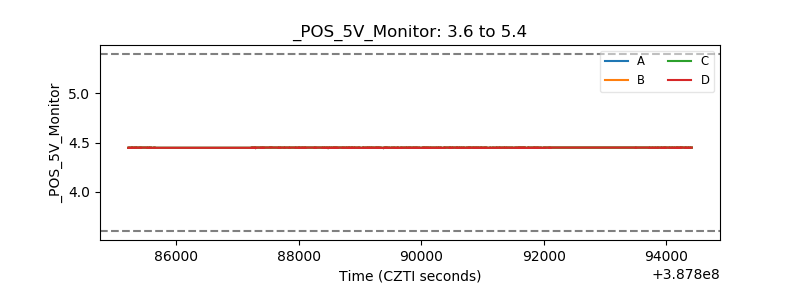 |
| _ROLL_ROT | 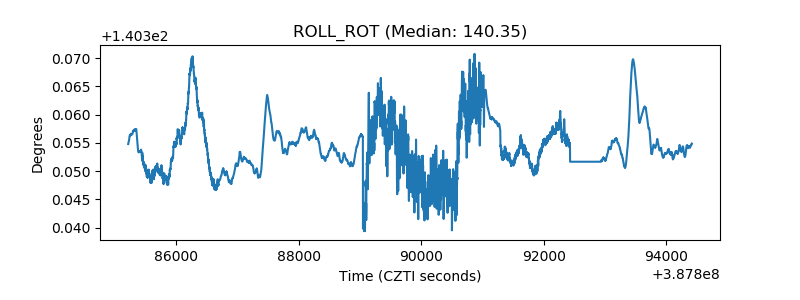 |
| _Roll_DEC | 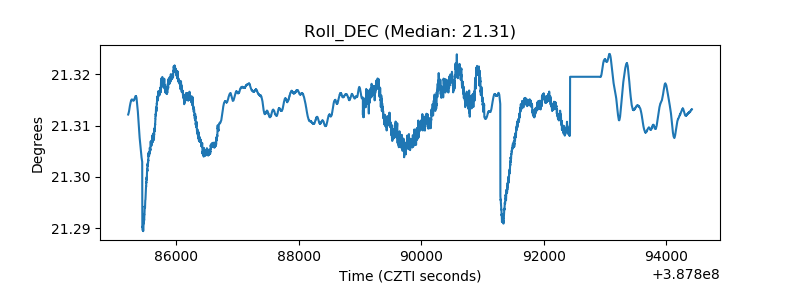 |
| _Roll_RA | 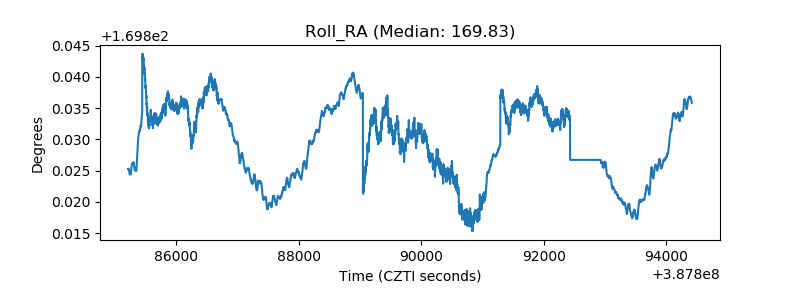 |
| Veto Counter | 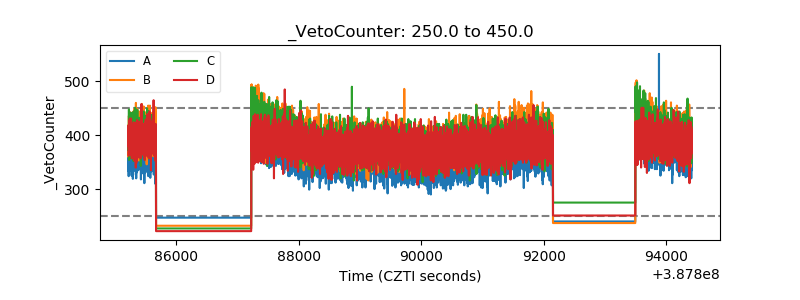 |