| Param | Original file | Final file |
|---|---|---|
| Filename | modeM0/AS1A11_097T07_9000005072_35424cztM0_level2.evt | modeM0/AS1A11_097T07_9000005072_35424cztM0_level2_quad_clean.evt |
| Size (bytes) | 691,879,680 | 60,517,440 |
| Size | 659.8 MB | 57.7 MB |
| Events in quadrant A | 2,707,742 | 417,804 |
| Events in quadrant B | 10,745,900 | 226,934 |
| Events in quadrant C | 3,467,723 | 409,422 |
| Events in quadrant D | 3,657,347 | 389,174 |
| Mode M0 | |||
|---|---|---|---|
| Quadrant | BADHDUFLAG | Total packets | Discarded packets |
| A | 0 | 11350 | 3 |
| B | 0 | 35711 | 2 |
| C | 0 | 13526 | 2 |
| D | 0 | 14478 | 2 |
| Mode M9 | |||
|---|---|---|---|
| Quadrant | BADHDUFLAG | Total packets | Discarded packets |
| A | 0 | 40 | 0 |
| B | 0 | 40 | 0 |
| C | 0 | 40 | 0 |
| D | 0 | 40 | 0 |
| Mode SS | |||
|---|---|---|---|
| Quadrant | BADHDUFLAG | Total packets | Discarded packets |
| A | 0 | 114 | 0 |
| B | 0 | 114 | 0 |
| C | 0 | 114 | 0 |
| D | 0 | 114 | 0 |
| Quadrant | Total seconds | Saturated seconds | Saturation percentage |
|---|---|---|---|
| A | 5541 | 6 | 0.108284% |
| B | 5541 | 3446 | 62.190940% |
| C | 5541 | 147 | 2.652951% |
| D | 5541 | 115 | 2.075438% |
Noise dominated data is calculated using 1-second bins in cleaned event files. If a bin has >2000 counts, and if more than 50% of those come from <1% of pixels, then it is considered to be noise-dominated and hence unusable.
| Quadrant | # 1 sec bins | Bins with >0 counts | Bins with >2000 counts | High rate bins dominated by noise | Noise dominated (total time) | Noise dominated (detector-on time) | Marked lightcurve |
|---|---|---|---|---|---|---|---|
| A | 9516 | 5543 | 0 | 0 | 0.00% | 0.00% | 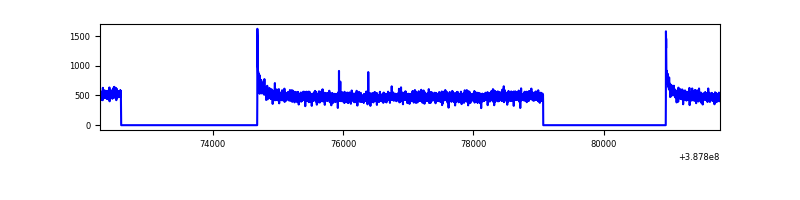 |
| B | 9516 | 5543 | 2933 | 2933 | 30.82% | 52.91% | 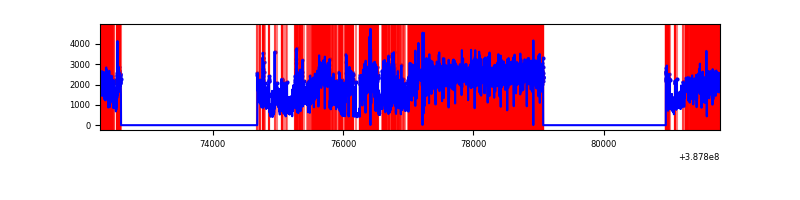 |
| C | 9516 | 5543 | 122 | 122 | 1.28% | 2.20% | 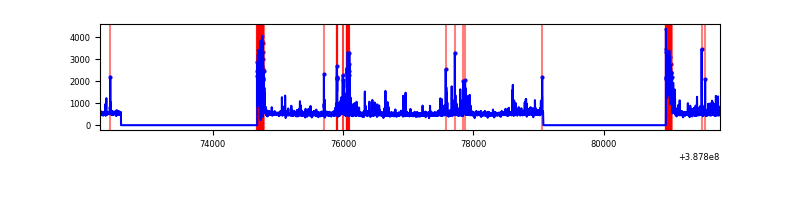 |
| D | 9516 | 5543 | 85 | 85 | 0.89% | 1.53% | 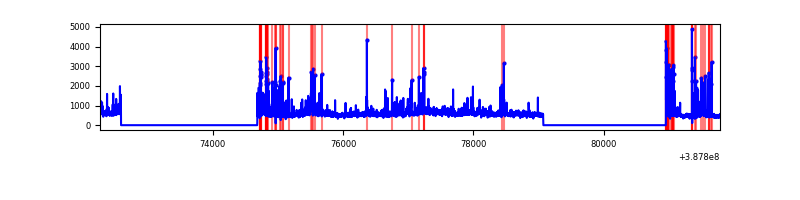 |
Top three noisy pixels from each quadrant. If the there are fewer than three noisy pixels in the level2.evt file, extra rows are filled as -1
| Pixel properties | Quadrant properties | ||||||
|---|---|---|---|---|---|---|---|
| Quadrant | DetID | PixID | Counts | Sigma | Mean | Median | Sigma |
| A | 10 | 83 | 131876 | 984.22 | 663 | 649 | 133.3 |
| A | 13 | 6 | 11743 | 83.21 | 663 | 649 | 133.3 |
| A | 13 | 254 | 8334 | 57.64 | 663 | 649 | 133.3 |
| B | 4 | 251 | 4617964 | 50663.34 | 471 | 459 | 91.1 |
| B | 5 | 14 | 1037199 | 11375.13 | 471 | 459 | 91.1 |
| B | 5 | 31 | 1027520 | 11268.93 | 471 | 459 | 91.1 |
| C | 0 | 10 | 363279 | 2426.2 | 636 | 638 | 149.5 |
| C | 0 | 207 | 340055 | 2270.82 | 636 | 638 | 149.5 |
| C | 15 | 214 | 226957 | 1514.15 | 636 | 638 | 149.5 |
| D | 7 | 80 | 328614 | 2094.48 | 637 | 619 | 156.6 |
| D | 8 | 195 | 286901 | 1828.12 | 637 | 619 | 156.6 |
| D | 2 | 250 | 225095 | 1433.44 | 637 | 619 | 156.6 |
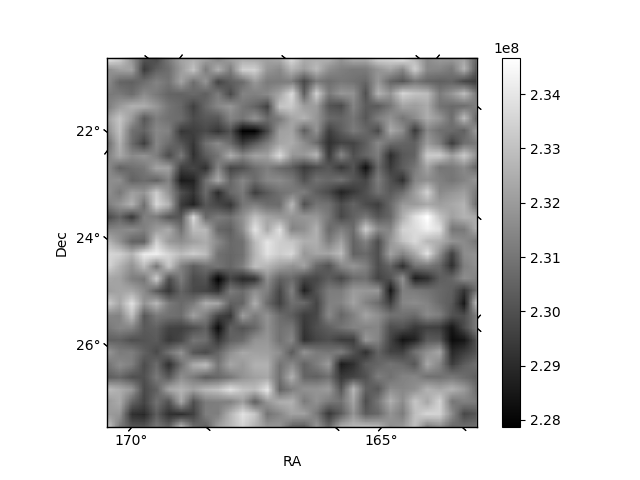
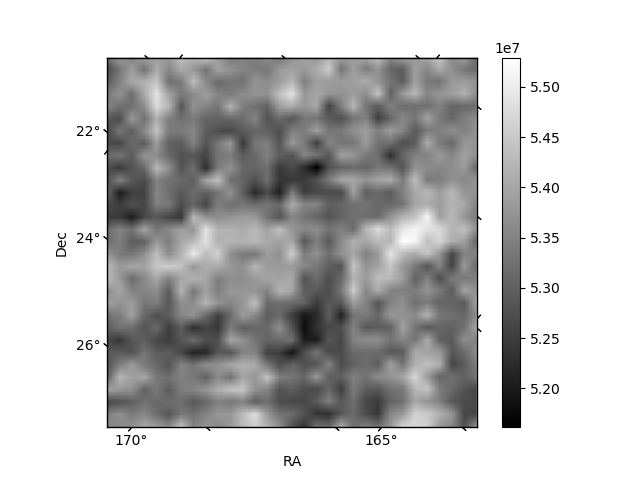
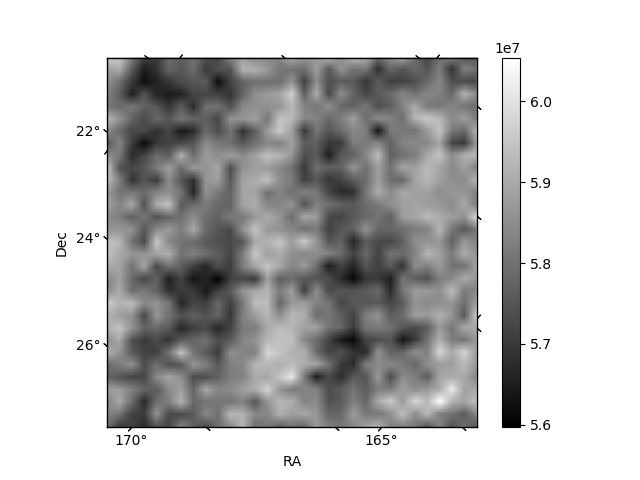
Histogram calculated using DETX and DETY for each event in the final _common_clean file
| Quadrant A | 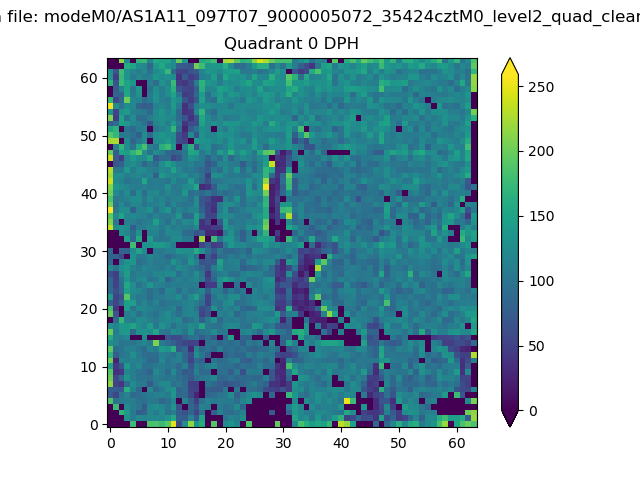 |
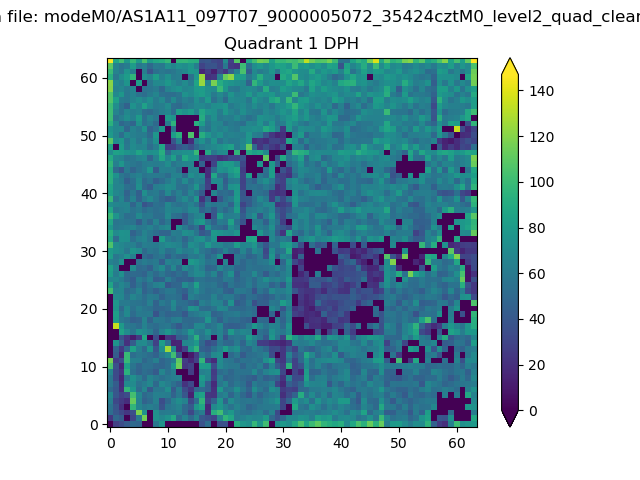 |
Quadrant B |
|---|---|---|---|
| Quadrant D | 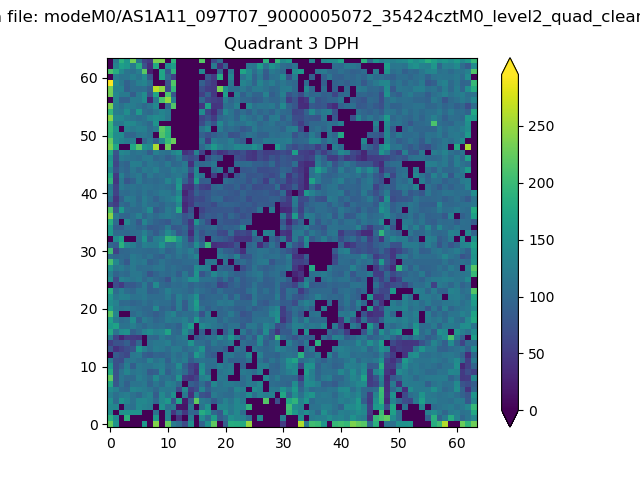 |
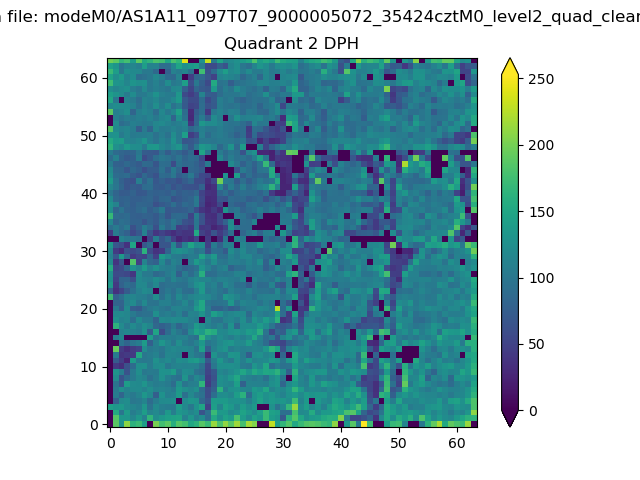 |
Quadrant C |
| Plot type | Count rate plots | Images |
|---|---|---|
| Comparison with Poisson distribution Blue bars denote a histogram of data divided into 1 sec bins. Red curve is a Poisson curve with rate = median count rate of data. |
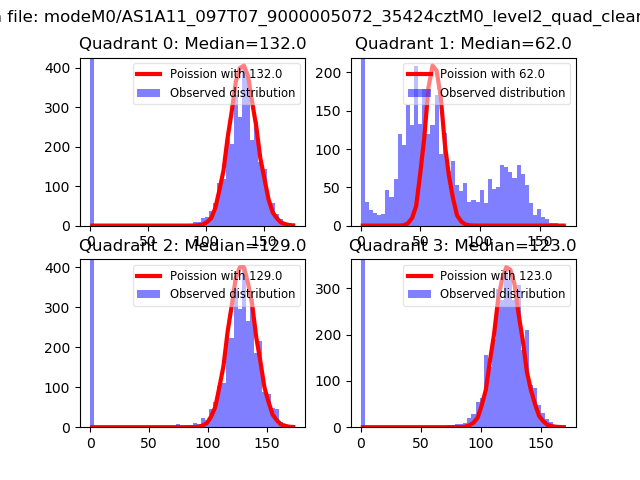 |
 |
| Quadrant-wise count rates Data is divided into 100 sec bins |
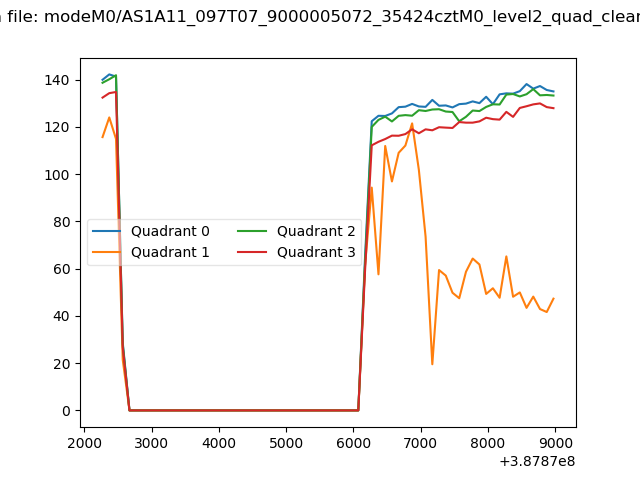 |
|
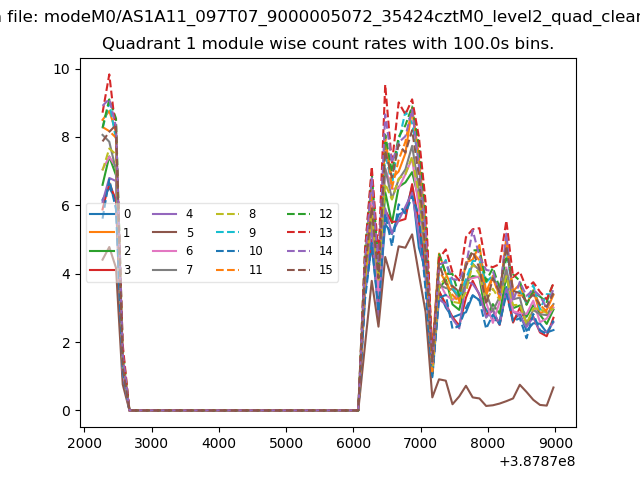
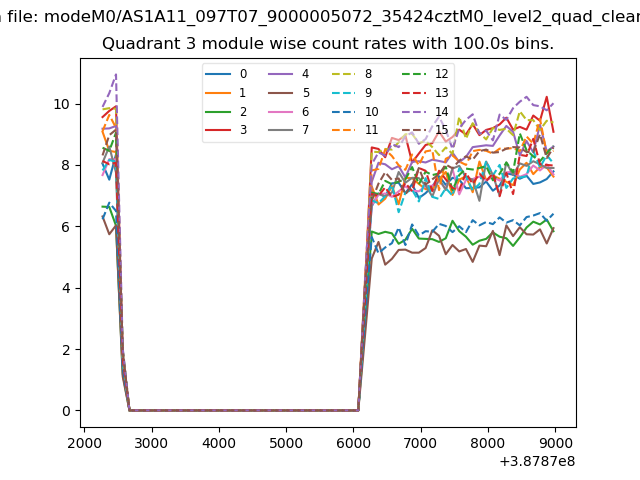
| Module-wise count rates for Quadrant A Data is divided into 100 sec bins |
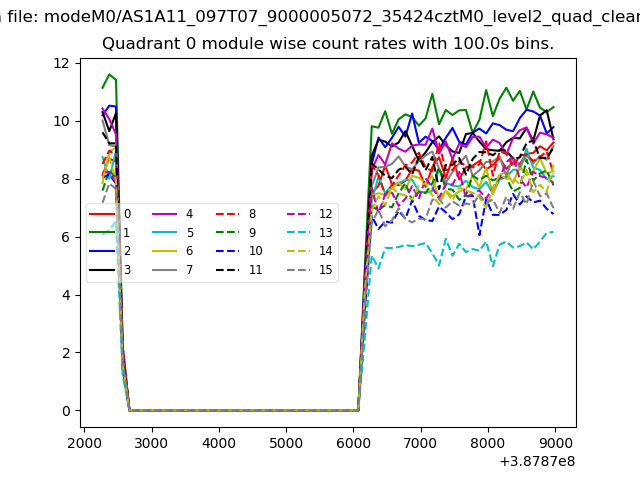 |
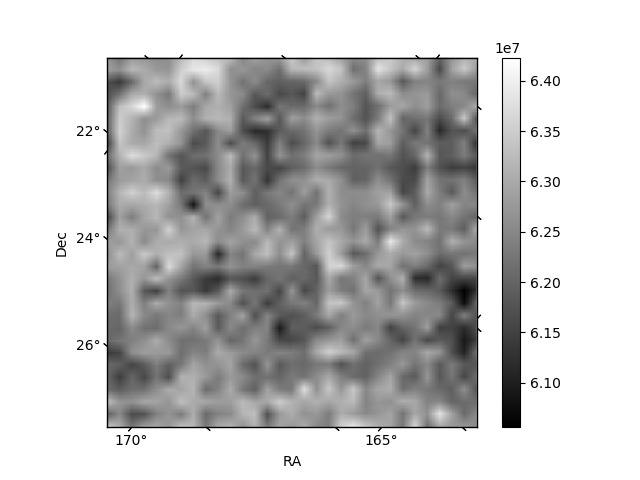 |
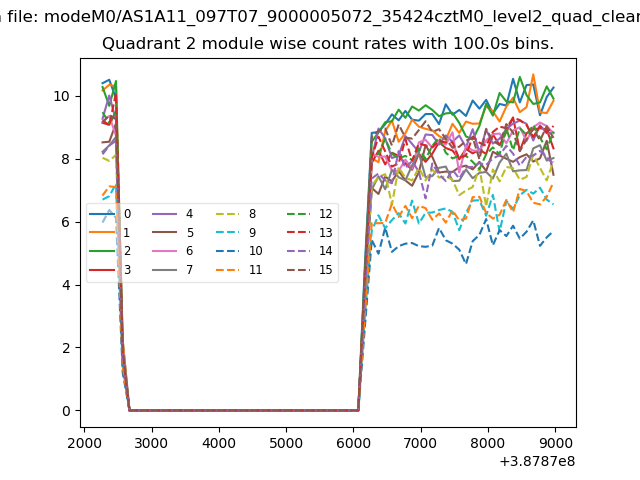
| Module-wise count rates for Quadrant B Data is divided into 100 sec bins |
 |
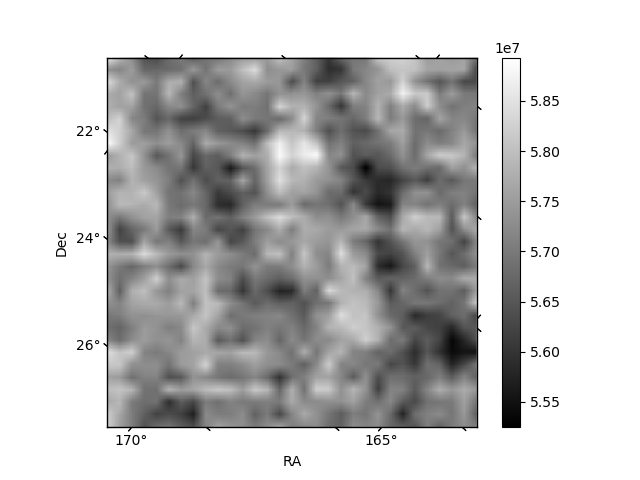 |
| Module-wise count rates for Quadrant C Data is divided into 100 sec bins |
 |
 |
| Module-wise count rates for Quadrant D Data is divided into 100 sec bins |
 |
 |
| Parameter | Plot |
|---|---|
| CZT HV Monitor | 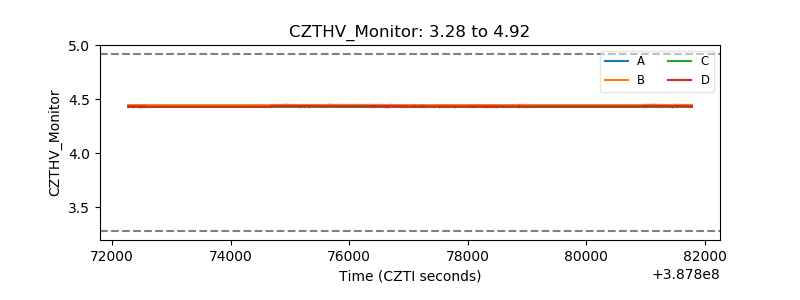 |
| D_VDD | 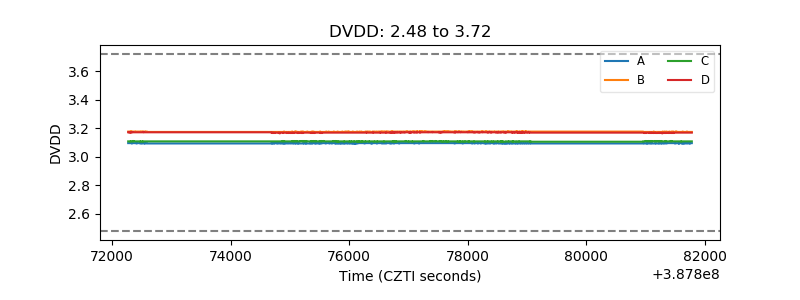 |
| Temperature 1 | 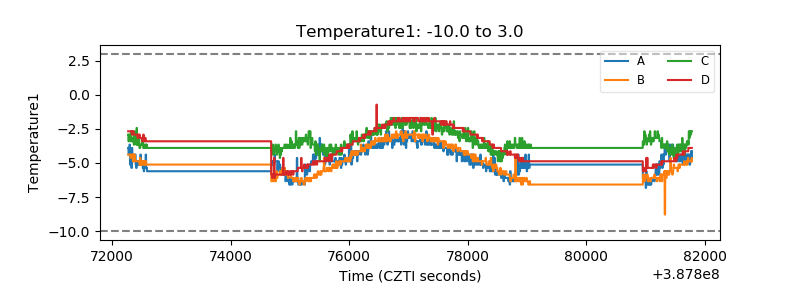 |
| Veto HV Monitor | 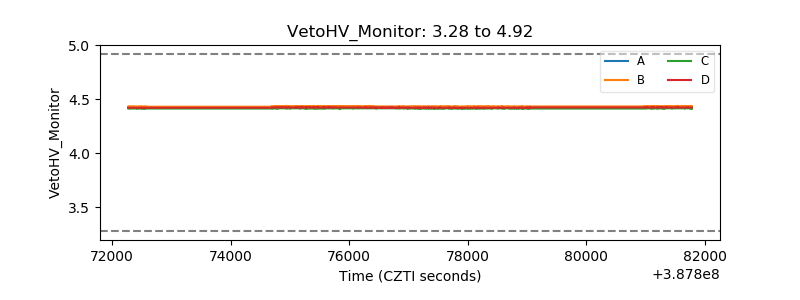 |
| Veto LLD | 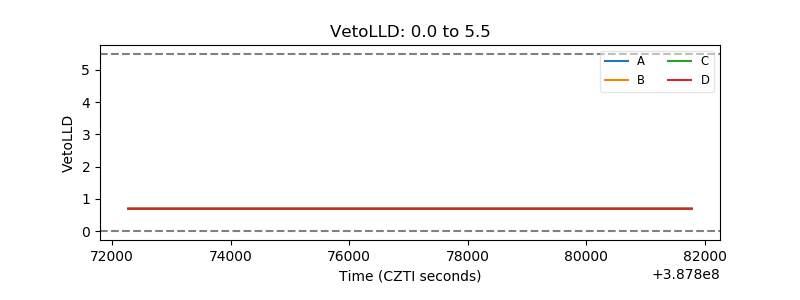 |
| Alpha Counter | 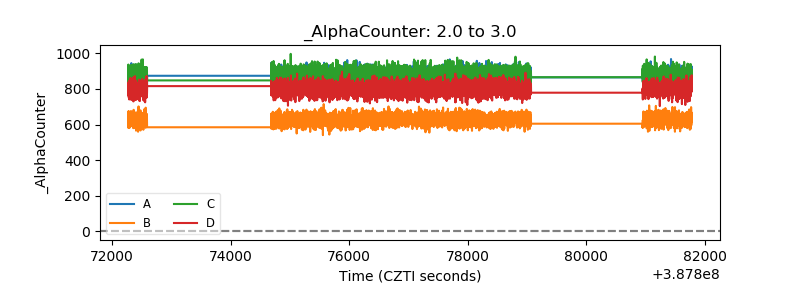 |
| _CPM_Rate | 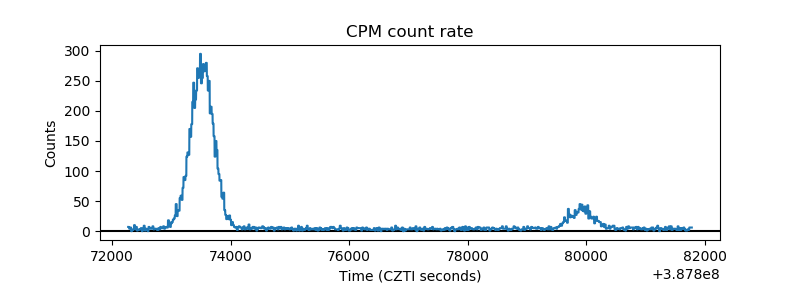 |
| CZT Counter | 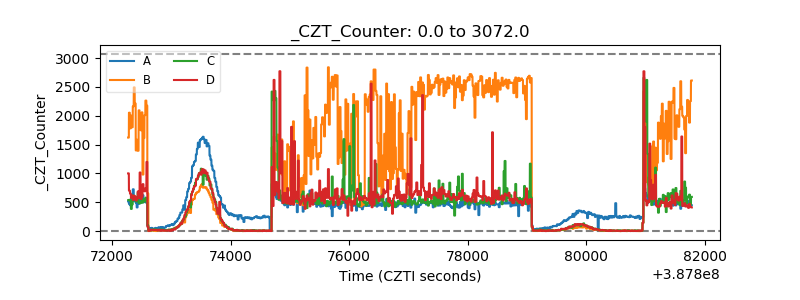 |
| +2.5 Volts monitor | 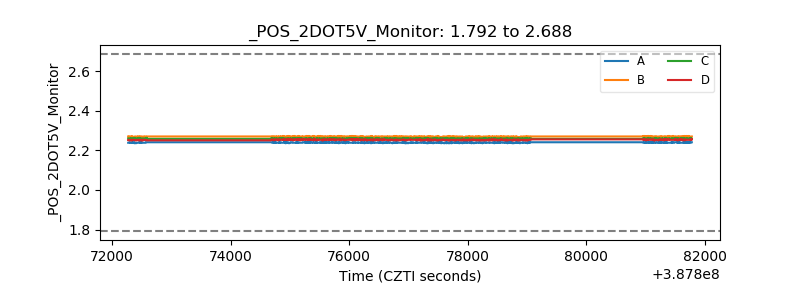 |
| +5 Volts monitor | 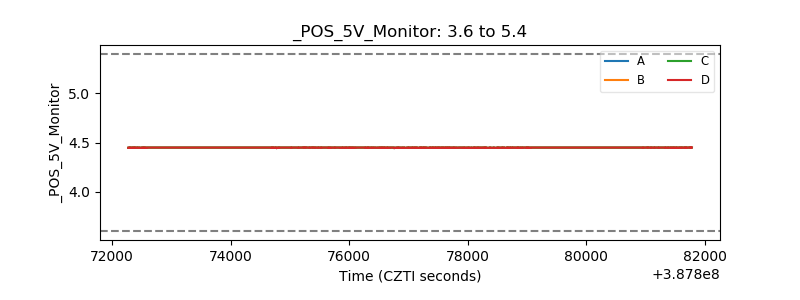 |
| _ROLL_ROT | 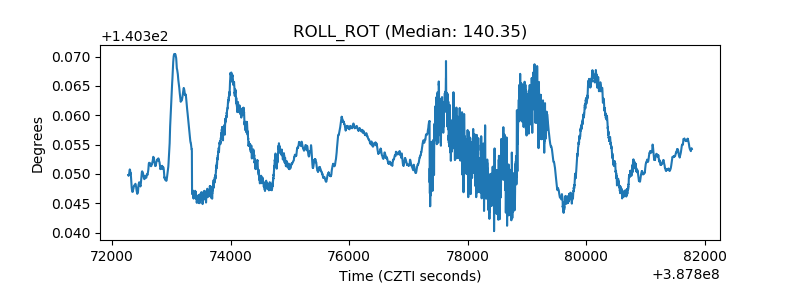 |
| _Roll_DEC | 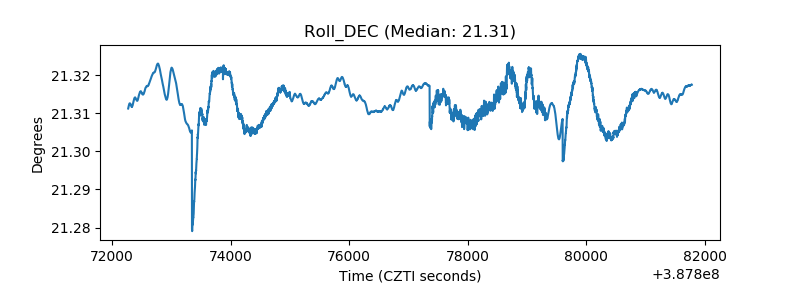 |
| _Roll_RA | 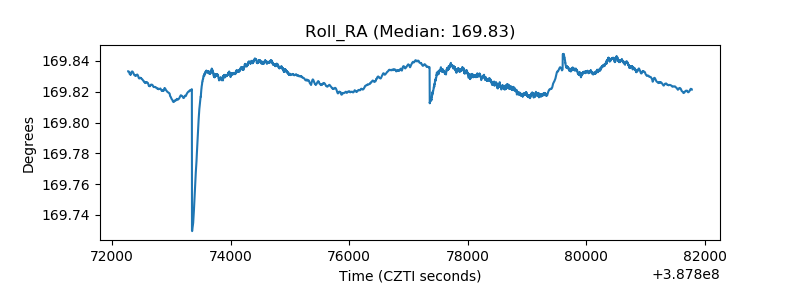 |
| Veto Counter | 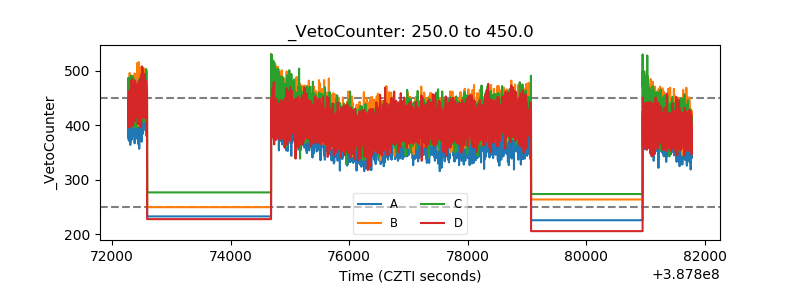 |