| Param | Original file | Final file |
|---|---|---|
| Filename | modeM0/AS1A11_097T07_9000005072_35422cztM0_level2.evt | modeM0/AS1A11_097T07_9000005072_35422cztM0_level2_quad_clean.evt |
| Size (bytes) | 525,611,520 | 44,605,440 |
| Size | 501.3 MB | 42.5 MB |
| Events in quadrant A | 2,507,402 | 270,962 |
| Events in quadrant B | 6,733,302 | 230,878 |
| Events in quadrant C | 3,008,486 | 261,087 |
| Events in quadrant D | 3,338,783 | 244,866 |
| Mode M0 | |||
|---|---|---|---|
| Quadrant | BADHDUFLAG | Total packets | Discarded packets |
| A | 0 | 10161 | 3 |
| B | 0 | 23383 | 2 |
| C | 0 | 11678 | 2 |
| D | 0 | 13017 | 2 |
| Mode M9 | |||
|---|---|---|---|
| Quadrant | BADHDUFLAG | Total packets | Discarded packets |
| A | 0 | 30 | 0 |
| B | 0 | 30 | 0 |
| C | 0 | 30 | 0 |
| D | 0 | 31 | 0 |
| Mode SS | |||
|---|---|---|---|
| Quadrant | BADHDUFLAG | Total packets | Discarded packets |
| A | 0 | 100 | 0 |
| B | 0 | 100 | 0 |
| C | 0 | 100 | 0 |
| D | 0 | 100 | 0 |
| Quadrant | Total seconds | Saturated seconds | Saturation percentage |
|---|---|---|---|
| A | 4872 | 5 | 0.102627% |
| B | 4872 | 1307 | 26.826765% |
| C | 4872 | 132 | 2.709360% |
| D | 4872 | 238 | 4.885057% |
Noise dominated data is calculated using 1-second bins in cleaned event files. If a bin has >2000 counts, and if more than 50% of those come from <1% of pixels, then it is considered to be noise-dominated and hence unusable.
| Quadrant | # 1 sec bins | Bins with >0 counts | Bins with >2000 counts | High rate bins dominated by noise | Noise dominated (total time) | Noise dominated (detector-on time) | Marked lightcurve |
|---|---|---|---|---|---|---|---|
| A | 7024 | 4873 | 0 | 0 | 0.00% | 0.00% | 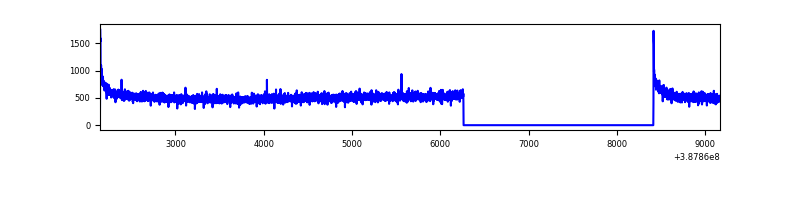 |
| B | 7024 | 4873 | 941 | 941 | 13.40% | 19.31% | 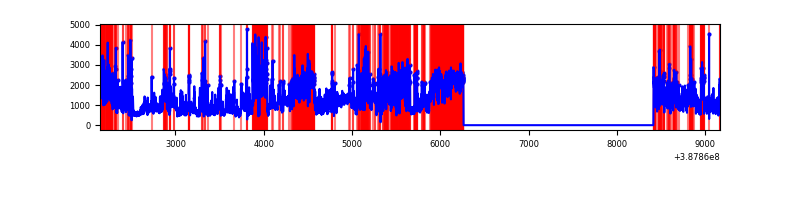 |
| C | 7024 | 4872 | 102 | 102 | 1.45% | 2.09% | 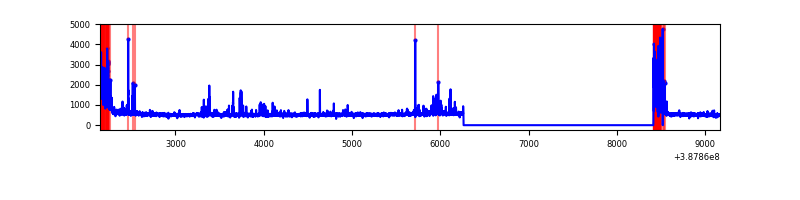 |
| D | 7024 | 4872 | 186 | 186 | 2.65% | 3.82% | 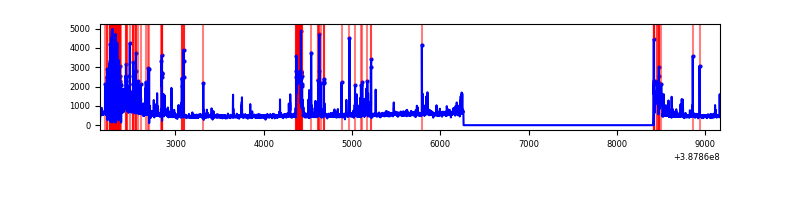 |
Top three noisy pixels from each quadrant. If the there are fewer than three noisy pixels in the level2.evt file, extra rows are filled as -1
| Pixel properties | Quadrant properties | ||||||
|---|---|---|---|---|---|---|---|
| Quadrant | DetID | PixID | Counts | Sigma | Mean | Median | Sigma |
| A | 10 | 83 | 123770 | 1005.39 | 612 | 602 | 122.5 |
| A | 13 | 6 | 16860 | 132.71 | 612 | 602 | 122.5 |
| A | 13 | 254 | 7317 | 54.81 | 612 | 602 | 122.5 |
| B | 4 | 251 | 2529944 | 23977.03 | 554 | 542 | 105.5 |
| B | 5 | 236 | 1331637 | 12617.89 | 554 | 542 | 105.5 |
| B | 5 | 172 | 176292 | 1665.99 | 554 | 542 | 105.5 |
| C | 0 | 10 | 345064 | 2541.2 | 582 | 587 | 135.6 |
| C | 15 | 214 | 201857 | 1484.76 | 582 | 587 | 135.6 |
| C | 0 | 207 | 175165 | 1287.86 | 582 | 587 | 135.6 |
| D | 13 | 249 | 414663 | 2936.88 | 571 | 556 | 141.0 |
| D | 7 | 80 | 365576 | 2588.75 | 571 | 556 | 141.0 |
| D | 8 | 195 | 139325 | 984.16 | 571 | 556 | 141.0 |
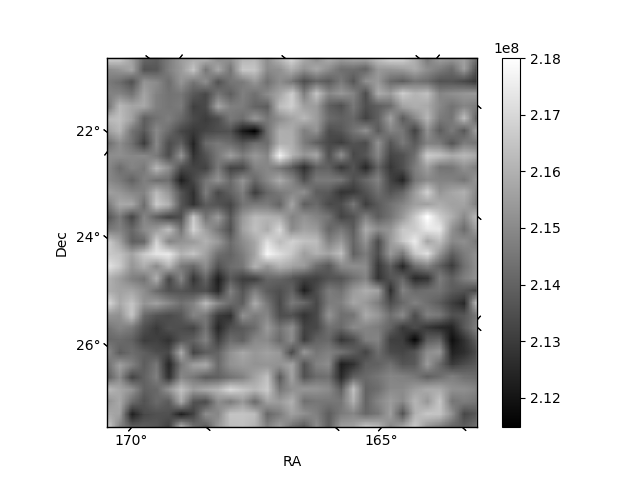
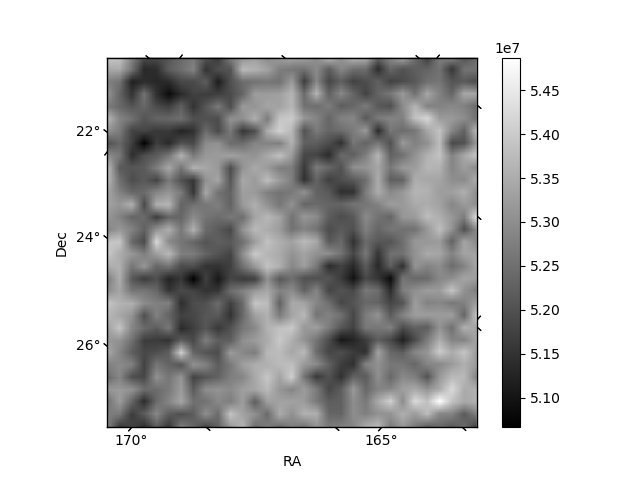
Histogram calculated using DETX and DETY for each event in the final _common_clean file
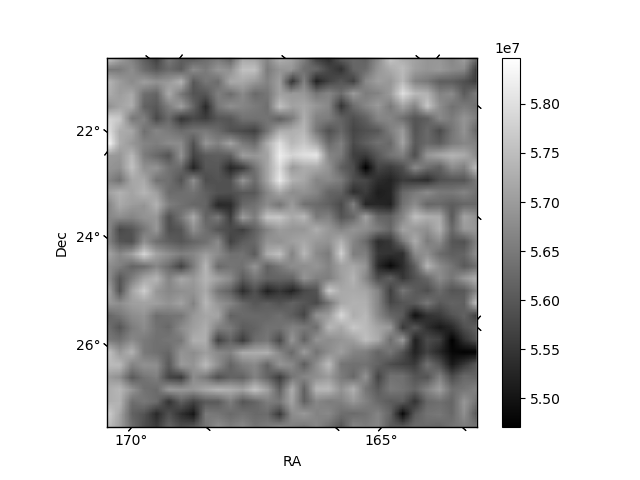
| Quadrant A | 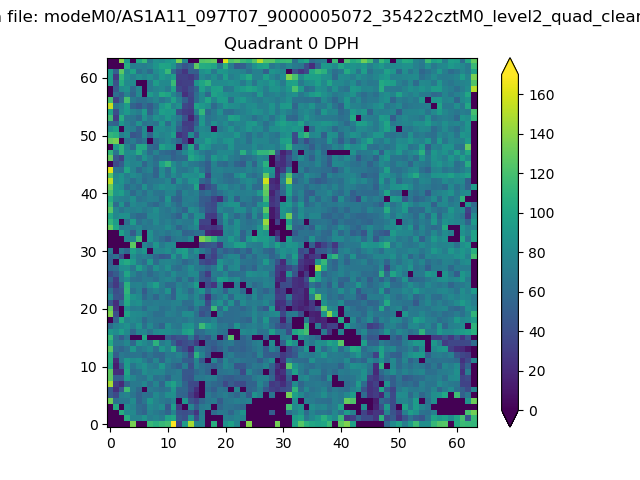 |
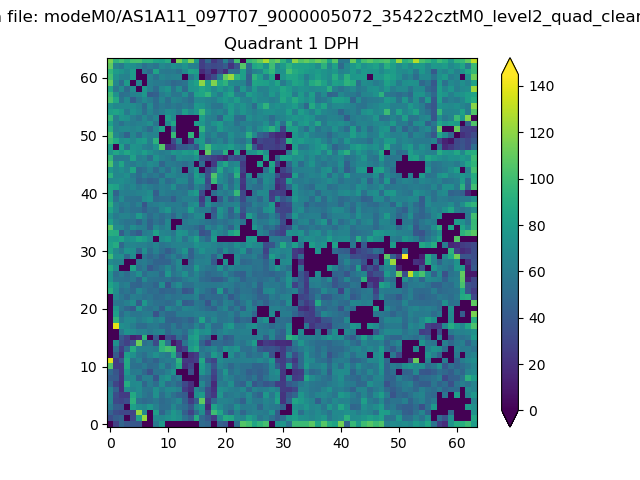 |
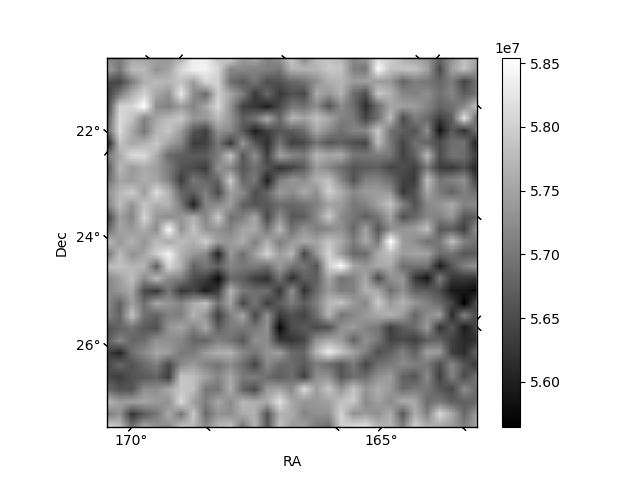
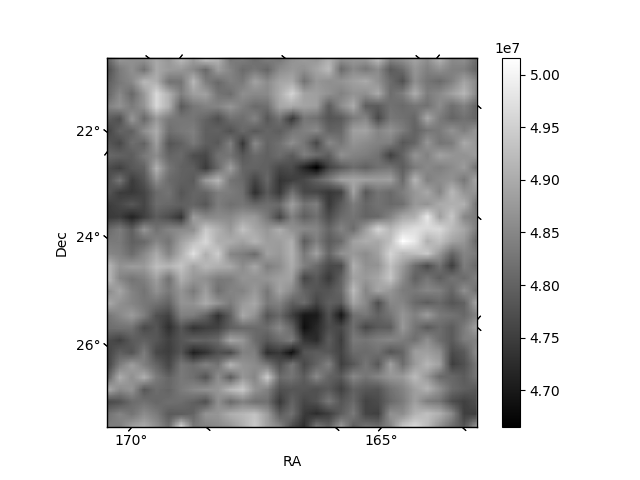
Quadrant B |
|---|---|---|---|
| Quadrant D | 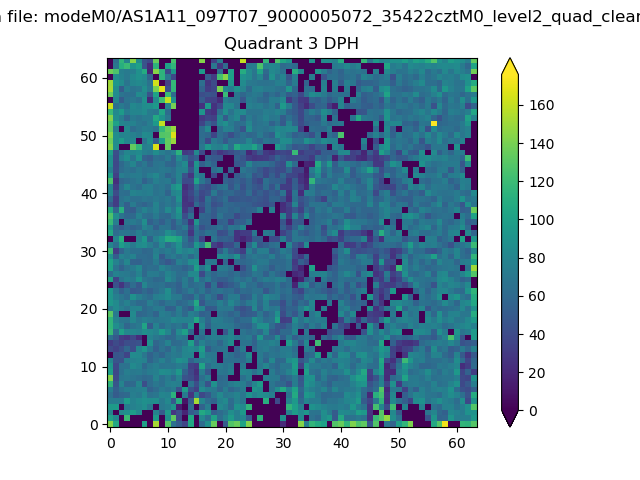 |
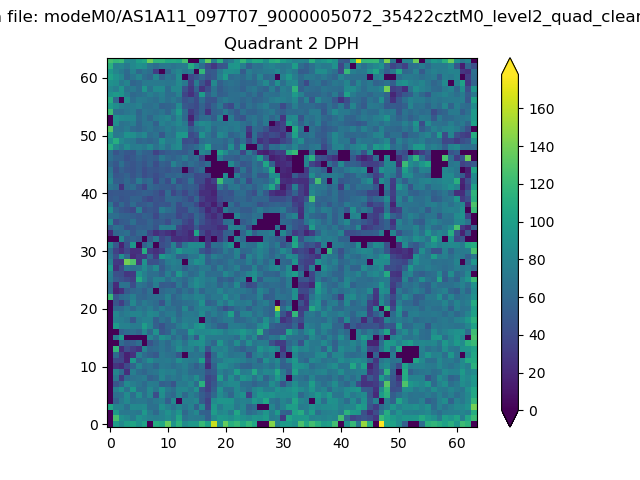 |
Quadrant C |
| Plot type | Count rate plots | Images |
|---|---|---|
| Comparison with Poisson distribution Blue bars denote a histogram of data divided into 1 sec bins. Red curve is a Poisson curve with rate = median count rate of data. |
 |
 |
| Quadrant-wise count rates Data is divided into 100 sec bins |
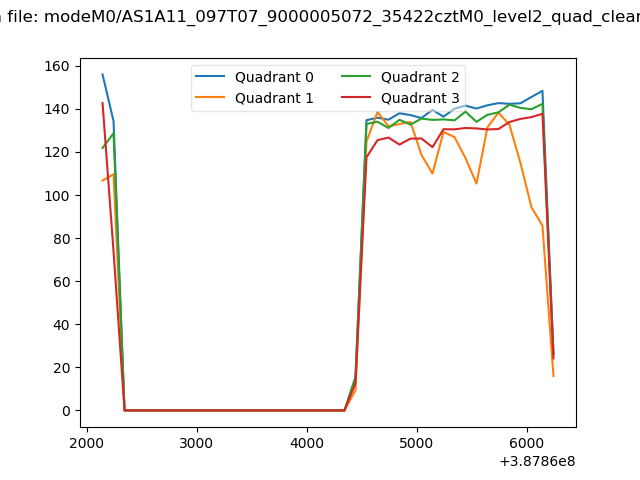 |
|
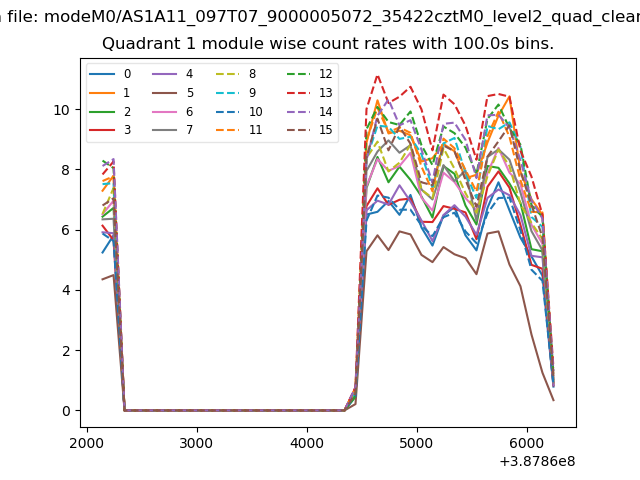
| Module-wise count rates for Quadrant A Data is divided into 100 sec bins |
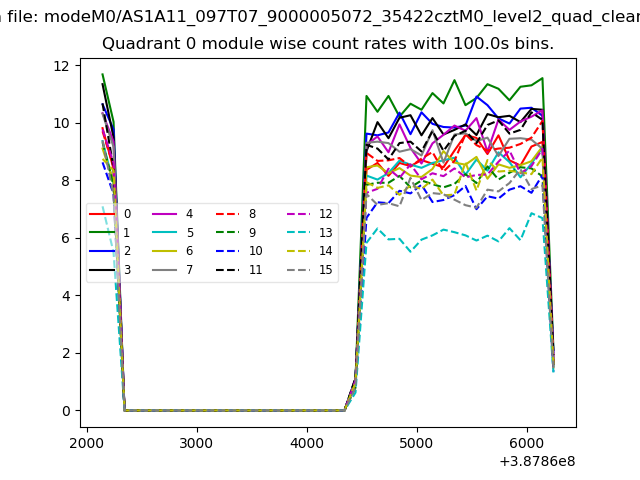 |
 |
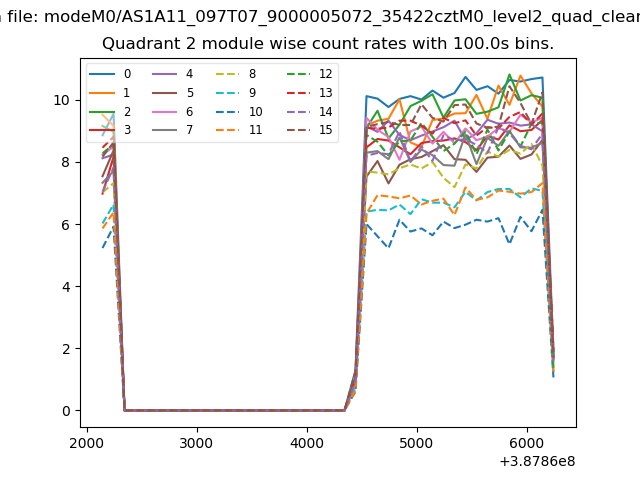
| Module-wise count rates for Quadrant B Data is divided into 100 sec bins |
 |
 |
| Module-wise count rates for Quadrant C Data is divided into 100 sec bins |
 |
 |
| Module-wise count rates for Quadrant D Data is divided into 100 sec bins |
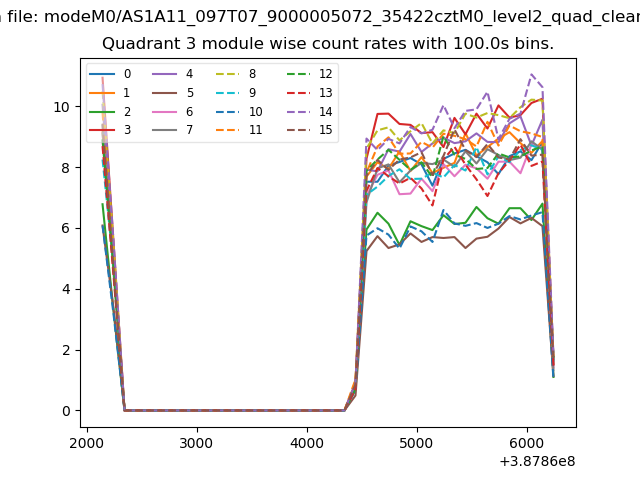 |
 |
| Parameter | Plot |
|---|---|
| CZT HV Monitor | 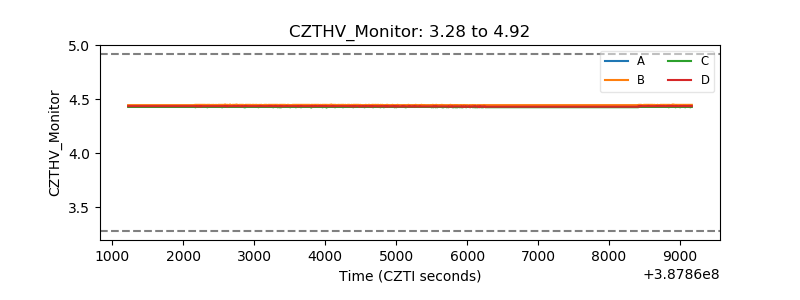 |
| D_VDD | 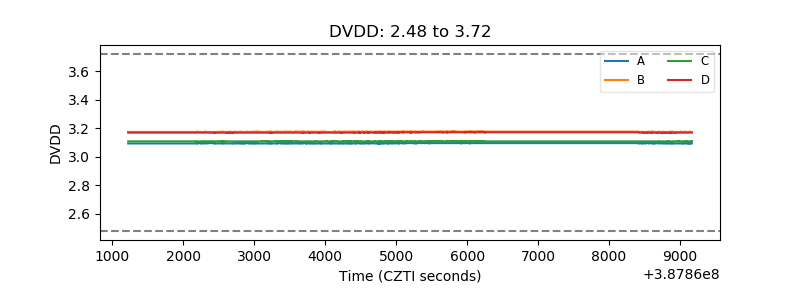 |
| Temperature 1 | 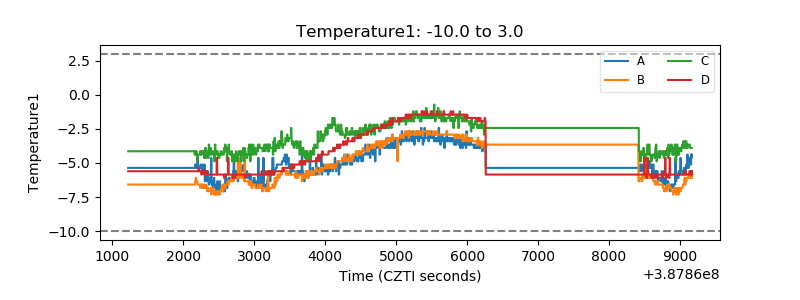 |
| Veto HV Monitor | 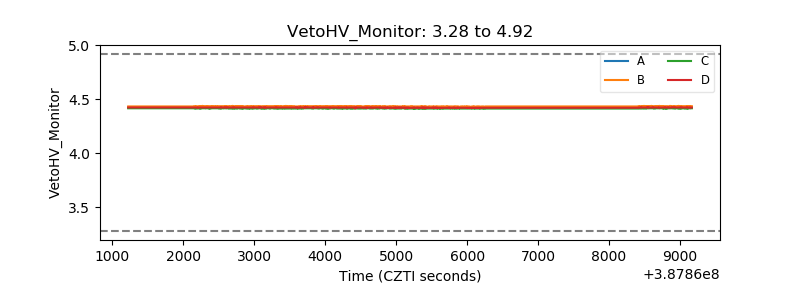 |
| Veto LLD | 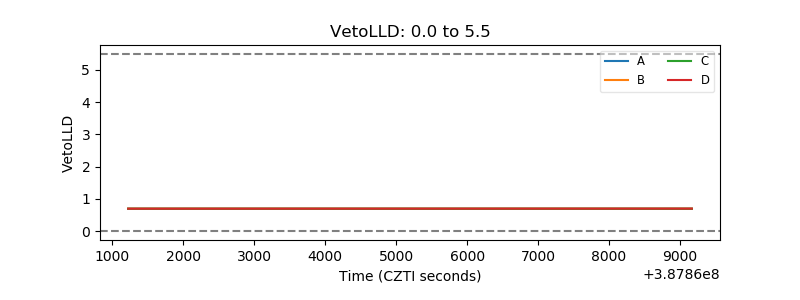 |
| Alpha Counter | 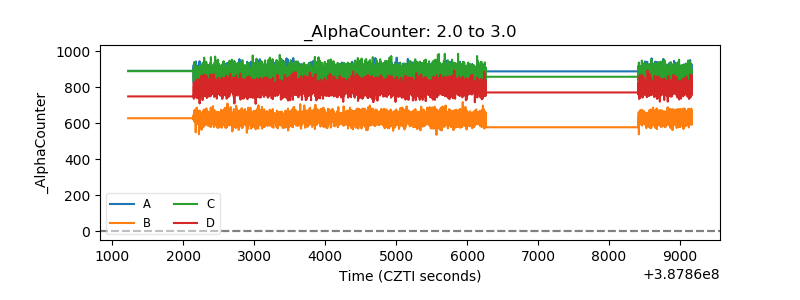 |
| _CPM_Rate | 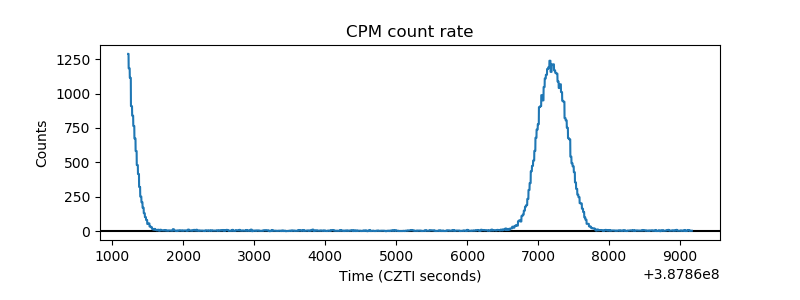 |
| CZT Counter | 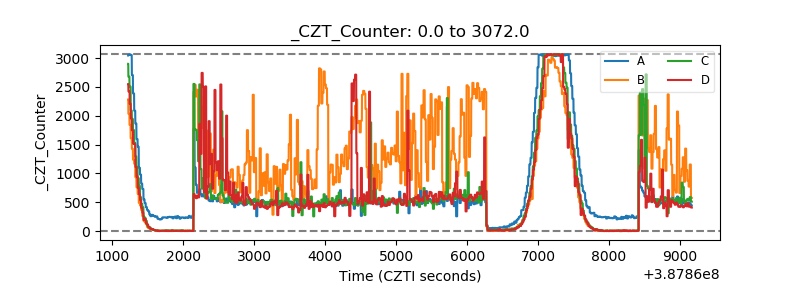 |
| +2.5 Volts monitor | 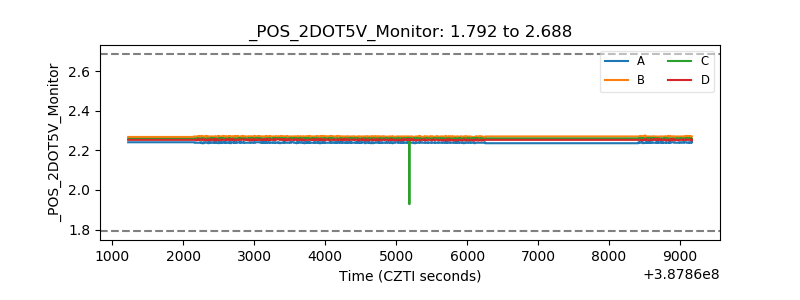 |
| +5 Volts monitor | 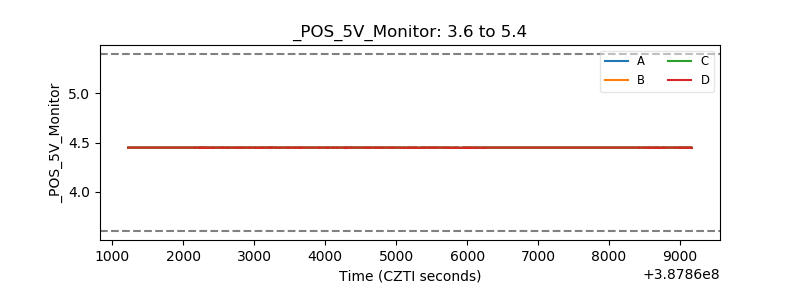 |
| _ROLL_ROT | 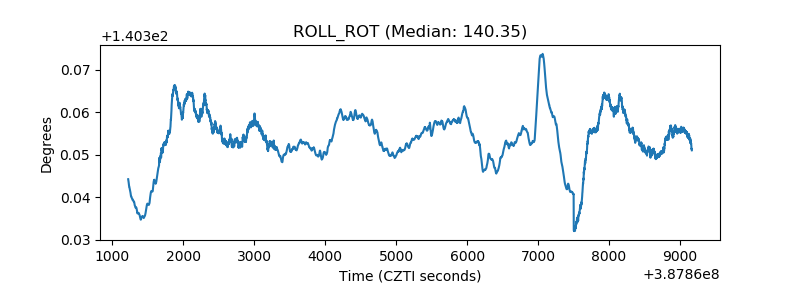 |
| _Roll_DEC | 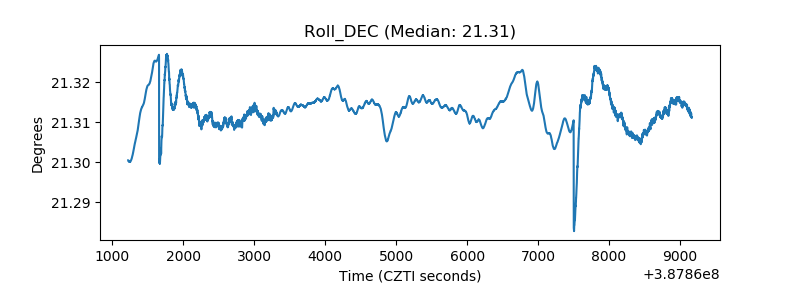 |
| _Roll_RA | 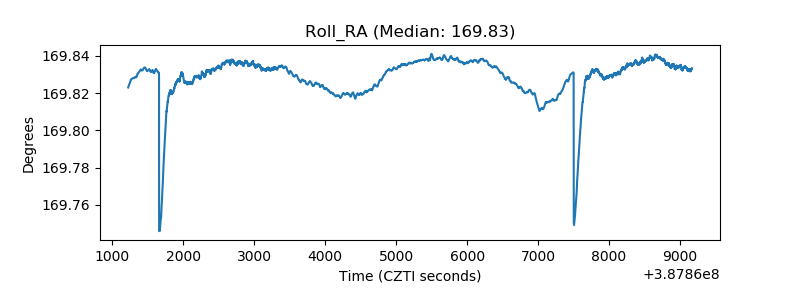 |
| Veto Counter | 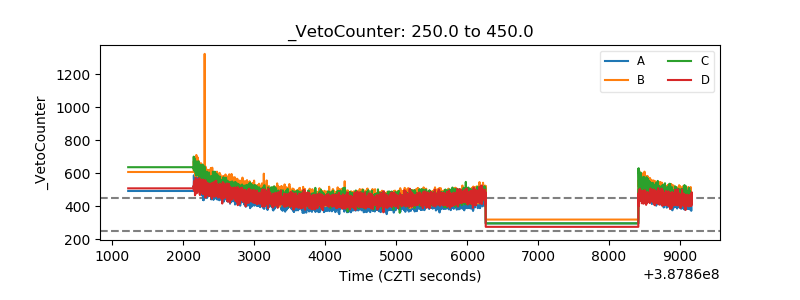 |