| Param | Original file | Final file |
|---|---|---|
| Filename | modeM0/AS1A11_097T07_9000005072_35421cztM0_level2.evt | modeM0/AS1A11_097T07_9000005072_35421cztM0_level2_quad_clean.evt |
| Size (bytes) | 1,004,238,720 | 96,903,360 |
| Size | 957.7 MB | 92.4 MB |
| Events in quadrant A | 4,721,823 | 613,995 |
| Events in quadrant B | 12,171,886 | 538,370 |
| Events in quadrant C | 5,849,338 | 590,185 |
| Events in quadrant D | 7,042,079 | 543,890 |
| Mode M0 | |||
|---|---|---|---|
| Quadrant | BADHDUFLAG | Total packets | Discarded packets |
| A | 0 | 19396 | 4 |
| B | 0 | 42762 | 3 |
| C | 0 | 22923 | 3 |
| D | 0 | 27091 | 3 |
| Mode M9 | |||
|---|---|---|---|
| Quadrant | BADHDUFLAG | Total packets | Discarded packets |
| A | 0 | 48 | 0 |
| B | 0 | 48 | 0 |
| C | 0 | 48 | 0 |
| D | 0 | 49 | 0 |
| Mode SS | |||
|---|---|---|---|
| Quadrant | BADHDUFLAG | Total packets | Discarded packets |
| A | 0 | 192 | 0 |
| B | 0 | 192 | 0 |
| C | 0 | 192 | 0 |
| D | 0 | 192 | 0 |
| Quadrant | Total seconds | Saturated seconds | Saturation percentage |
|---|---|---|---|
| A | 9323 | 13 | 0.139440% |
| B | 9323 | 2221 | 23.822804% |
| C | 9323 | 239 | 2.563553% |
| D | 9323 | 541 | 5.802853% |
Noise dominated data is calculated using 1-second bins in cleaned event files. If a bin has >2000 counts, and if more than 50% of those come from <1% of pixels, then it is considered to be noise-dominated and hence unusable.
| Quadrant | # 1 sec bins | Bins with >0 counts | Bins with >2000 counts | High rate bins dominated by noise | Noise dominated (total time) | Noise dominated (detector-on time) | Marked lightcurve |
|---|---|---|---|---|---|---|---|
| A | 13418 | 9325 | 0 | 0 | 0.00% | 0.00% | 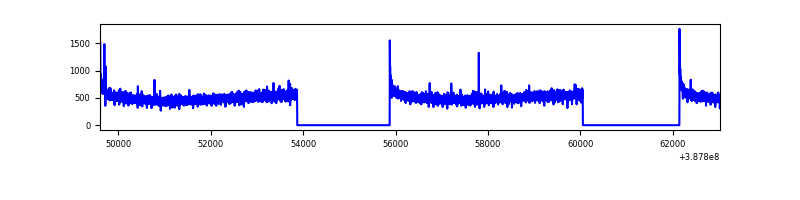 |
| B | 13418 | 9325 | 1623 | 1623 | 12.10% | 17.40% | 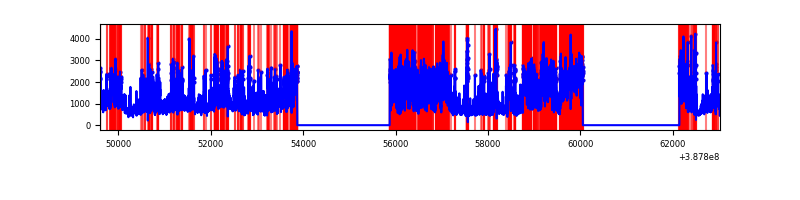 |
| C | 13418 | 9325 | 193 | 193 | 1.44% | 2.07% | 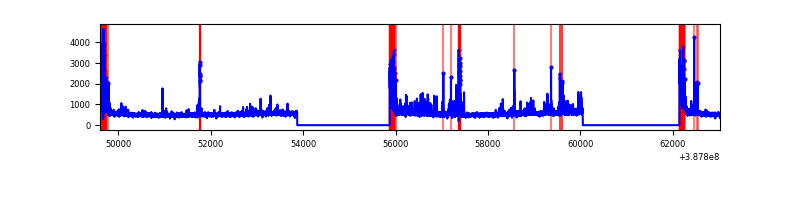 |
| D | 13418 | 9325 | 391 | 391 | 2.91% | 4.19% | 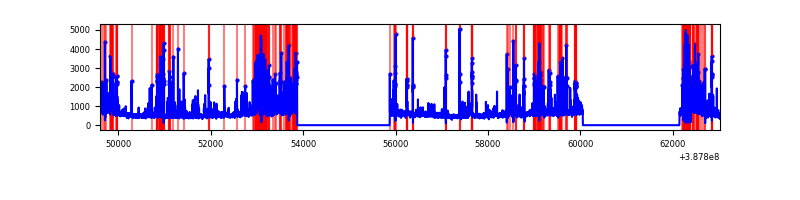 |
Top three noisy pixels from each quadrant. If the there are fewer than three noisy pixels in the level2.evt file, extra rows are filled as -1
| Pixel properties | Quadrant properties | ||||||
|---|---|---|---|---|---|---|---|
| Quadrant | DetID | PixID | Counts | Sigma | Mean | Median | Sigma |
| A | 10 | 83 | 201357 | 869.64 | 1164 | 1143 | 230.2 |
| A | 13 | 6 | 22635 | 93.35 | 1164 | 1143 | 230.2 |
| A | 13 | 254 | 14237 | 56.87 | 1164 | 1143 | 230.2 |
| B | 4 | 251 | 4163817 | 20561.75 | 1076 | 1053 | 202.5 |
| B | 5 | 236 | 1748617 | 8632.0 | 1076 | 1053 | 202.5 |
| B | 5 | 172 | 548497 | 2704.07 | 1076 | 1053 | 202.5 |
| C | 0 | 10 | 629148 | 2434.91 | 1116 | 1127 | 257.9 |
| C | 0 | 207 | 453953 | 1755.66 | 1116 | 1127 | 257.9 |
| C | 15 | 214 | 376010 | 1453.46 | 1116 | 1127 | 257.9 |
| D | 7 | 80 | 1378441 | 5177.2 | 1087 | 1058 | 266.0 |
| D | 8 | 195 | 548485 | 2057.63 | 1087 | 1058 | 266.0 |
| D | 13 | 249 | 431339 | 1617.31 | 1087 | 1058 | 266.0 |
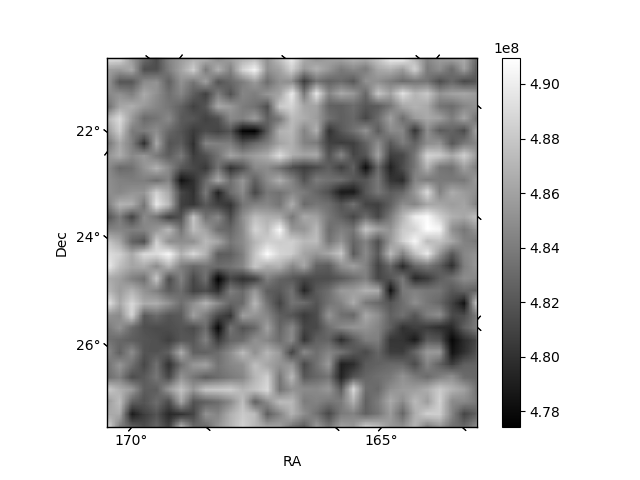
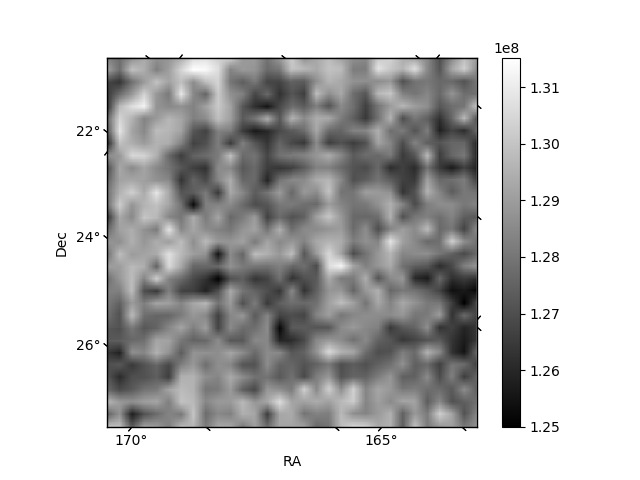
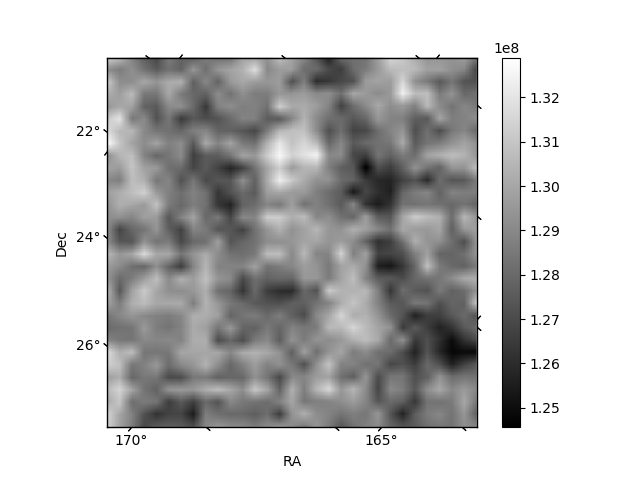
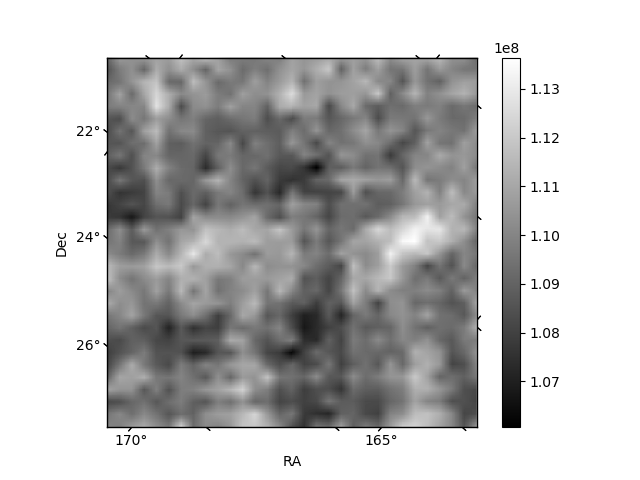
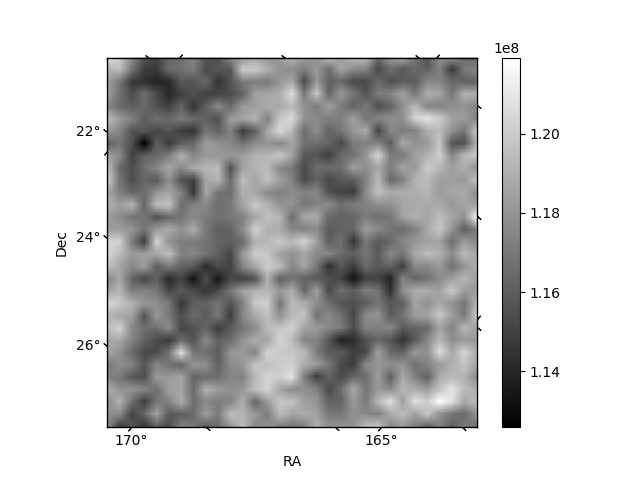
Histogram calculated using DETX and DETY for each event in the final _common_clean file
| Quadrant A | 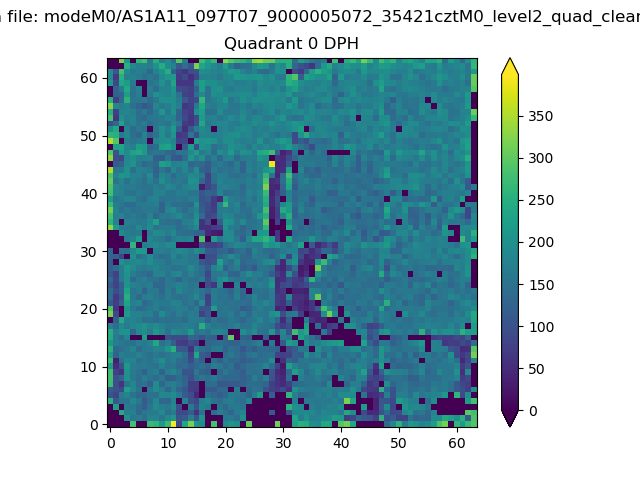 |
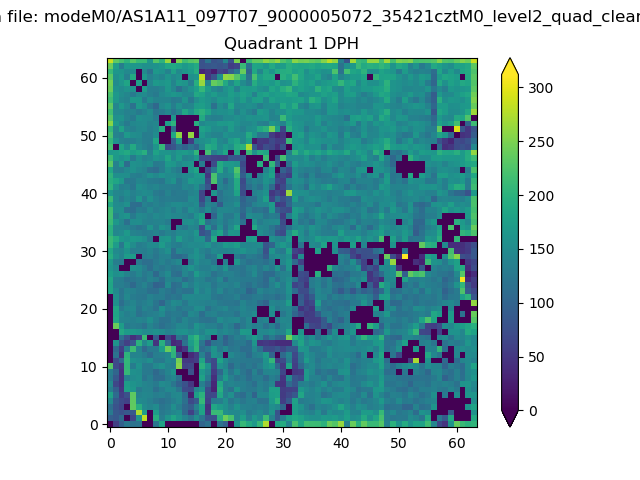 |
Quadrant B |
|---|---|---|---|
| Quadrant D | 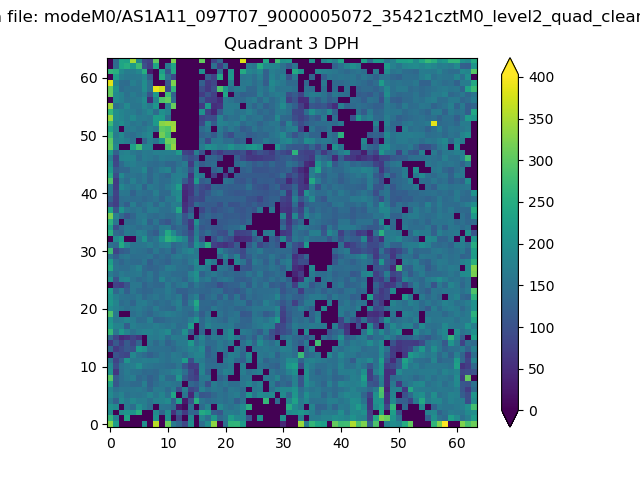 |
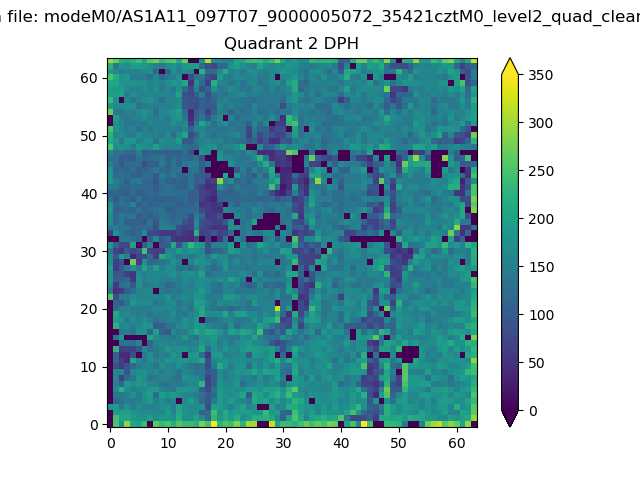 |
Quadrant C |
| Plot type | Count rate plots | Images |
|---|---|---|
| Comparison with Poisson distribution Blue bars denote a histogram of data divided into 1 sec bins. Red curve is a Poisson curve with rate = median count rate of data. |
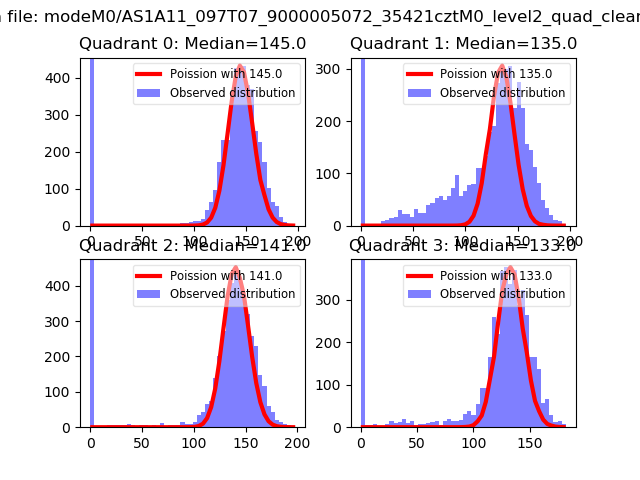 |
 |
| Quadrant-wise count rates Data is divided into 100 sec bins |
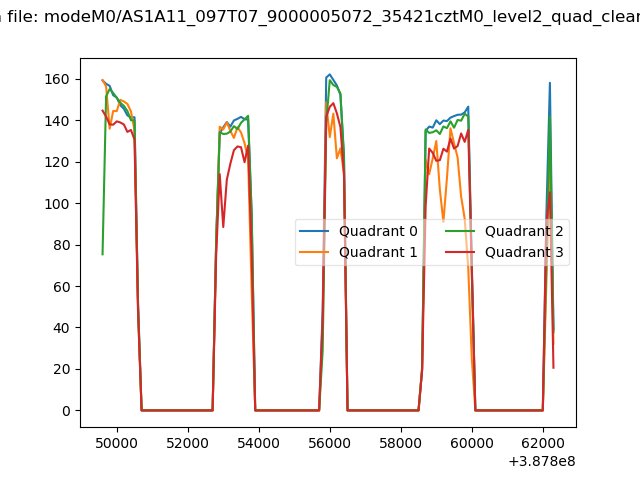 |
|
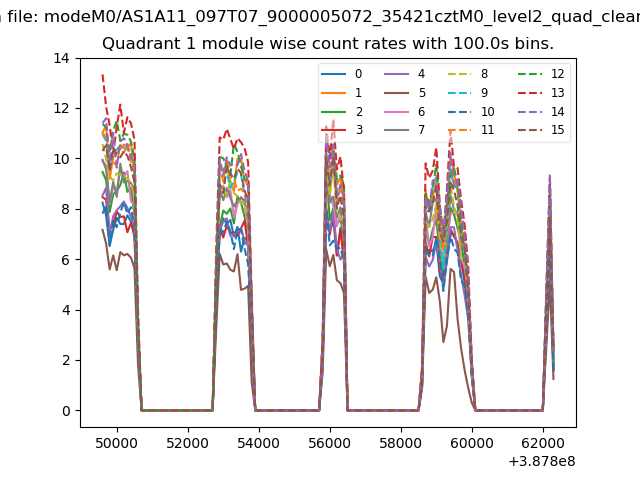
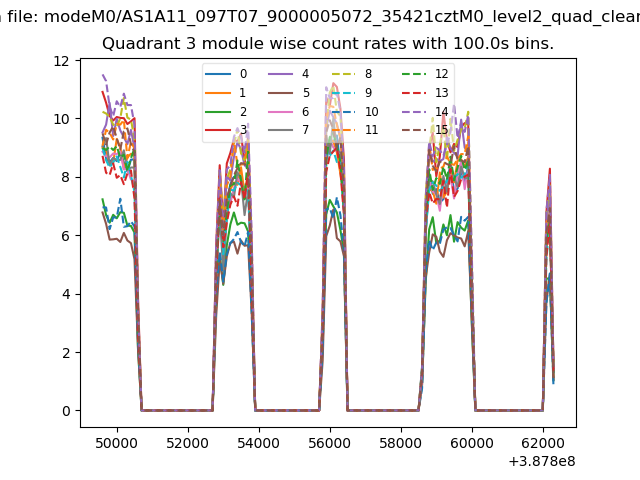
| Module-wise count rates for Quadrant A Data is divided into 100 sec bins |
 |
 |
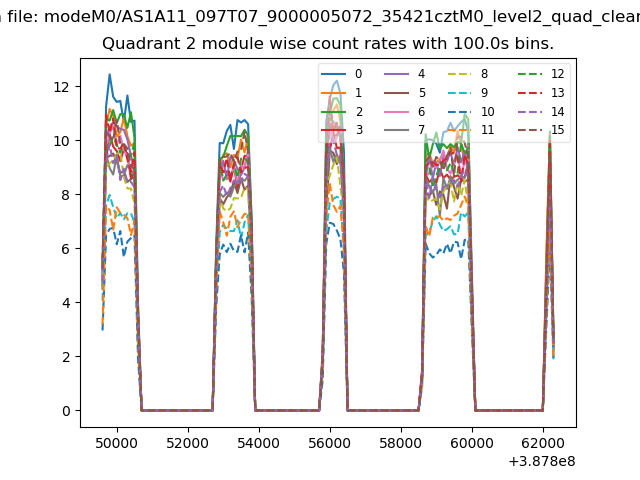
| Module-wise count rates for Quadrant B Data is divided into 100 sec bins |
 |
 |
| Module-wise count rates for Quadrant C Data is divided into 100 sec bins |
 |
 |
| Module-wise count rates for Quadrant D Data is divided into 100 sec bins |
 |
 |
| Parameter | Plot |
|---|---|
| CZT HV Monitor | 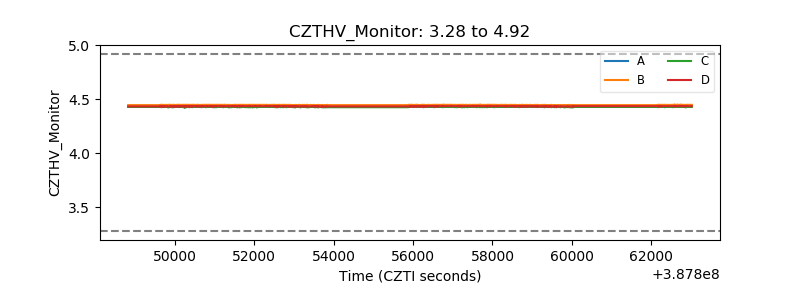 |
| D_VDD | 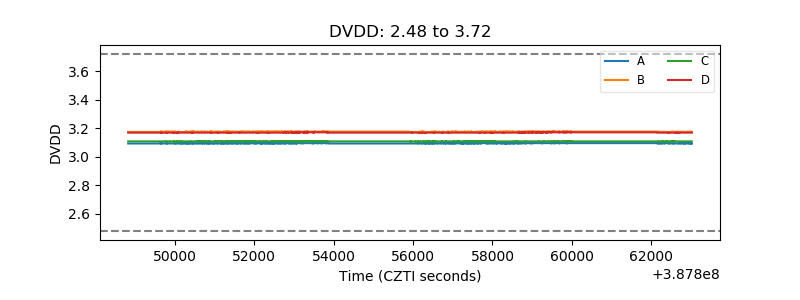 |
| Temperature 1 | 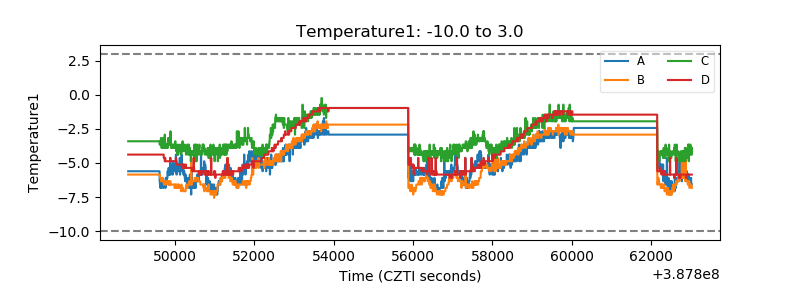 |
| Veto HV Monitor | 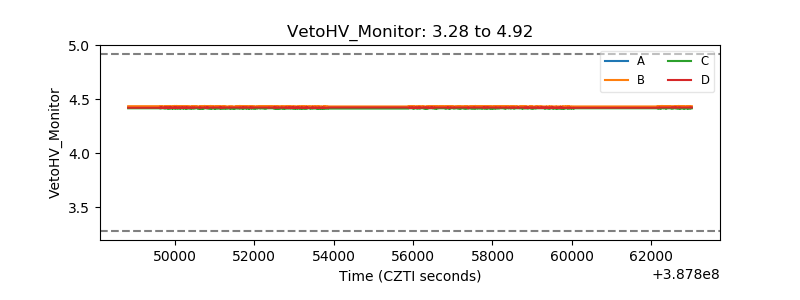 |
| Veto LLD | 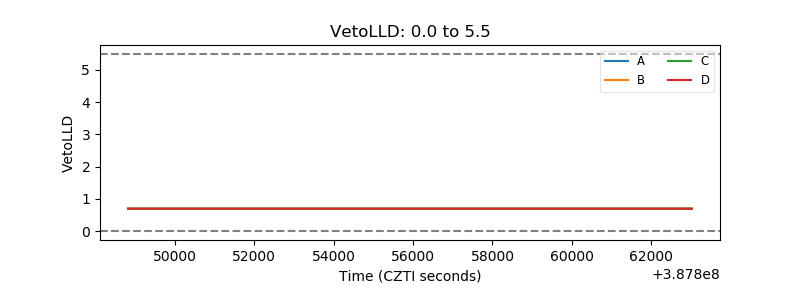 |
| Alpha Counter | 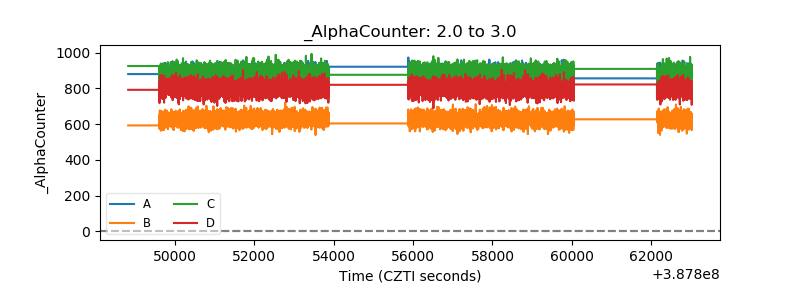 |
| _CPM_Rate | 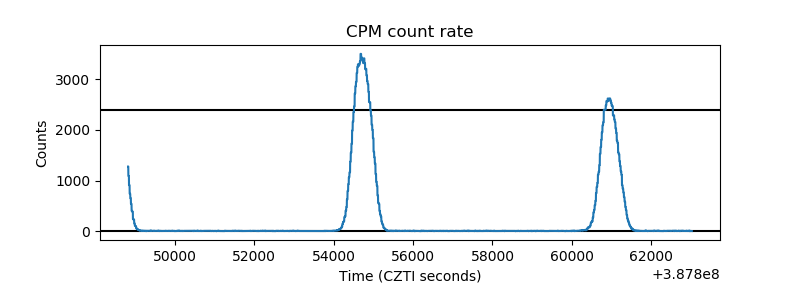 |
| CZT Counter |  |
| +2.5 Volts monitor | 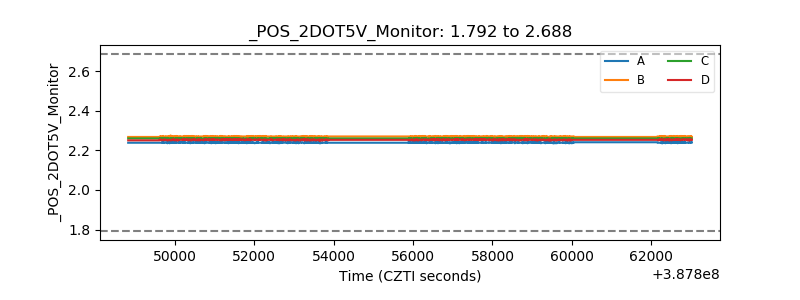 |
| +5 Volts monitor | 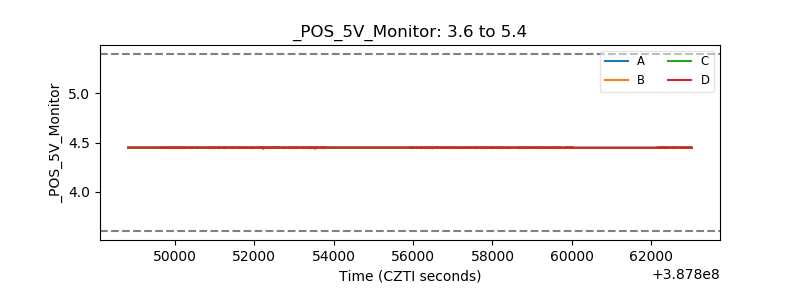 |
| _ROLL_ROT | 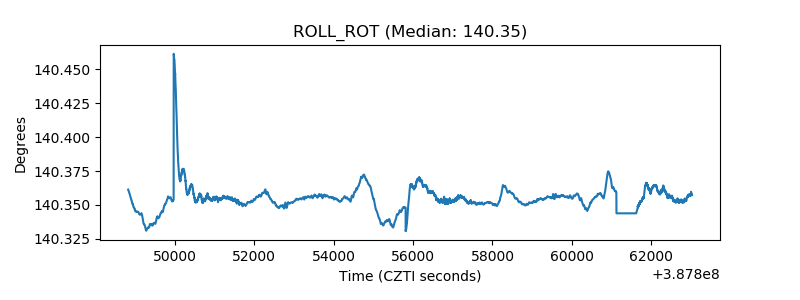 |
| _Roll_DEC | 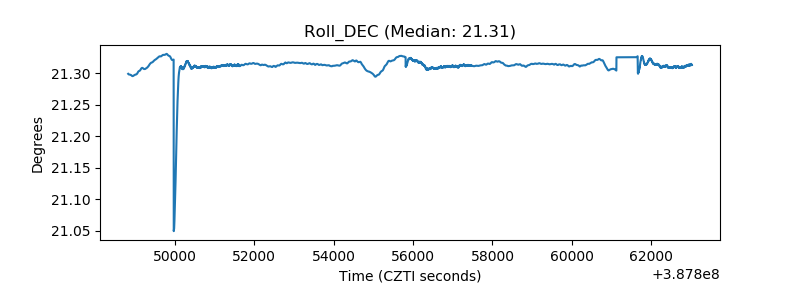 |
| _Roll_RA |  |
| Veto Counter | 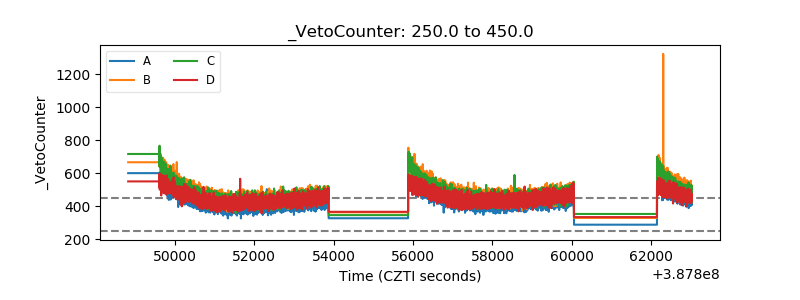 |