| Param | Original file | Final file |
|---|---|---|
| Filename | modeM0/AS1A11_097T07_9000005072_35420cztM0_level2.evt | modeM0/AS1A11_097T07_9000005072_35420cztM0_level2_quad_clean.evt |
| Size (bytes) | 544,144,320 | 61,980,480 |
| Size | 518.9 MB | 59.1 MB |
| Events in quadrant A | 2,611,958 | 399,801 |
| Events in quadrant B | 6,414,286 | 373,093 |
| Events in quadrant C | 3,199,880 | 383,732 |
| Events in quadrant D | 3,903,088 | 357,006 |
| Mode M0 | |||
|---|---|---|---|
| Quadrant | BADHDUFLAG | Total packets | Discarded packets |
| A | 0 | 10797 | 3 |
| B | 0 | 22759 | 2 |
| C | 0 | 12541 | 2 |
| D | 0 | 15007 | 2 |
| Mode M9 | |||
|---|---|---|---|
| Quadrant | BADHDUFLAG | Total packets | Discarded packets |
| A | 0 | 38 | 0 |
| B | 0 | 38 | 0 |
| C | 0 | 38 | 0 |
| D | 0 | 38 | 0 |
| Mode SS | |||
|---|---|---|---|
| Quadrant | BADHDUFLAG | Total packets | Discarded packets |
| A | 0 | 110 | 0 |
| B | 0 | 110 | 0 |
| C | 0 | 110 | 0 |
| D | 0 | 110 | 0 |
| Quadrant | Total seconds | Saturated seconds | Saturation percentage |
|---|---|---|---|
| A | 5166 | 5 | 0.096787% |
| B | 5166 | 928 | 17.963608% |
| C | 5166 | 156 | 3.019744% |
| D | 5166 | 295 | 5.710414% |
Noise dominated data is calculated using 1-second bins in cleaned event files. If a bin has >2000 counts, and if more than 50% of those come from <1% of pixels, then it is considered to be noise-dominated and hence unusable.
| Quadrant | # 1 sec bins | Bins with >0 counts | Bins with >2000 counts | High rate bins dominated by noise | Noise dominated (total time) | Noise dominated (detector-on time) | Marked lightcurve |
|---|---|---|---|---|---|---|---|
| A | 9051 | 5168 | 0 | 0 | 0.00% | 0.00% | 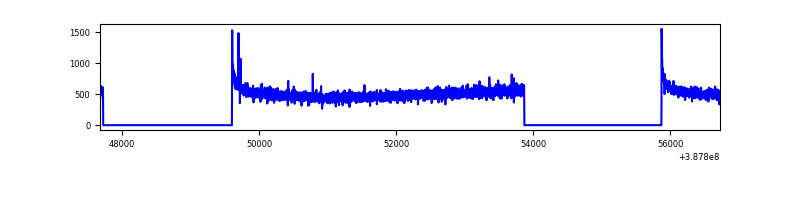 |
| B | 9051 | 5168 | 674 | 674 | 7.45% | 13.04% |  |
| C | 9051 | 5168 | 122 | 122 | 1.35% | 2.36% | 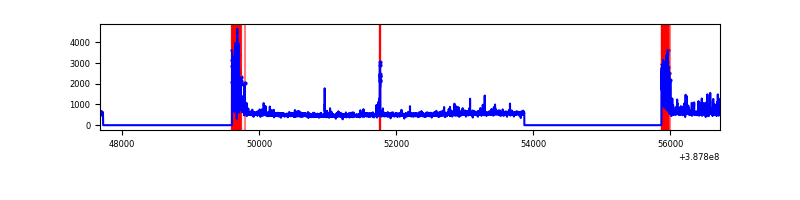 |
| D | 9051 | 5168 | 225 | 225 | 2.49% | 4.35% | 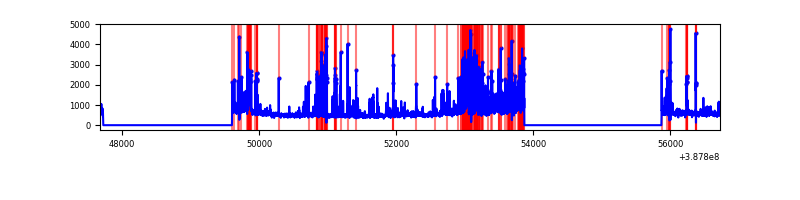 |
Top three noisy pixels from each quadrant. If the there are fewer than three noisy pixels in the level2.evt file, extra rows are filled as -1
| Pixel properties | Quadrant properties | ||||||
|---|---|---|---|---|---|---|---|
| Quadrant | DetID | PixID | Counts | Sigma | Mean | Median | Sigma |
| A | 10 | 83 | 121917 | 944.48 | 641 | 629 | 128.4 |
| A | 13 | 6 | 11001 | 80.77 | 641 | 629 | 128.4 |
| A | 13 | 254 | 7797 | 55.82 | 641 | 629 | 128.4 |
| B | 4 | 251 | 2252690 | 19447.68 | 610 | 596 | 115.8 |
| B | 5 | 236 | 1137900 | 9821.05 | 610 | 596 | 115.8 |
| B | 5 | 172 | 217748 | 1875.19 | 610 | 596 | 115.8 |
| C | 0 | 10 | 453914 | 3156.11 | 616 | 623 | 143.6 |
| C | 15 | 214 | 209707 | 1455.78 | 616 | 623 | 143.6 |
| C | 0 | 207 | 121813 | 843.81 | 616 | 623 | 143.6 |
| D | 7 | 80 | 830738 | 5594.77 | 602 | 586 | 148.4 |
| D | 8 | 195 | 310289 | 2087.23 | 602 | 586 | 148.4 |
| D | 13 | 249 | 177990 | 1195.61 | 602 | 586 | 148.4 |
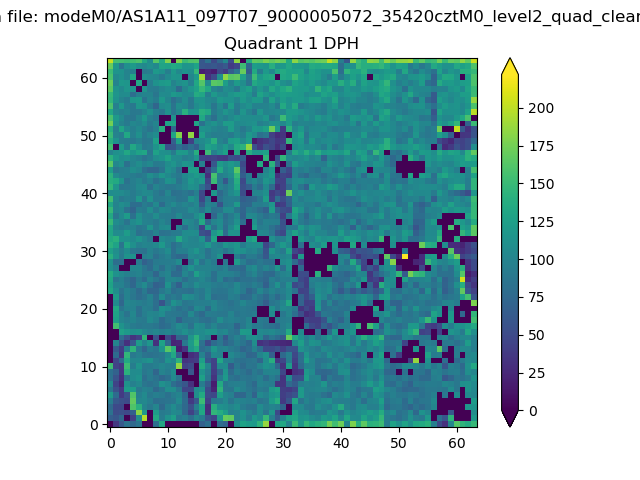
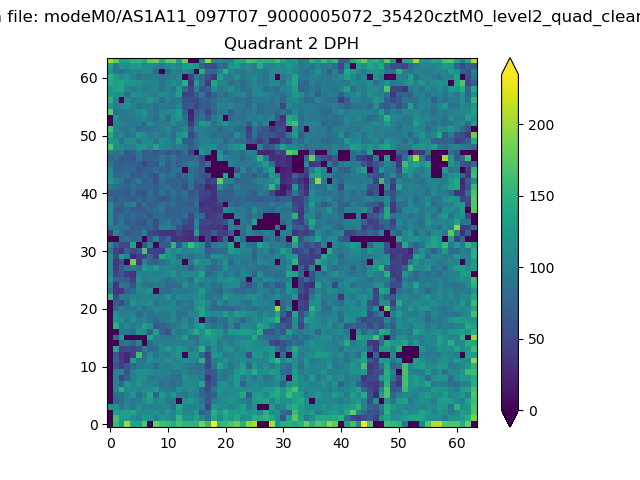
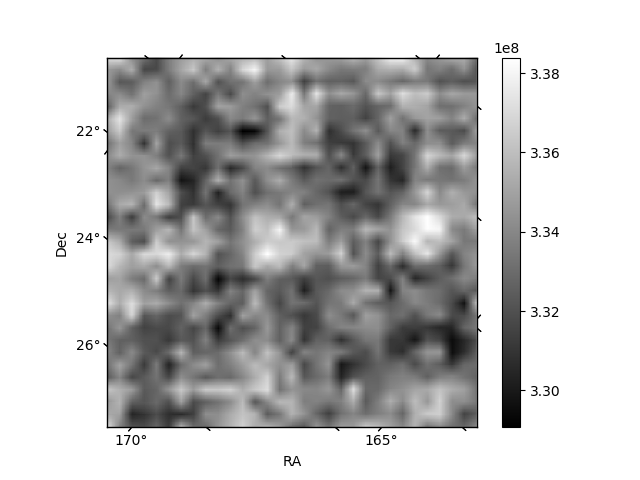
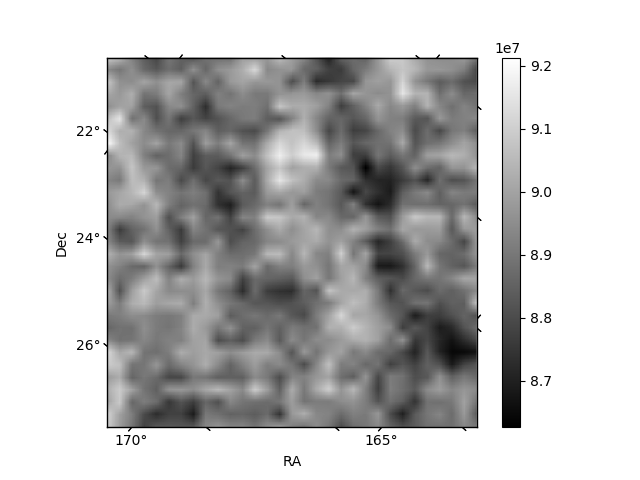
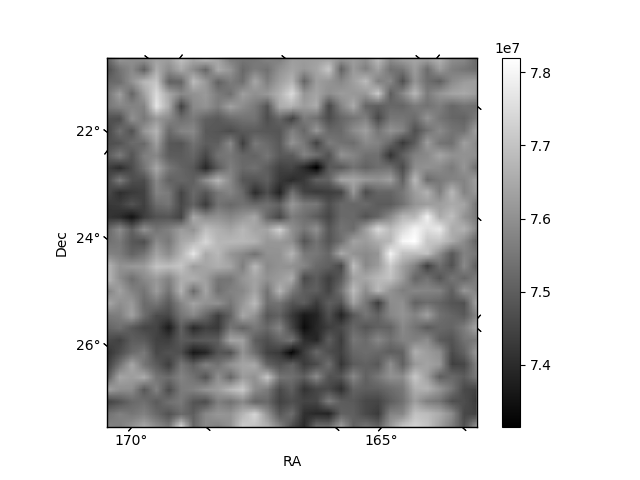
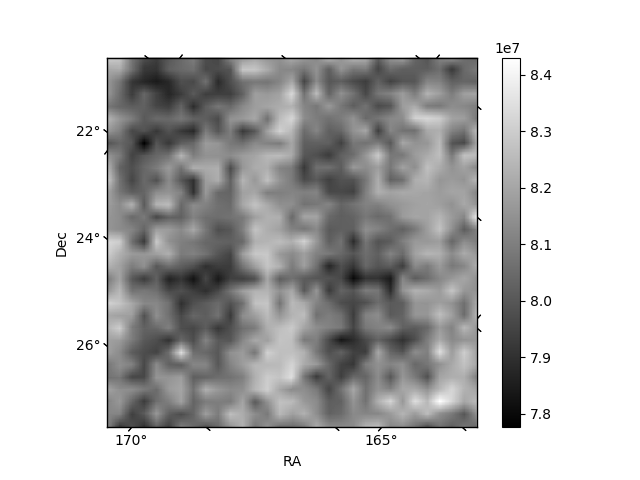
Histogram calculated using DETX and DETY for each event in the final _common_clean file
| Quadrant A | 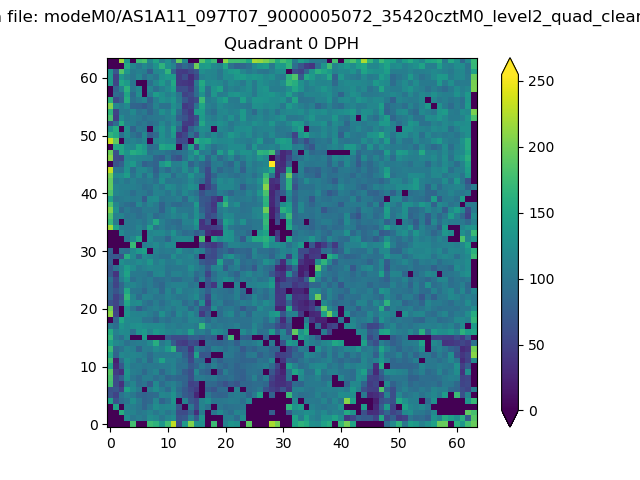 |
 |
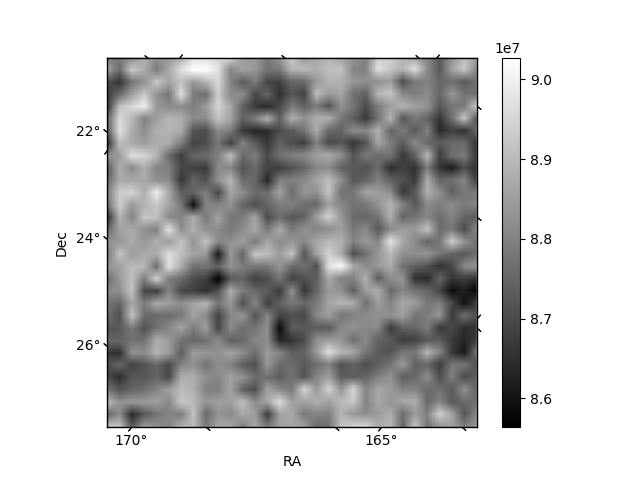
Quadrant B |
|---|---|---|---|
| Quadrant D | 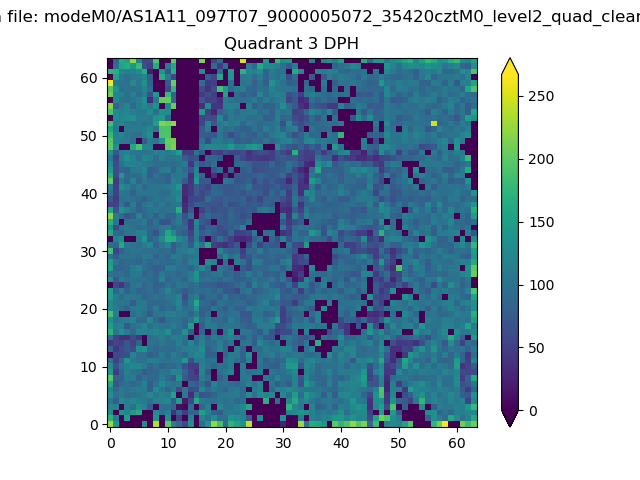 |
 |
Quadrant C |
| Plot type | Count rate plots | Images |
|---|---|---|
| Comparison with Poisson distribution Blue bars denote a histogram of data divided into 1 sec bins. Red curve is a Poisson curve with rate = median count rate of data. |
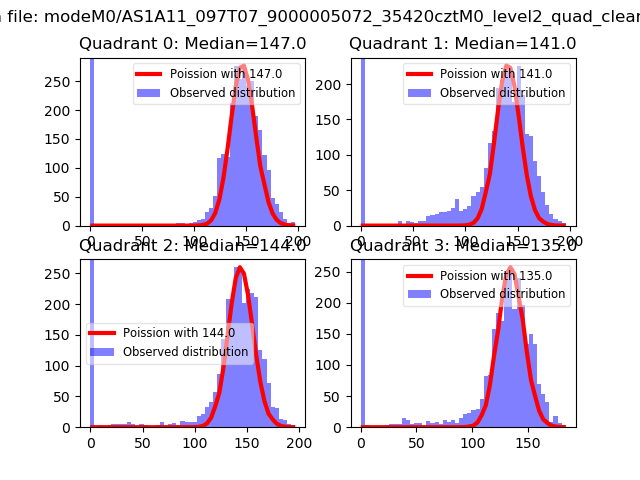 |
 |
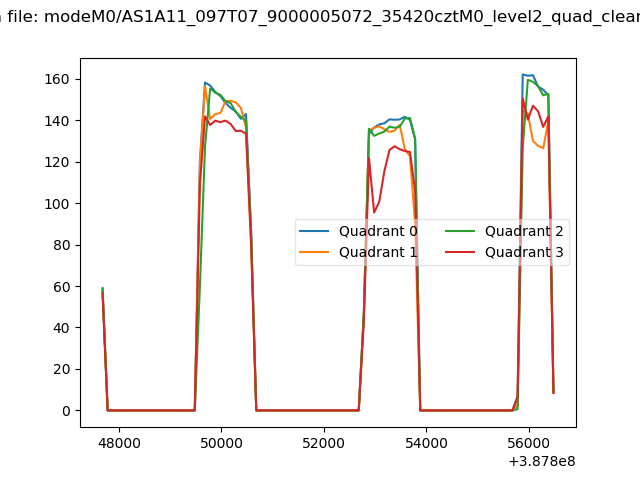
| Quadrant-wise count rates Data is divided into 100 sec bins |
 |
|
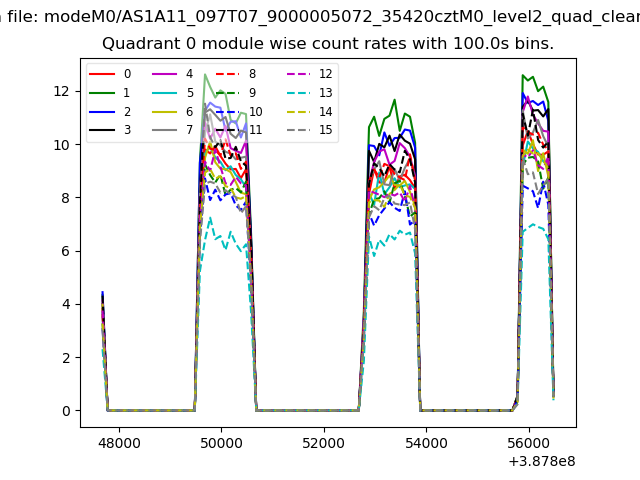
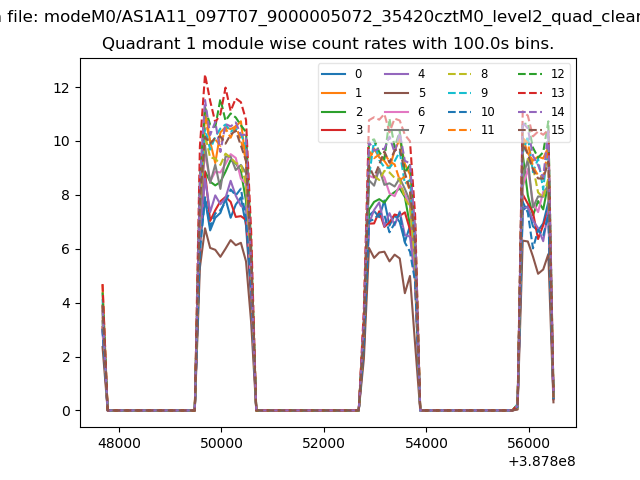
| Module-wise count rates for Quadrant A Data is divided into 100 sec bins |
 |
 |
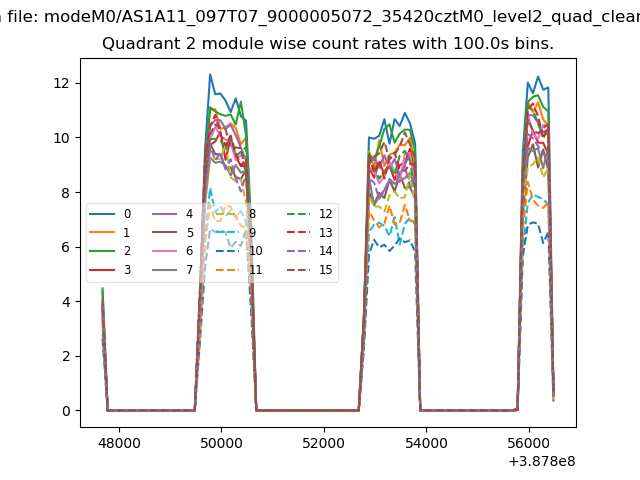
| Module-wise count rates for Quadrant B Data is divided into 100 sec bins |
 |
 |
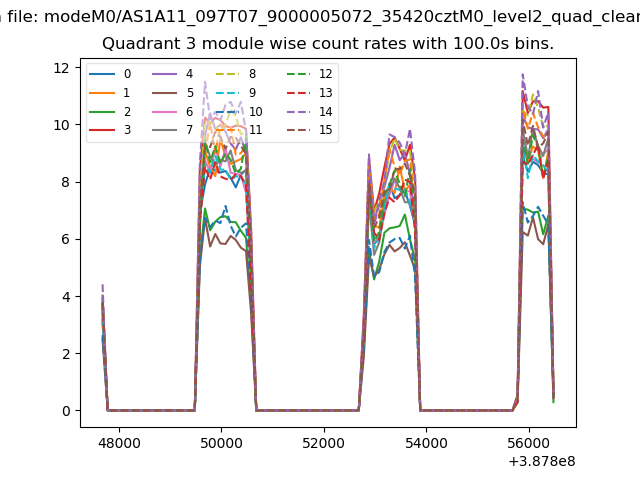
| Module-wise count rates for Quadrant C Data is divided into 100 sec bins |
 |
 |
| Module-wise count rates for Quadrant D Data is divided into 100 sec bins |
 |
 |
| Parameter | Plot |
|---|---|
| CZT HV Monitor | 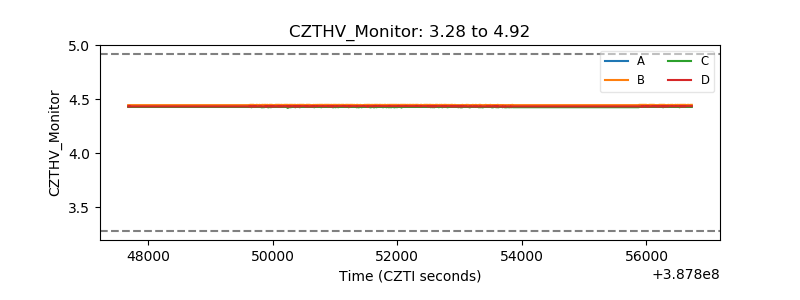 |
| D_VDD | 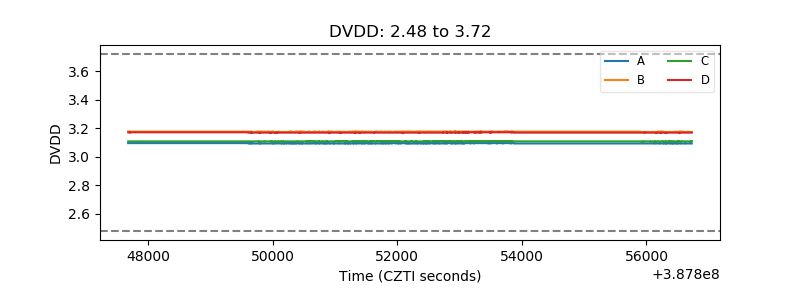 |
| Temperature 1 | 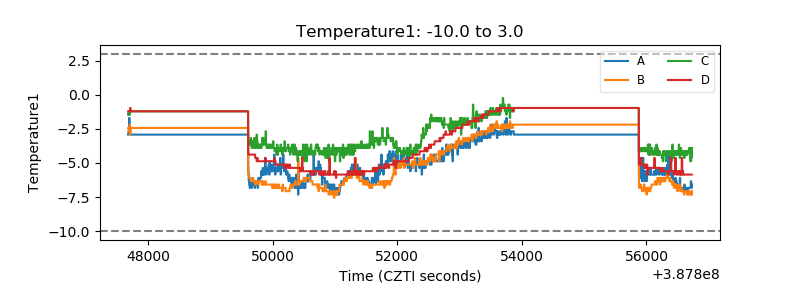 |
| Veto HV Monitor | 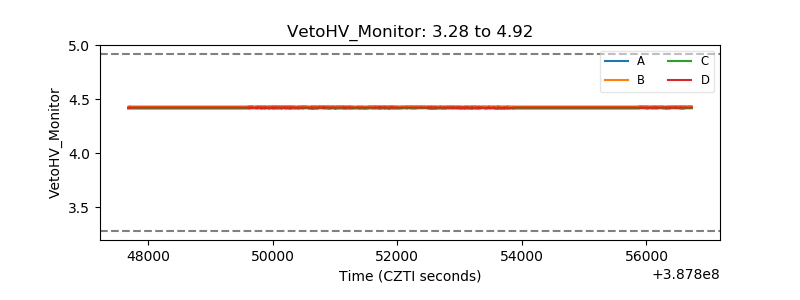 |
| Veto LLD | 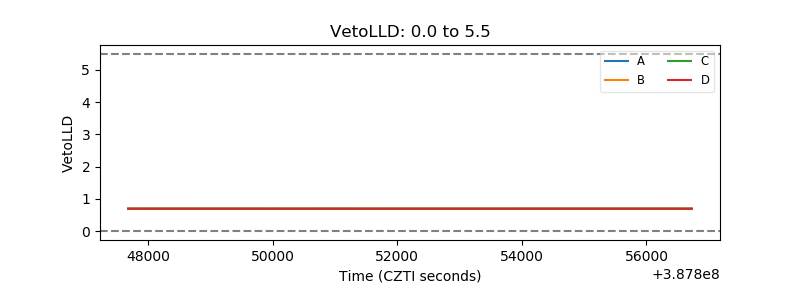 |
| Alpha Counter | 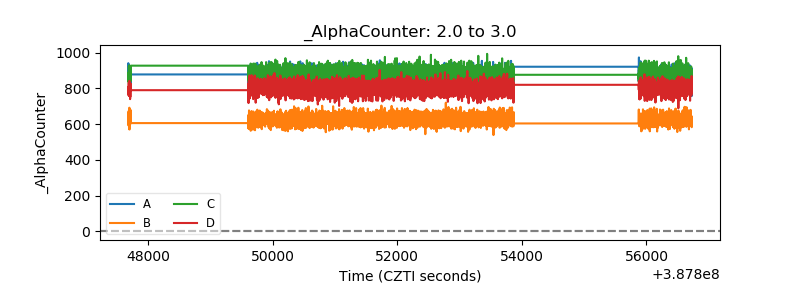 |
| _CPM_Rate | 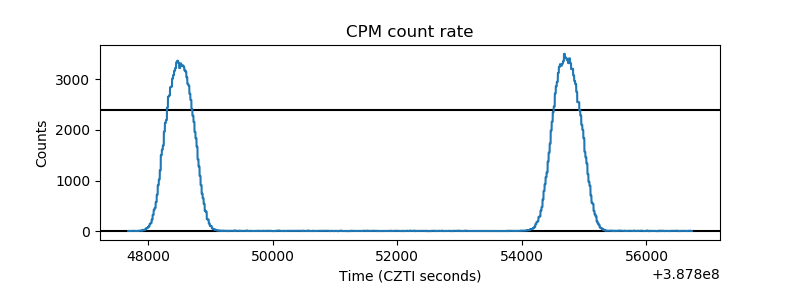 |
| CZT Counter | 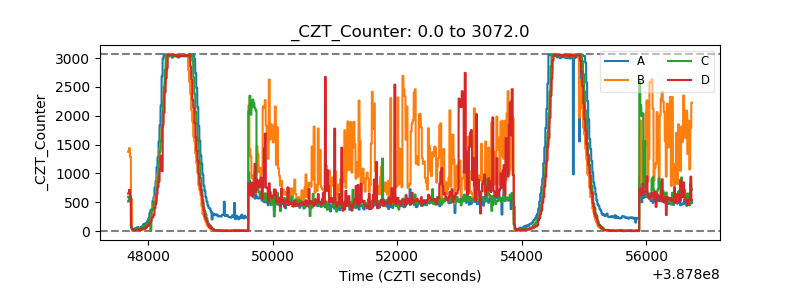 |
| +2.5 Volts monitor | 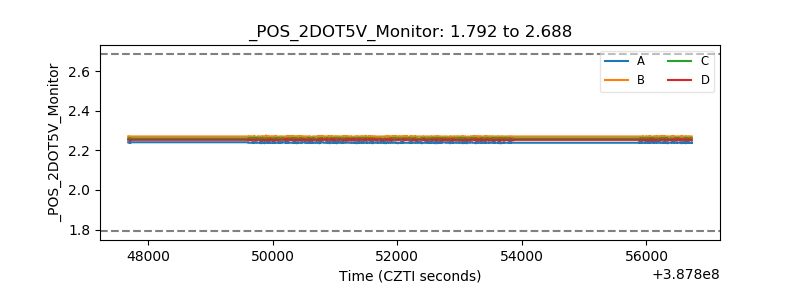 |
| +5 Volts monitor | 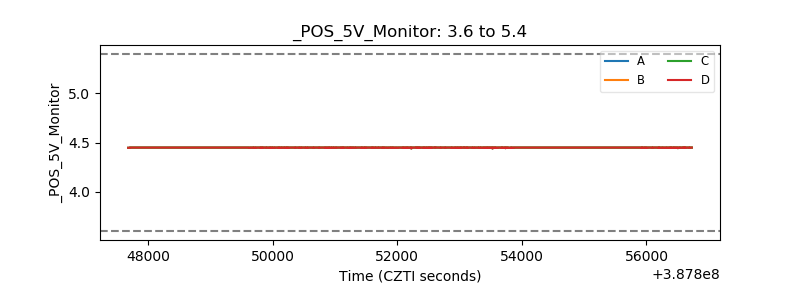 |
| _ROLL_ROT | 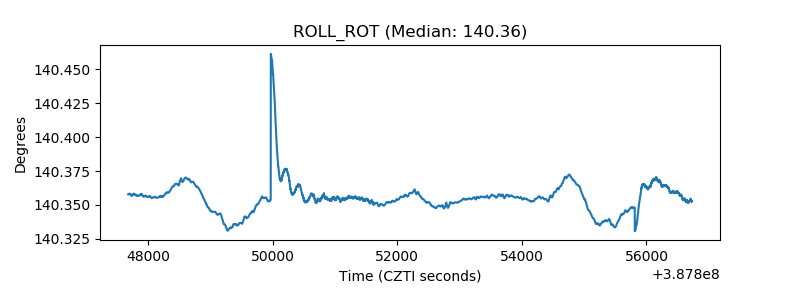 |
| _Roll_DEC | 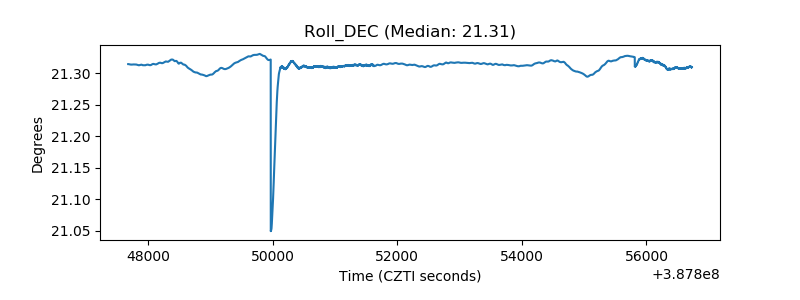 |
| _Roll_RA | 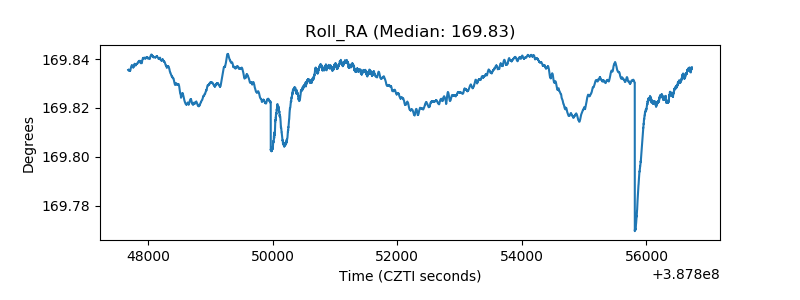 |
| Veto Counter | 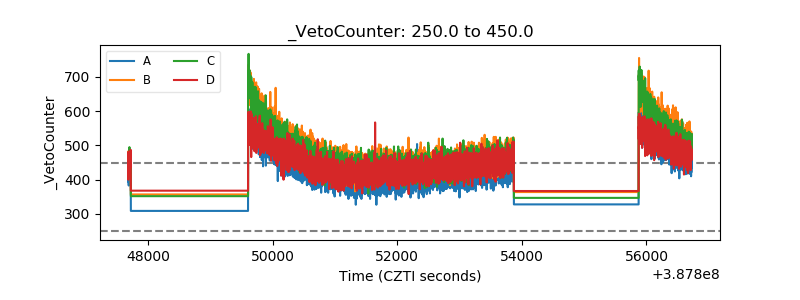 |