| Param | Original file | Final file |
|---|---|---|
| Filename | modeM0/AS1A11_097T07_9000005072_35419cztM0_level2.evt | modeM0/AS1A11_097T07_9000005072_35419cztM0_level2_quad_clean.evt |
| Size (bytes) | 257,820,480 | 33,091,200 |
| Size | 245.9 MB | 31.6 MB |
| Events in quadrant A | 1,437,300 | 208,390 |
| Events in quadrant B | 2,697,559 | 201,527 |
| Events in quadrant C | 1,678,963 | 198,766 |
| Events in quadrant D | 1,803,184 | 193,068 |
| Mode M0 | |||
|---|---|---|---|
| Quadrant | BADHDUFLAG | Total packets | Discarded packets |
| A | 0 | 5853 | 2 |
| B | 0 | 9981 | 1 |
| C | 0 | 6502 | 1 |
| D | 0 | 7151 | 1 |
| Mode M9 | |||
|---|---|---|---|
| Quadrant | BADHDUFLAG | Total packets | Discarded packets |
| A | 0 | 18 | 0 |
| B | 0 | 18 | 0 |
| C | 0 | 18 | 0 |
| D | 0 | 18 | 0 |
| Mode SS | |||
|---|---|---|---|
| Quadrant | BADHDUFLAG | Total packets | Discarded packets |
| A | 0 | 60 | 0 |
| B | 0 | 60 | 0 |
| C | 0 | 60 | 0 |
| D | 0 | 60 | 0 |
| Quadrant | Total seconds | Saturated seconds | Saturation percentage |
|---|---|---|---|
| A | 2786 | 5 | 0.179469% |
| B | 2786 | 219 | 7.860732% |
| C | 2786 | 97 | 3.481694% |
| D | 2786 | 34 | 1.220388% |
Noise dominated data is calculated using 1-second bins in cleaned event files. If a bin has >2000 counts, and if more than 50% of those come from <1% of pixels, then it is considered to be noise-dominated and hence unusable.
| Quadrant | # 1 sec bins | Bins with >0 counts | Bins with >2000 counts | High rate bins dominated by noise | Noise dominated (total time) | Noise dominated (detector-on time) | Marked lightcurve |
|---|---|---|---|---|---|---|---|
| A | 4668 | 2787 | 0 | 0 | 0.00% | 0.00% | 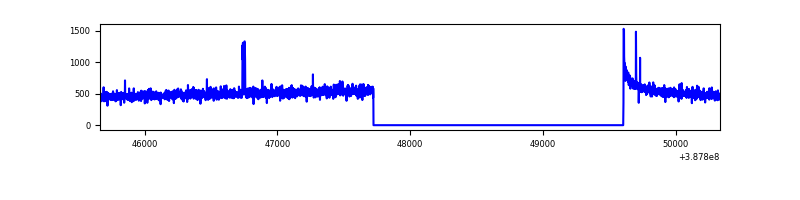 |
| B | 4668 | 2787 | 116 | 116 | 2.49% | 4.16% | 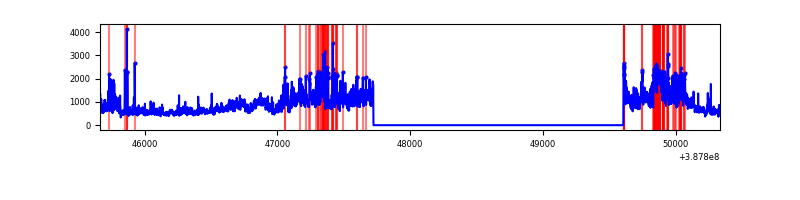 |
| C | 4668 | 2787 | 64 | 64 | 1.37% | 2.30% | 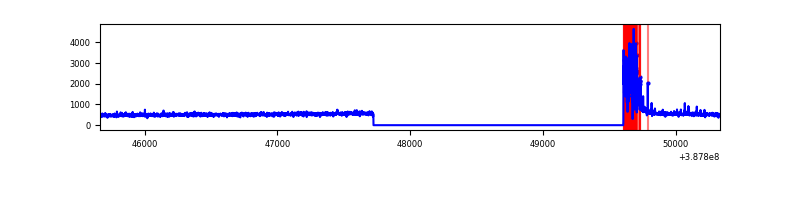 |
| D | 4668 | 2787 | 33 | 33 | 0.71% | 1.18% | 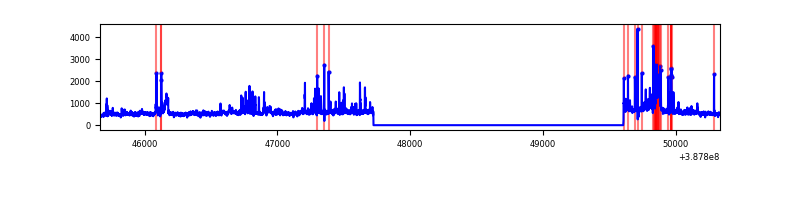 |
Top three noisy pixels from each quadrant. If the there are fewer than three noisy pixels in the level2.evt file, extra rows are filled as -1
| Pixel properties | Quadrant properties | ||||||
|---|---|---|---|---|---|---|---|
| Quadrant | DetID | PixID | Counts | Sigma | Mean | Median | Sigma |
| A | 10 | 83 | 61917 | 862.36 | 350 | 343 | 71.4 |
| A | 5 | 168 | 11931 | 162.29 | 350 | 343 | 71.4 |
| A | 13 | 6 | 8673 | 116.66 | 350 | 343 | 71.4 |
| B | 4 | 251 | 670483 | 9924.6 | 343 | 333 | 67.5 |
| B | 5 | 236 | 443095 | 6557.1 | 343 | 333 | 67.5 |
| B | 5 | 172 | 128806 | 1902.62 | 343 | 333 | 67.5 |
| C | 0 | 10 | 248661 | 3130.96 | 334 | 336 | 79.3 |
| C | 15 | 214 | 111980 | 1407.64 | 334 | 336 | 79.3 |
| C | 3 | 233 | 10637 | 129.88 | 334 | 336 | 79.3 |
| D | 8 | 195 | 146478 | 1780.38 | 337 | 330 | 82.1 |
| D | 7 | 80 | 135319 | 1644.44 | 337 | 330 | 82.1 |
| D | 7 | 223 | 79717 | 967.09 | 337 | 330 | 82.1 |
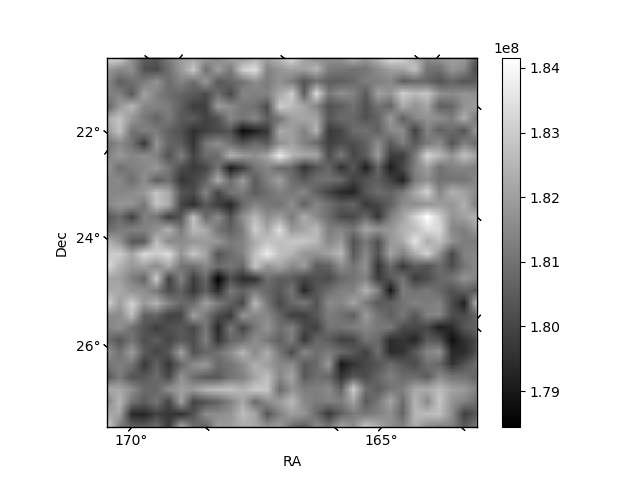
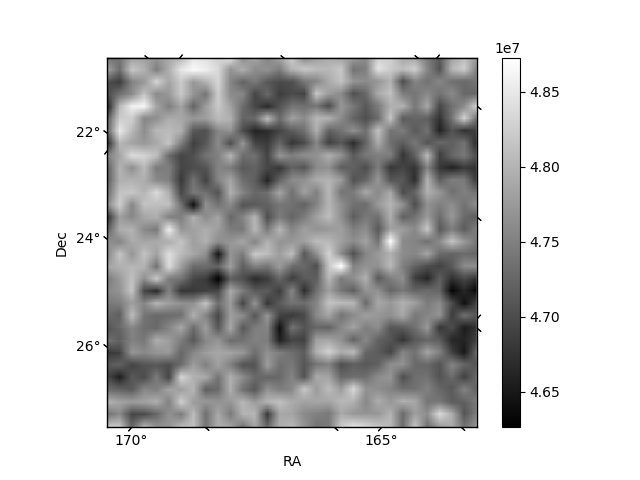
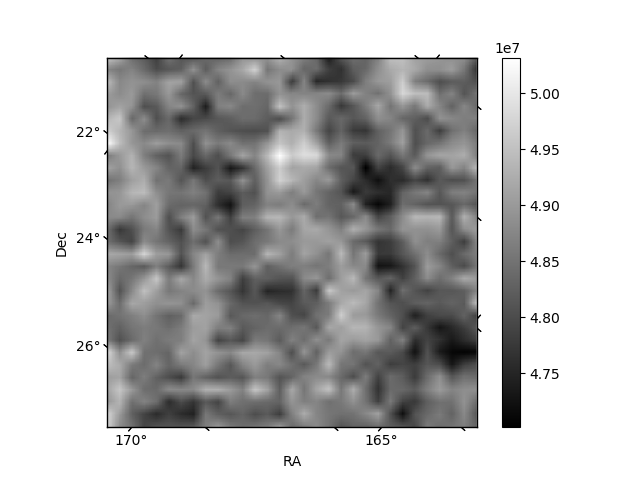
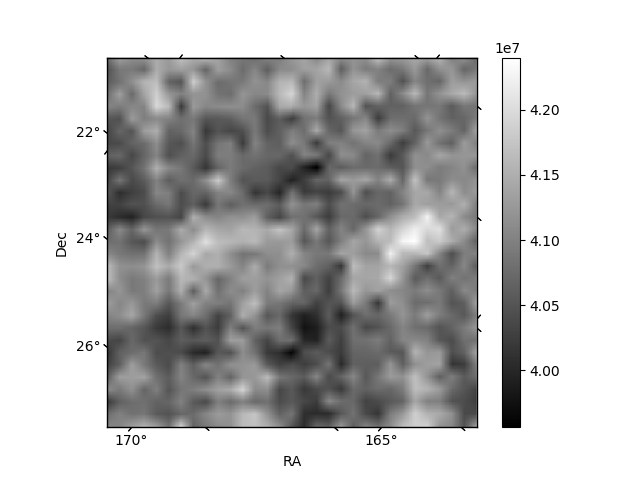
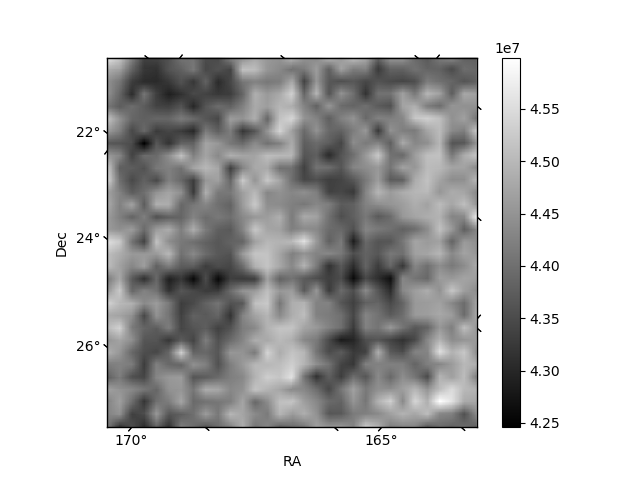
Histogram calculated using DETX and DETY for each event in the final _common_clean file
| Quadrant A | 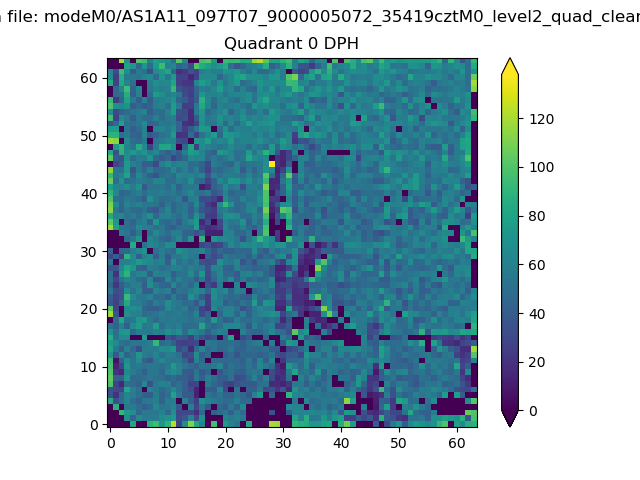 |
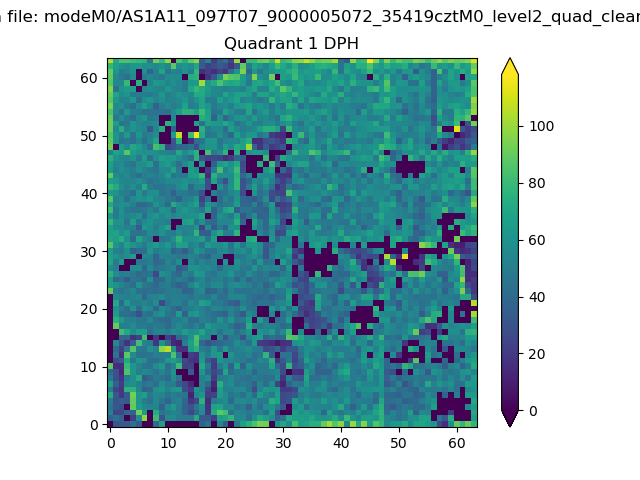 |
Quadrant B |
|---|---|---|---|
| Quadrant D | 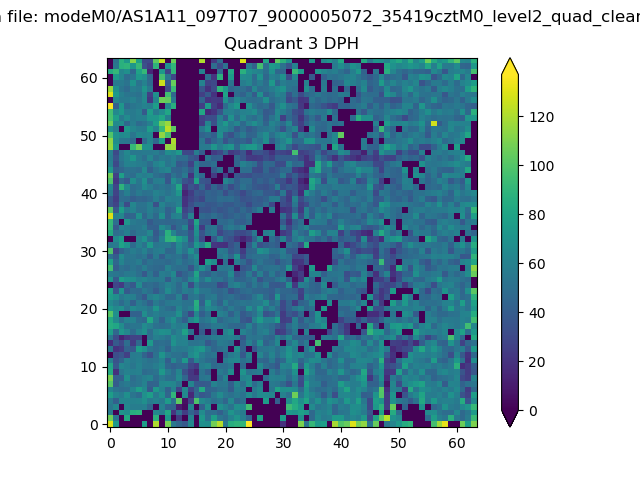 |
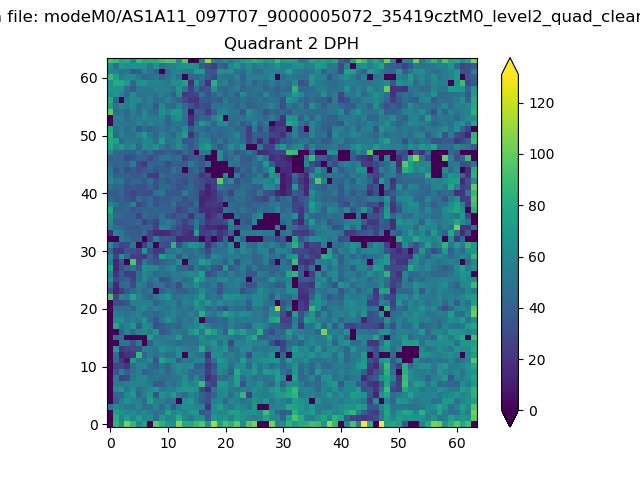 |
Quadrant C |
| Plot type | Count rate plots | Images |
|---|---|---|
| Comparison with Poisson distribution Blue bars denote a histogram of data divided into 1 sec bins. Red curve is a Poisson curve with rate = median count rate of data. |
 |
 |
| Quadrant-wise count rates Data is divided into 100 sec bins |
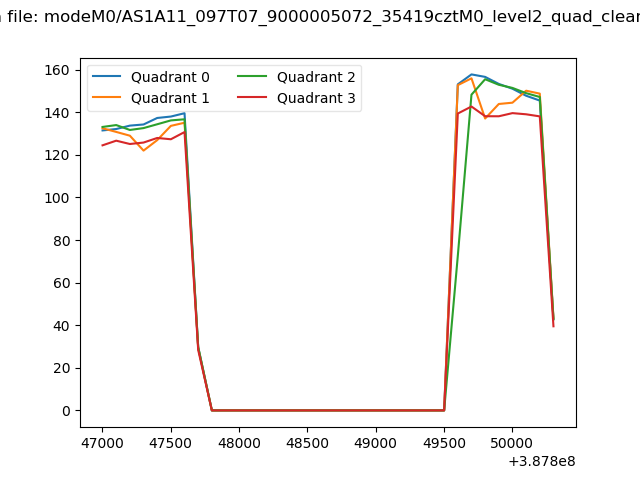 |
|
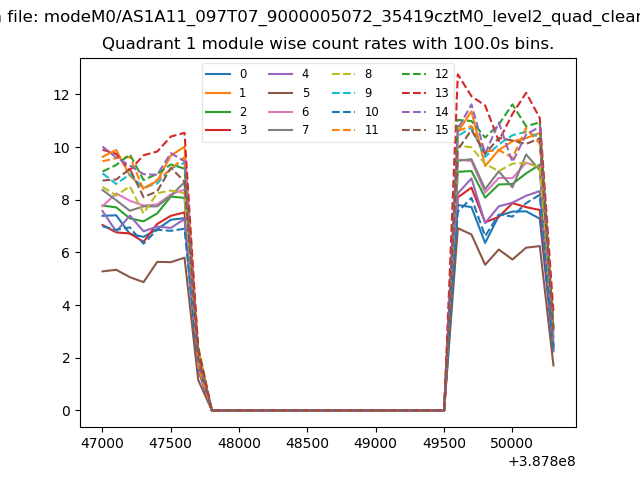
| Module-wise count rates for Quadrant A Data is divided into 100 sec bins |
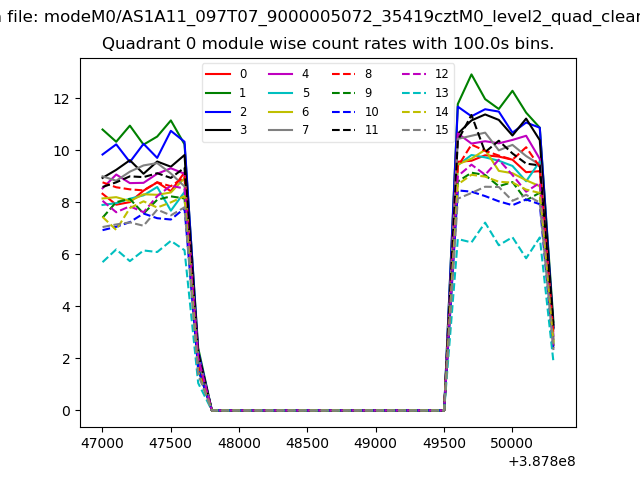 |
 |
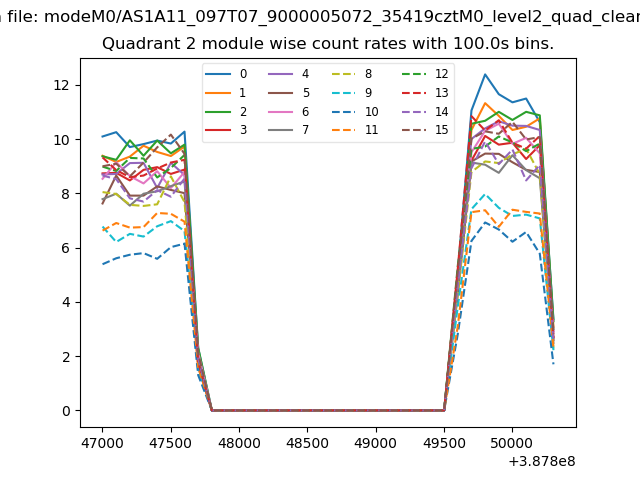
| Module-wise count rates for Quadrant B Data is divided into 100 sec bins |
 |
 |
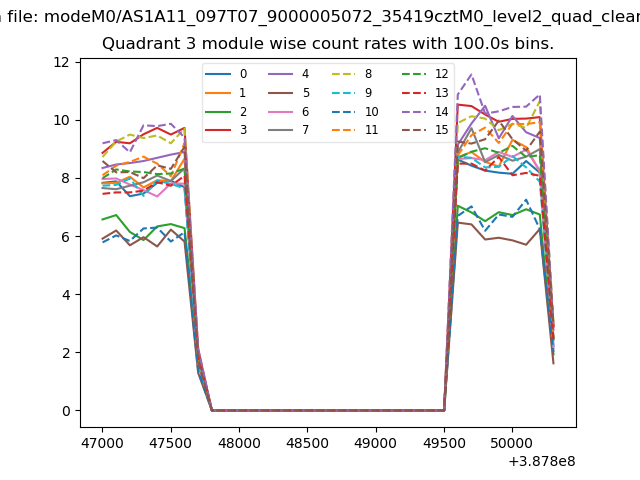
| Module-wise count rates for Quadrant C Data is divided into 100 sec bins |
 |
 |
| Module-wise count rates for Quadrant D Data is divided into 100 sec bins |
 |
 |
| Parameter | Plot |
|---|---|
| CZT HV Monitor | 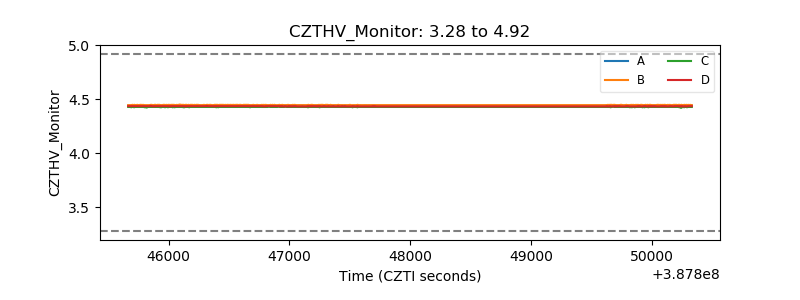 |
| D_VDD | 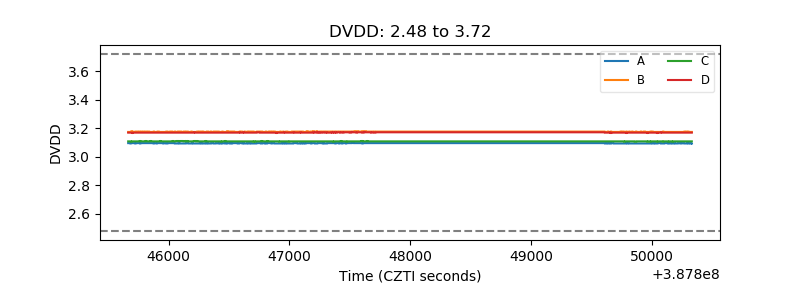 |
| Temperature 1 | 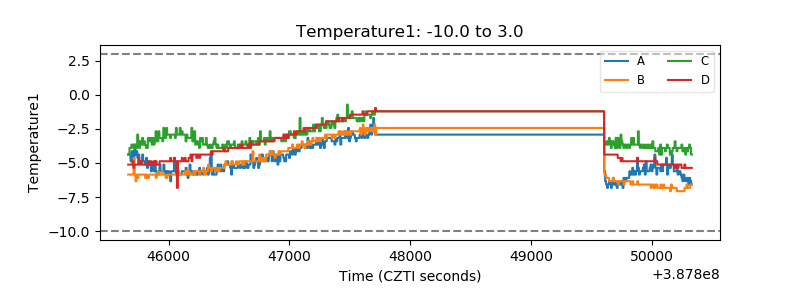 |
| Veto HV Monitor | 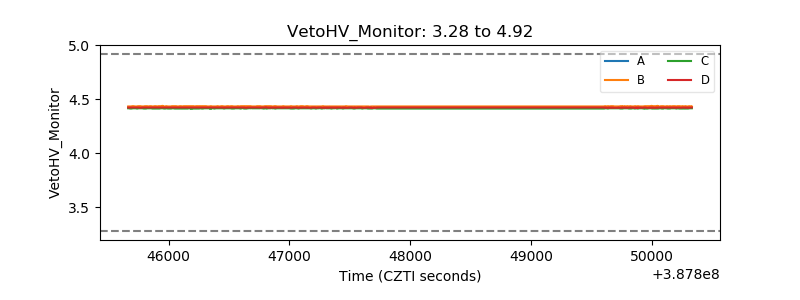 |
| Veto LLD | 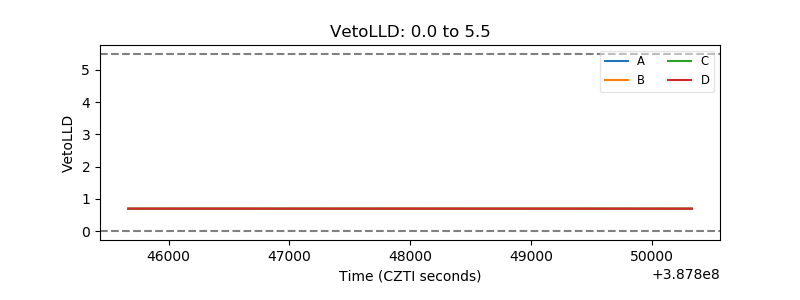 |
| Alpha Counter | 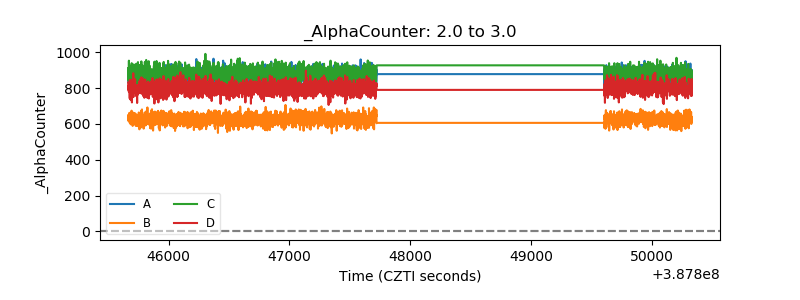 |
| _CPM_Rate | 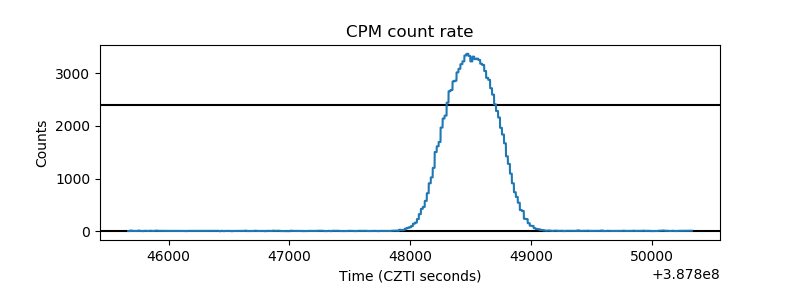 |
| CZT Counter | 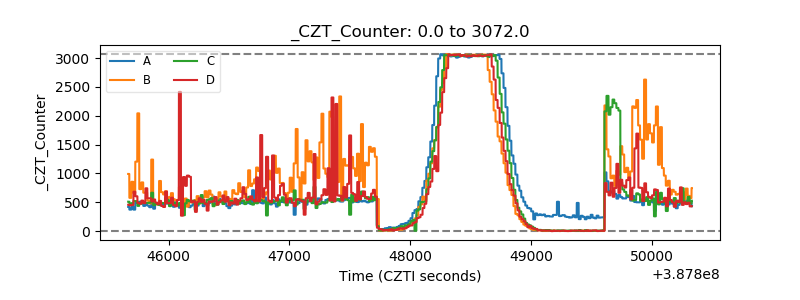 |
| +2.5 Volts monitor | 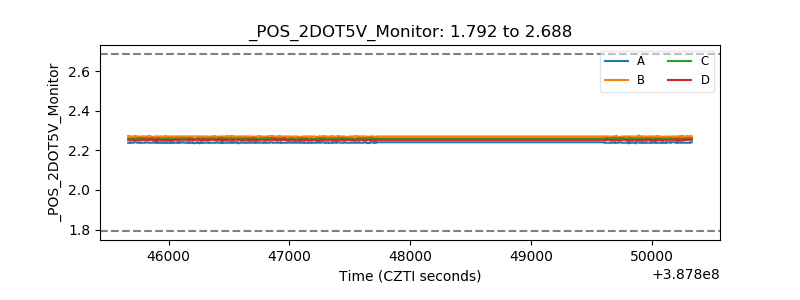 |
| +5 Volts monitor | 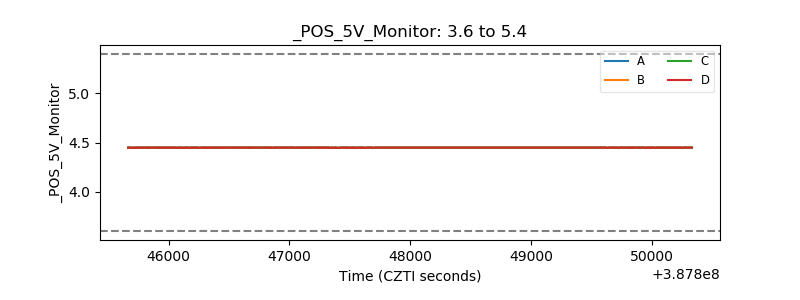 |
| _ROLL_ROT | 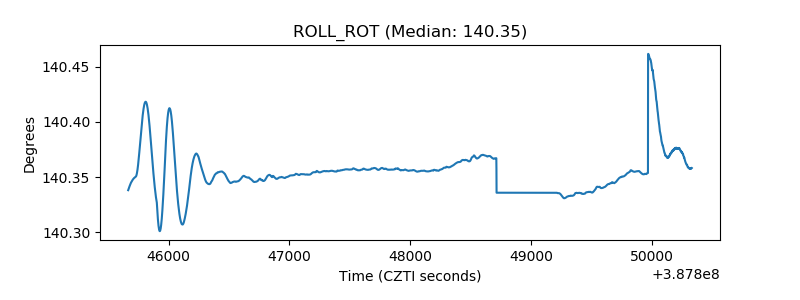 |
| _Roll_DEC | 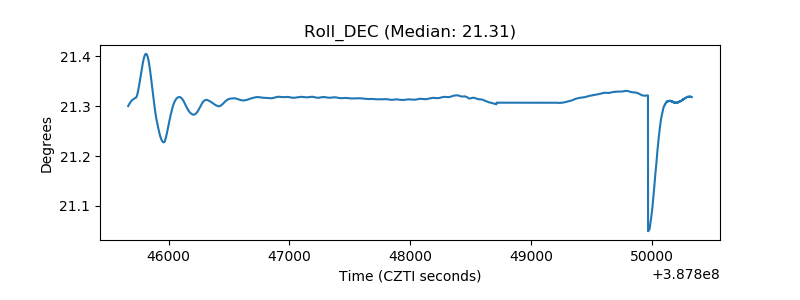 |
| _Roll_RA | 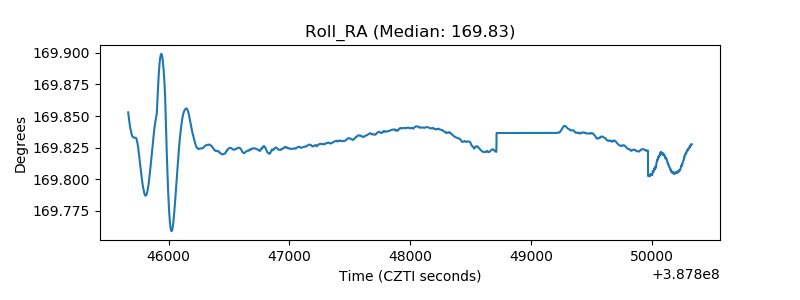 |
| Veto Counter | 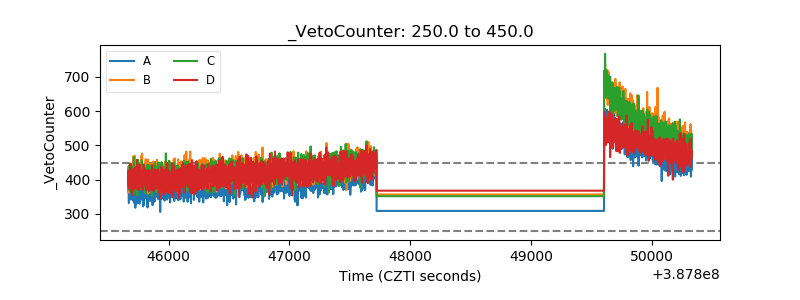 |