| Param | Original file | Final file |
|---|---|---|
| Filename | modeM0/AS1T05_022T01_9000005070_35415cztM0_level2.evt | modeM0/AS1T05_022T01_9000005070_35415cztM0_level2_quad_clean.evt |
| Size (bytes) | 1,874,784,960 | 208,085,760 |
| Size | 1.7 GB | 198.4 MB |
| Events in quadrant A | 7,392,867 | 1,425,332 |
| Events in quadrant B | 28,128,577 | 1,046,053 |
| Events in quadrant C | 8,499,428 | 1,415,811 |
| Events in quadrant D | 11,703,177 | 1,331,914 |
| Mode M0 | |||
|---|---|---|---|
| Quadrant | BADHDUFLAG | Total packets | Discarded packets |
| A | 0 | 32122 | 5 |
| B | 0 | 94240 | 4 |
| C | 0 | 34632 | 4 |
| D | 0 | 45167 | 4 |
| Mode SS | |||
|---|---|---|---|
| Quadrant | BADHDUFLAG | Total packets | Discarded packets |
| A | 0 | 320 | 0 |
| B | 0 | 320 | 0 |
| C | 0 | 320 | 0 |
| D | 0 | 320 | 0 |
| Mode M9 | |||
|---|---|---|---|
| Quadrant | BADHDUFLAG | Total packets | Discarded packets |
| A | 0 | 51 | 0 |
| B | 0 | 51 | 0 |
| C | 0 | 51 | 0 |
| D | 0 | 52 | 0 |
| Quadrant | Total seconds | Saturated seconds | Saturation percentage |
|---|---|---|---|
| A | 15661 | 25 | 0.159632% |
| B | 15661 | 8990 | 57.403742% |
| C | 15661 | 202 | 1.289828% |
| D | 15661 | 653 | 4.169593% |
Noise dominated data is calculated using 1-second bins in cleaned event files. If a bin has >2000 counts, and if more than 50% of those come from <1% of pixels, then it is considered to be noise-dominated and hence unusable.
| Quadrant | # 1 sec bins | Bins with >0 counts | Bins with >2000 counts | High rate bins dominated by noise | Noise dominated (total time) | Noise dominated (detector-on time) | Marked lightcurve |
|---|---|---|---|---|---|---|---|
| A | 19840 | 15664 | 0 | 0 | 0.00% | 0.00% | 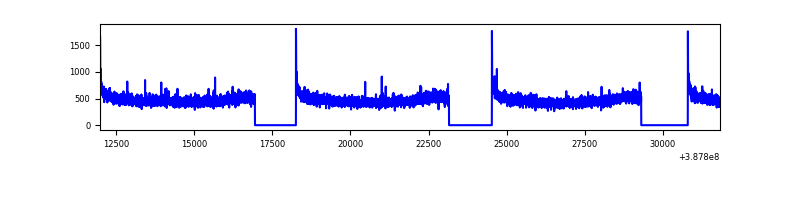 |
| B | 19840 | 15664 | 7756 | 7756 | 39.09% | 49.51% | 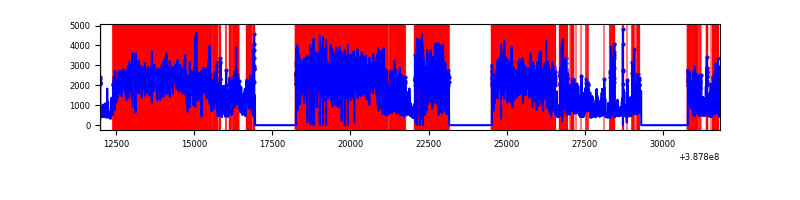 |
| C | 19840 | 15664 | 133 | 133 | 0.67% | 0.85% | 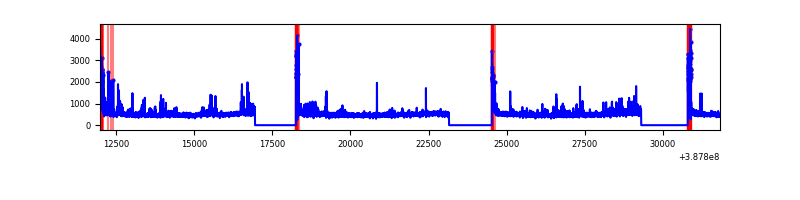 |
| D | 19840 | 15664 | 460 | 460 | 2.32% | 2.94% | 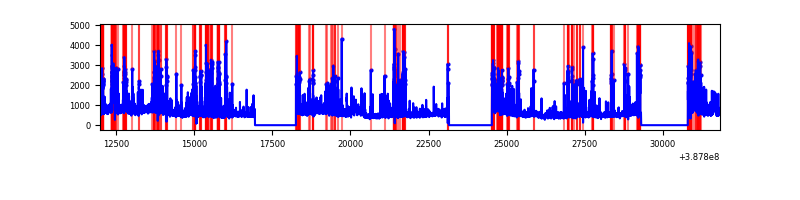 |
Top three noisy pixels from each quadrant. If the there are fewer than three noisy pixels in the level2.evt file, extra rows are filled as -1
| Pixel properties | Quadrant properties | ||||||
|---|---|---|---|---|---|---|---|
| Quadrant | DetID | PixID | Counts | Sigma | Mean | Median | Sigma |
| A | 10 | 83 | 314033 | 860.81 | 1814 | 1776 | 362.7 |
| A | 13 | 6 | 45734 | 121.18 | 1814 | 1776 | 362.7 |
| A | 13 | 254 | 25352 | 64.99 | 1814 | 1776 | 362.7 |
| B | 5 | 236 | 5118715 | 20694.22 | 1288 | 1253 | 247.3 |
| B | 4 | 251 | 4596424 | 18582.16 | 1288 | 1253 | 247.3 |
| B | 5 | 31 | 4072697 | 16464.29 | 1288 | 1253 | 247.3 |
| C | 15 | 214 | 631357 | 1538.28 | 1766 | 1778 | 409.3 |
| C | 0 | 10 | 579059 | 1410.5 | 1766 | 1778 | 409.3 |
| C | 0 | 207 | 336401 | 817.6 | 1766 | 1778 | 409.3 |
| D | 7 | 80 | 1160040 | 2733.05 | 1739 | 1692 | 423.8 |
| D | 8 | 195 | 1123274 | 2646.3 | 1739 | 1692 | 423.8 |
| D | 13 | 249 | 619040 | 1456.59 | 1739 | 1692 | 423.8 |
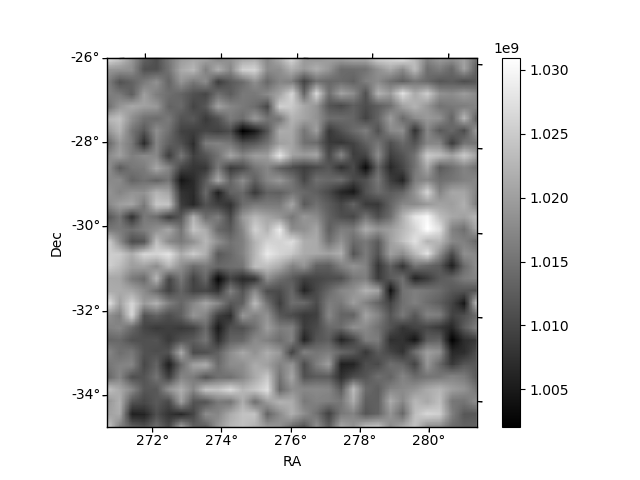
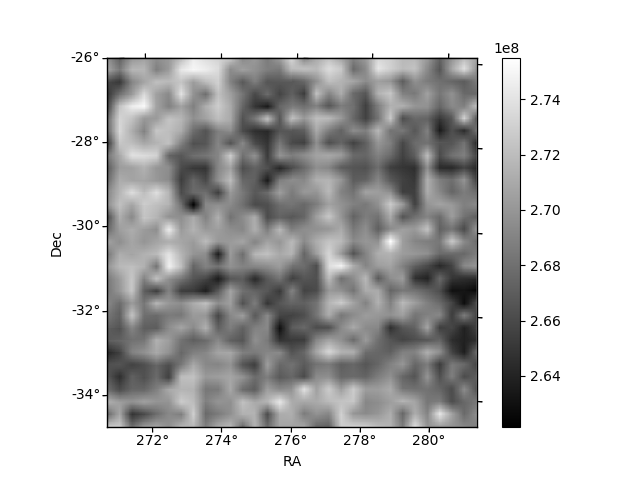
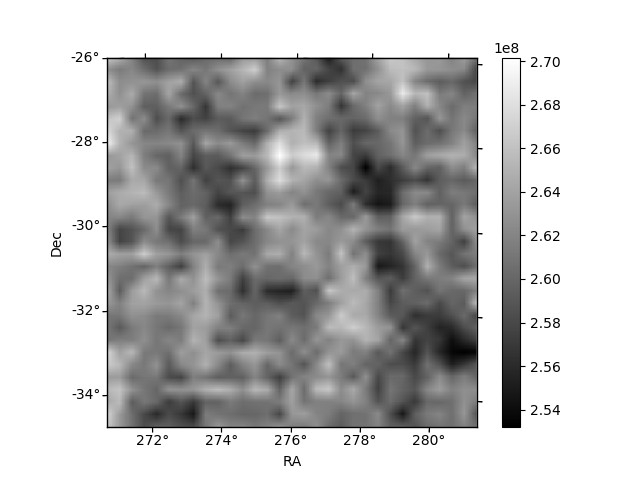
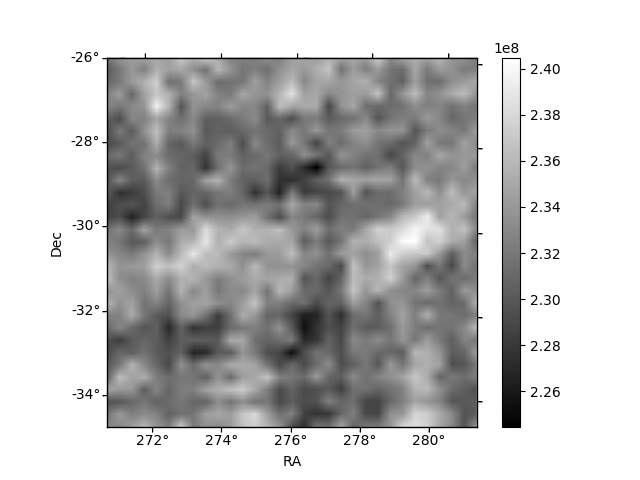
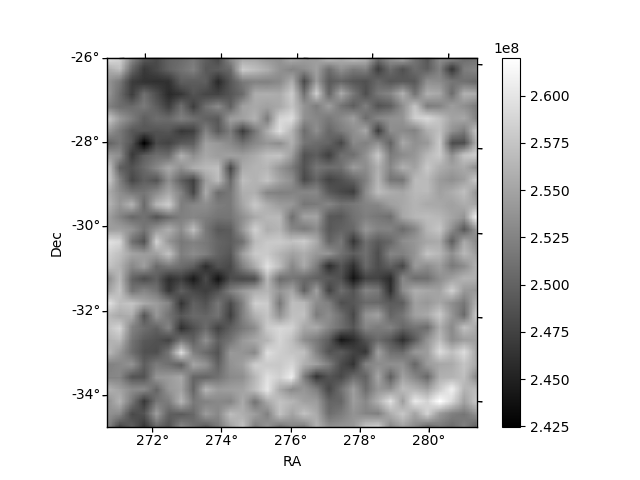
Histogram calculated using DETX and DETY for each event in the final _common_clean file
| Quadrant A | 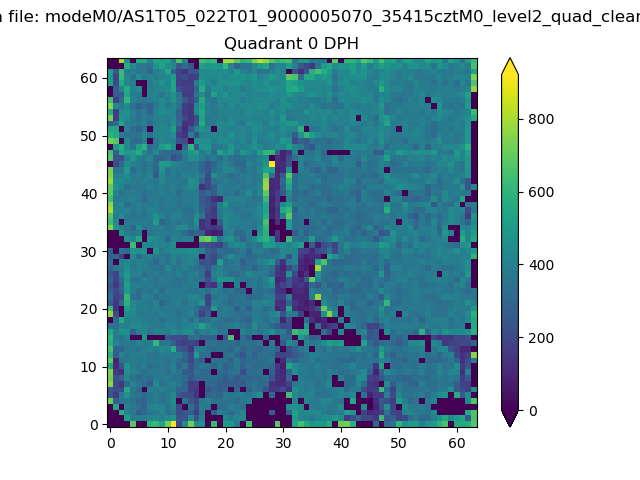 |
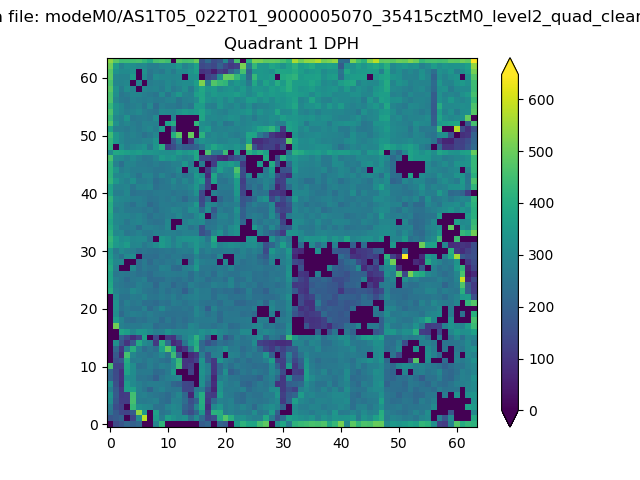 |
Quadrant B |
|---|---|---|---|
| Quadrant D | 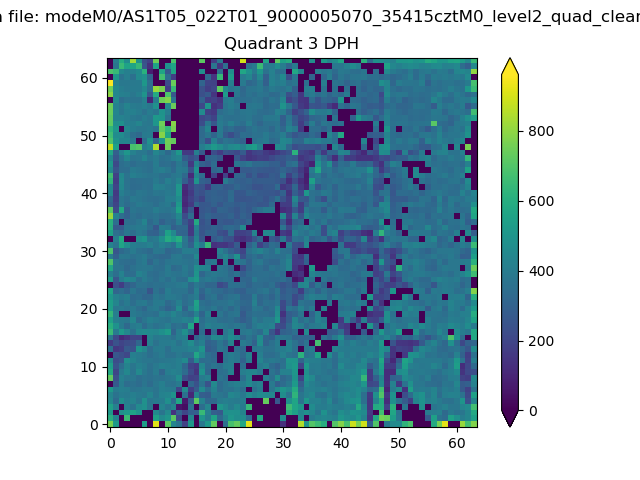 |
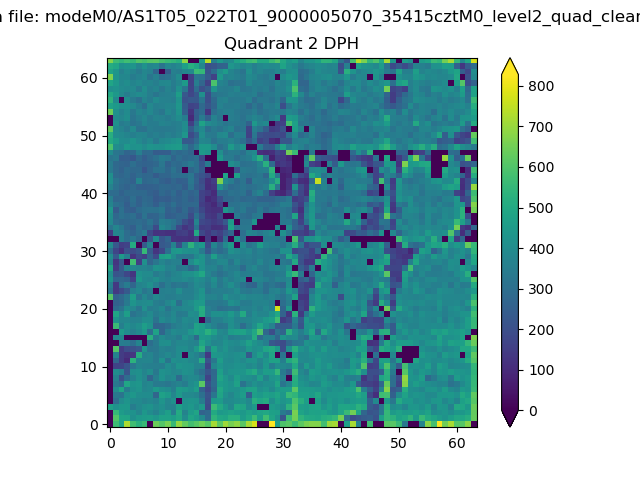 |
Quadrant C |
| Plot type | Count rate plots | Images |
|---|---|---|
| Comparison with Poisson distribution Blue bars denote a histogram of data divided into 1 sec bins. Red curve is a Poisson curve with rate = median count rate of data. |
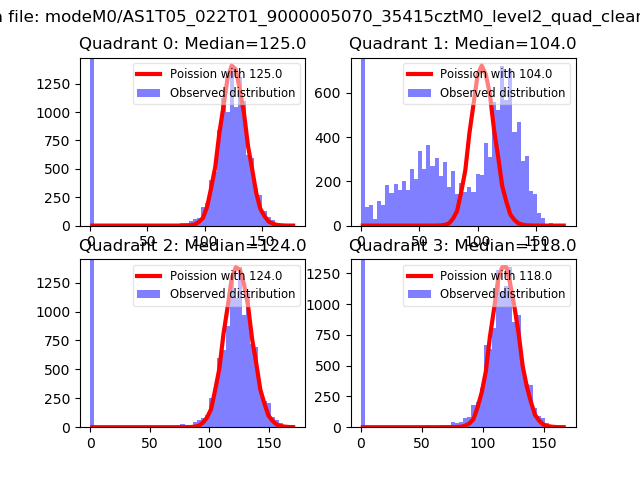 |
 |
| Quadrant-wise count rates Data is divided into 100 sec bins |
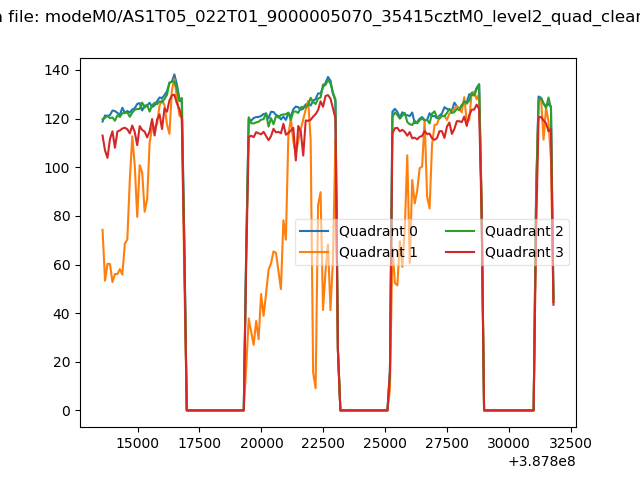 |
|
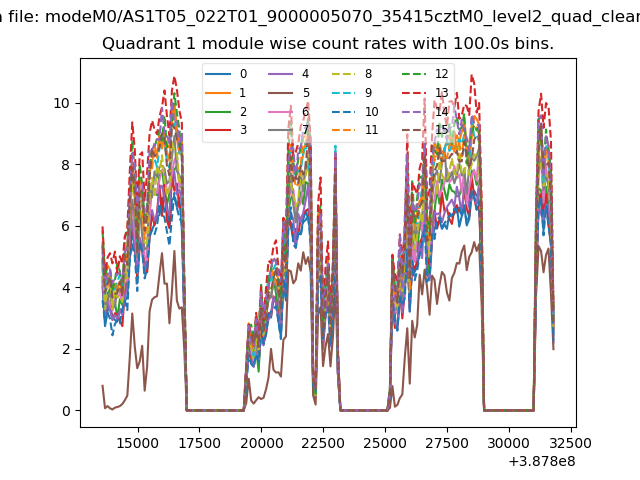
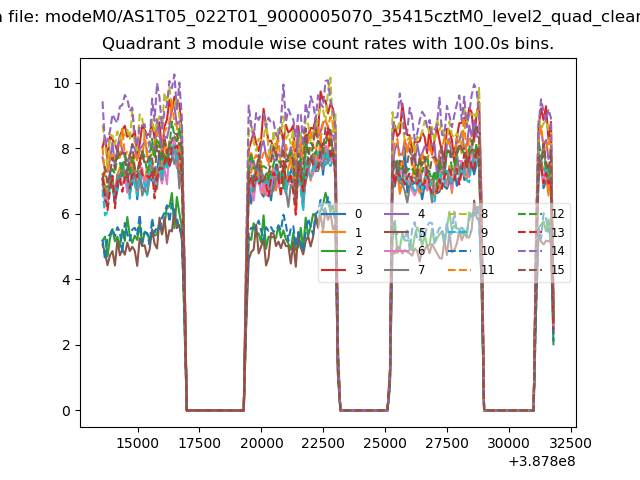
| Module-wise count rates for Quadrant A Data is divided into 100 sec bins |
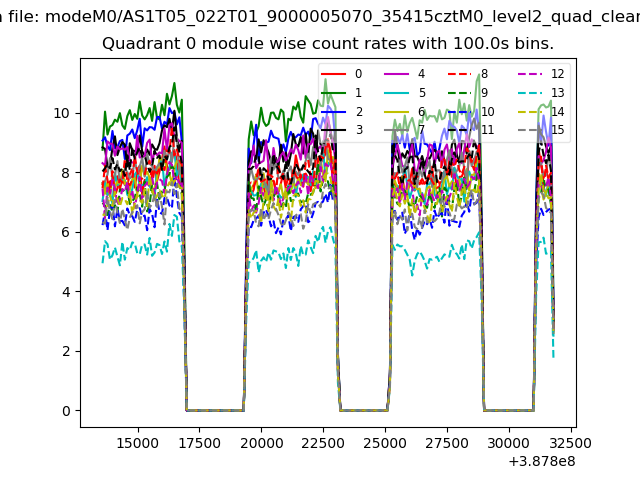 |
 |
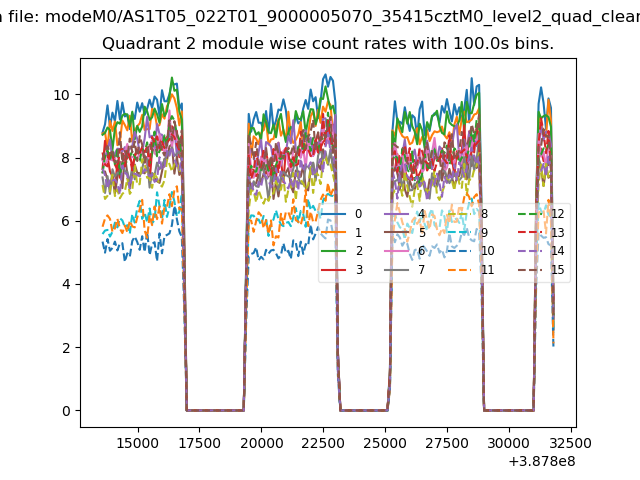
| Module-wise count rates for Quadrant B Data is divided into 100 sec bins |
 |
 |
| Module-wise count rates for Quadrant C Data is divided into 100 sec bins |
 |
 |
| Module-wise count rates for Quadrant D Data is divided into 100 sec bins |
 |
 |
| Parameter | Plot |
|---|---|
| CZT HV Monitor | 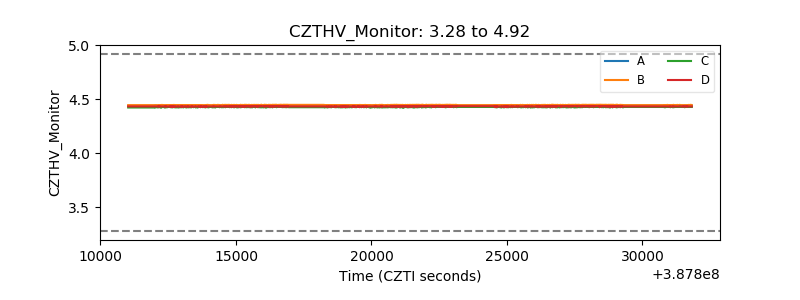 |
| D_VDD | 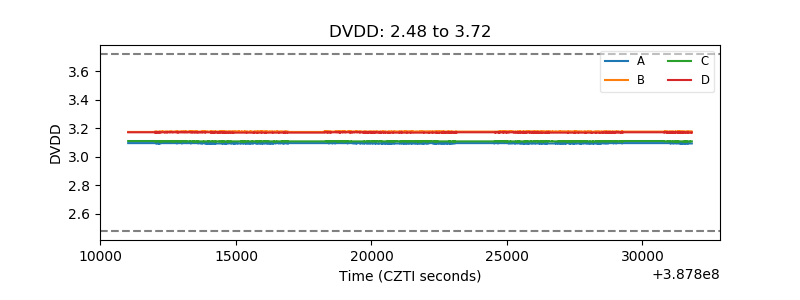 |
| Temperature 1 | 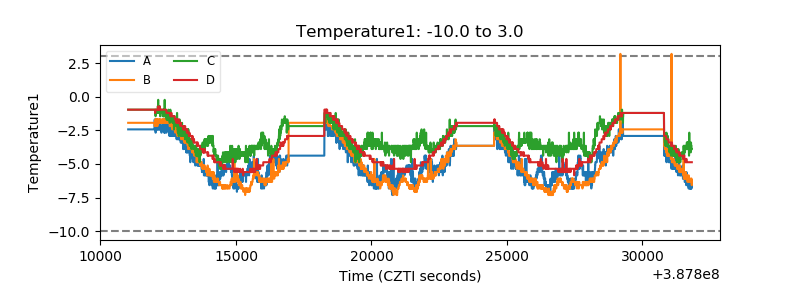 |
| Veto HV Monitor | 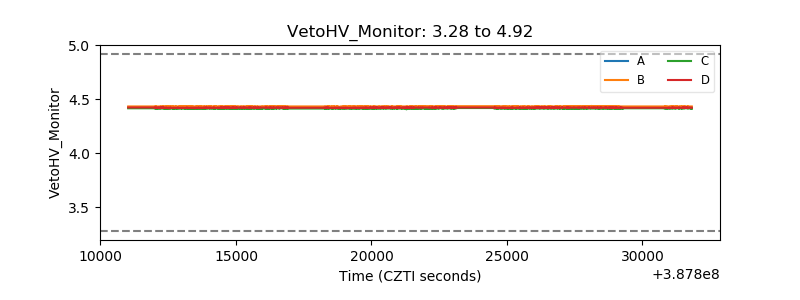 |
| Veto LLD | 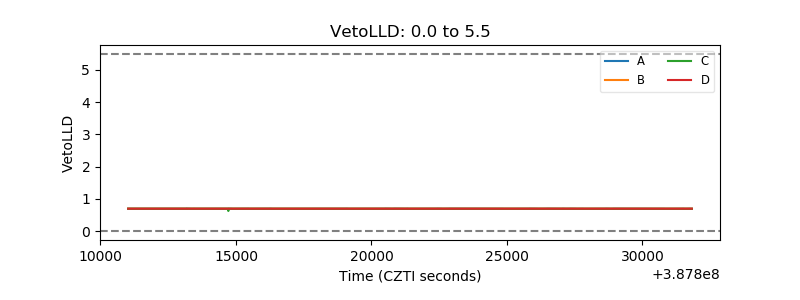 |
| Alpha Counter | 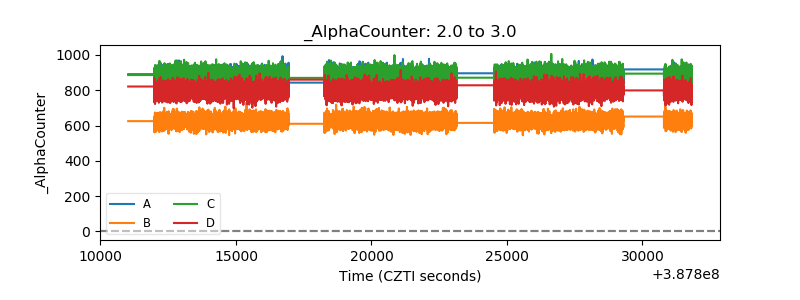 |
| _CPM_Rate | 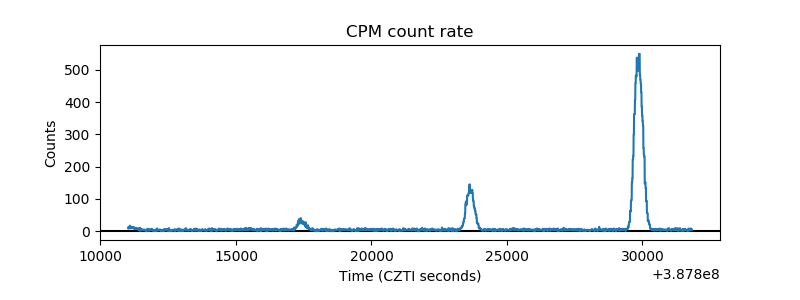 |
| CZT Counter | 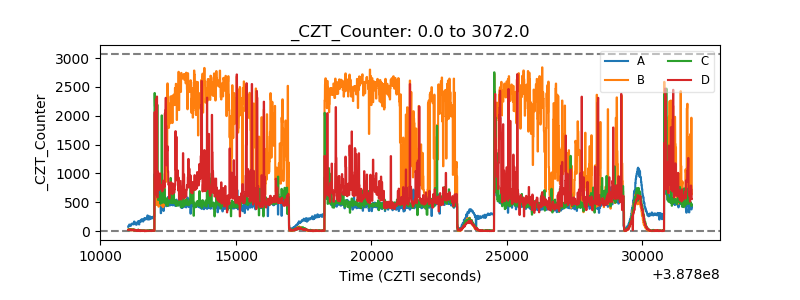 |
| +2.5 Volts monitor | 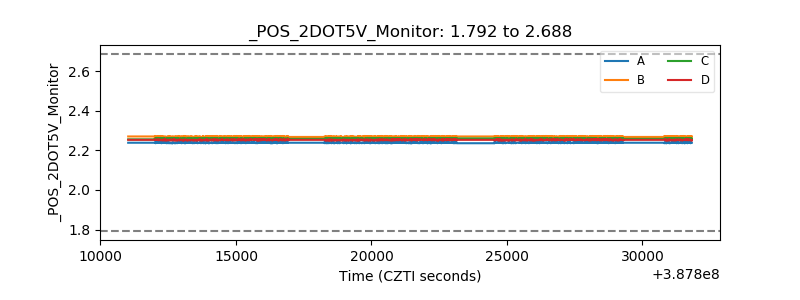 |
| +5 Volts monitor | 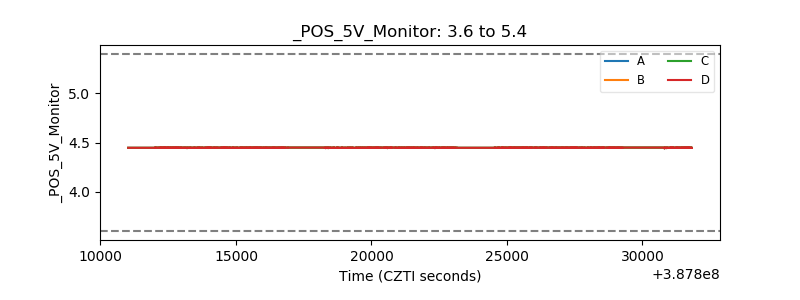 |
| _ROLL_ROT | 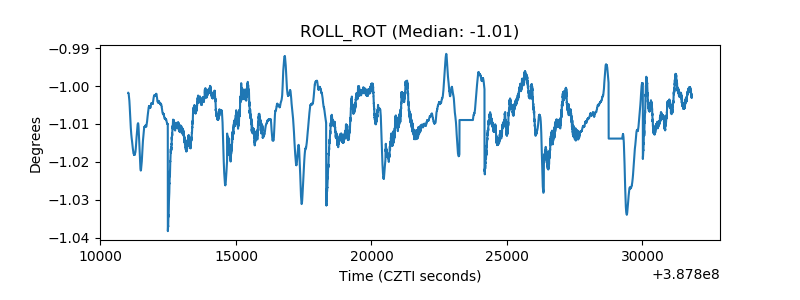 |
| _Roll_DEC | 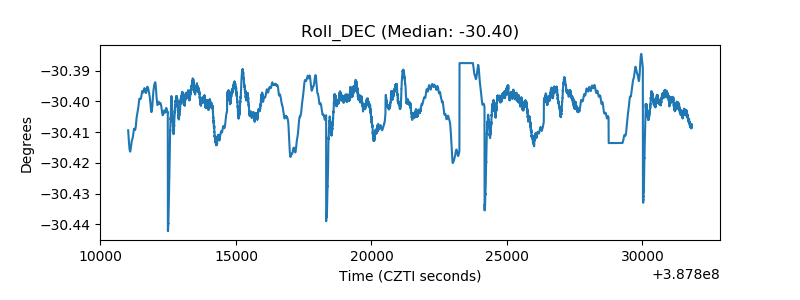 |
| _Roll_RA | 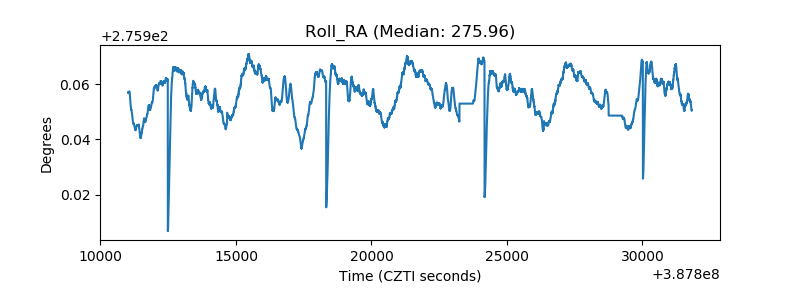 |
| Veto Counter | 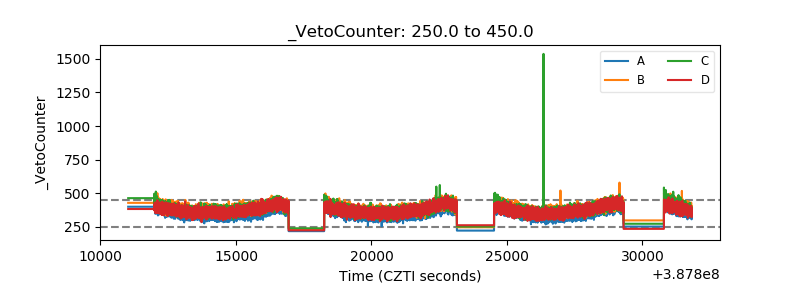 |