| Param | Original file | Final file |
|---|---|---|
| Filename | modeM0/AS1T05_022T01_9000005070_35412cztM0_level2.evt | modeM0/AS1T05_022T01_9000005070_35412cztM0_level2_quad_clean.evt |
| Size (bytes) | 659,836,800 | 61,960,320 |
| Size | 629.3 MB | 59.1 MB |
| Events in quadrant A | 2,876,840 | 373,258 |
| Events in quadrant B | 8,105,081 | 361,983 |
| Events in quadrant C | 3,687,327 | 369,032 |
| Events in quadrant D | 4,906,523 | 350,832 |
| Mode M0 | |||
|---|---|---|---|
| Quadrant | BADHDUFLAG | Total packets | Discarded packets |
| A | 0 | 12392 | 3 |
| B | 0 | 28077 | 2 |
| C | 0 | 14575 | 2 |
| D | 0 | 18708 | 2 |
| Mode SS | |||
|---|---|---|---|
| Quadrant | BADHDUFLAG | Total packets | Discarded packets |
| A | 0 | 124 | 0 |
| B | 0 | 124 | 0 |
| C | 0 | 124 | 0 |
| D | 0 | 124 | 0 |
| Mode M9 | |||
|---|---|---|---|
| Quadrant | BADHDUFLAG | Total packets | Discarded packets |
| A | 0 | 21 | 0 |
| B | 0 | 21 | 0 |
| C | 0 | 21 | 0 |
| D | 0 | 22 | 0 |
| Quadrant | Total seconds | Saturated seconds | Saturation percentage |
|---|---|---|---|
| A | 6019 | 3 | 0.049842% |
| B | 6019 | 2116 | 35.155341% |
| C | 6019 | 125 | 2.076757% |
| D | 6019 | 273 | 4.535637% |
Noise dominated data is calculated using 1-second bins in cleaned event files. If a bin has >2000 counts, and if more than 50% of those come from <1% of pixels, then it is considered to be noise-dominated and hence unusable.
| Quadrant | # 1 sec bins | Bins with >0 counts | Bins with >2000 counts | High rate bins dominated by noise | Noise dominated (total time) | Noise dominated (detector-on time) | Marked lightcurve |
|---|---|---|---|---|---|---|---|
| A | 7332 | 6020 | 0 | 0 | 0.00% | 0.00% | 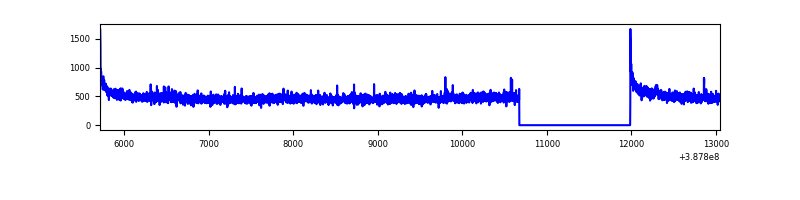 |
| B | 7332 | 6020 | 1812 | 1812 | 24.71% | 30.10% | 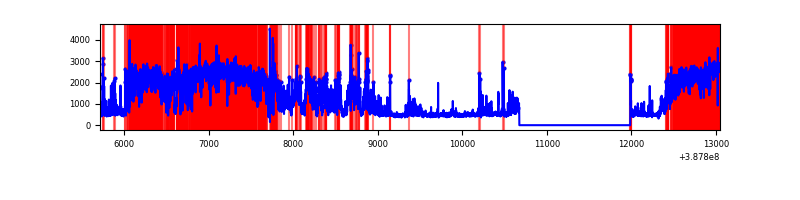 |
| C | 7332 | 6020 | 95 | 95 | 1.30% | 1.58% | 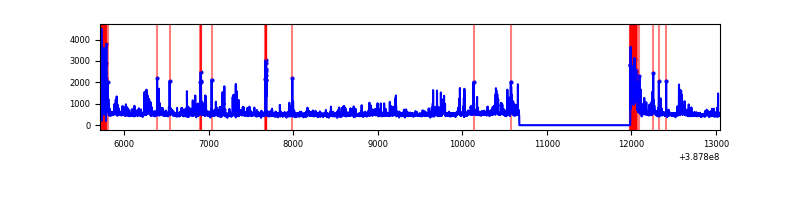 |
| D | 7332 | 6020 | 224 | 224 | 3.06% | 3.72% | 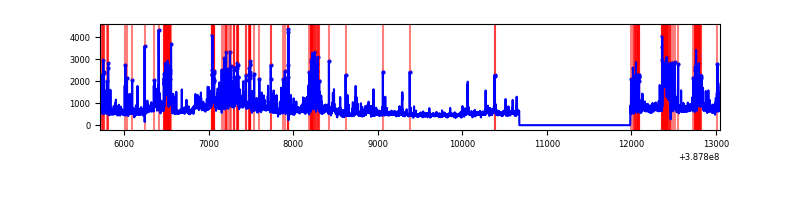 |
Top three noisy pixels from each quadrant. If the there are fewer than three noisy pixels in the level2.evt file, extra rows are filled as -1
| Pixel properties | Quadrant properties | ||||||
|---|---|---|---|---|---|---|---|
| Quadrant | DetID | PixID | Counts | Sigma | Mean | Median | Sigma |
| A | 10 | 83 | 140098 | 991.88 | 696 | 681 | 140.6 |
| A | 13 | 6 | 21471 | 147.91 | 696 | 681 | 140.6 |
| A | 15 | 169 | 14159 | 95.89 | 696 | 681 | 140.6 |
| B | 5 | 31 | 1675326 | 14330.79 | 606 | 591 | 116.9 |
| B | 5 | 15 | 1671640 | 14299.25 | 606 | 591 | 116.9 |
| B | 5 | 14 | 1643149 | 14055.45 | 606 | 591 | 116.9 |
| C | 0 | 207 | 337620 | 2143.98 | 675 | 679 | 157.2 |
| C | 0 | 10 | 297003 | 1885.53 | 675 | 679 | 157.2 |
| C | 15 | 214 | 245556 | 1558.17 | 675 | 679 | 157.2 |
| D | 7 | 80 | 601584 | 3624.03 | 669 | 649 | 165.8 |
| D | 8 | 195 | 558784 | 3365.92 | 669 | 649 | 165.8 |
| D | 12 | 233 | 237667 | 1429.37 | 669 | 649 | 165.8 |
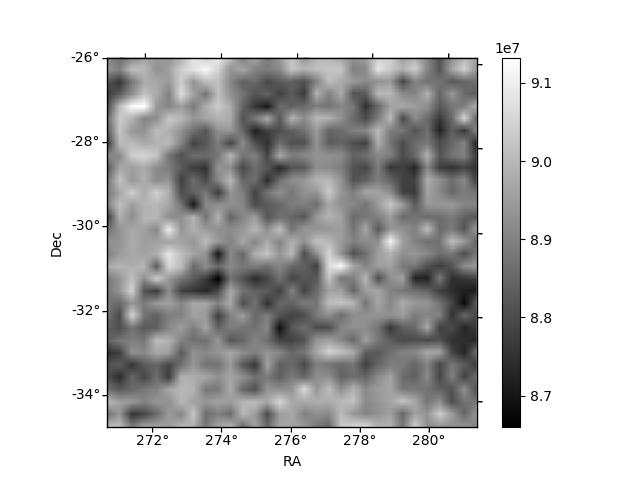
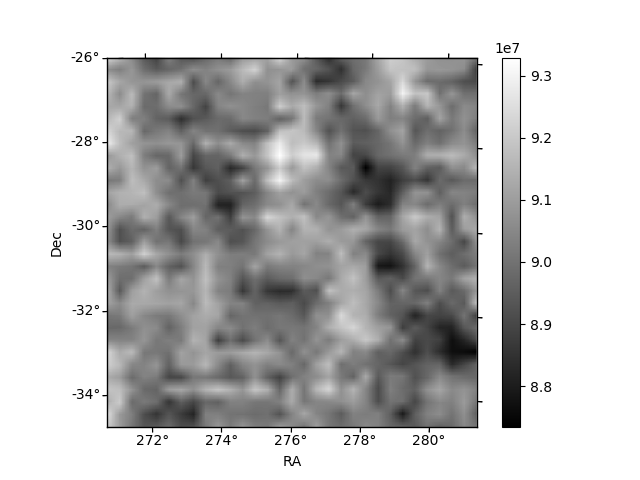
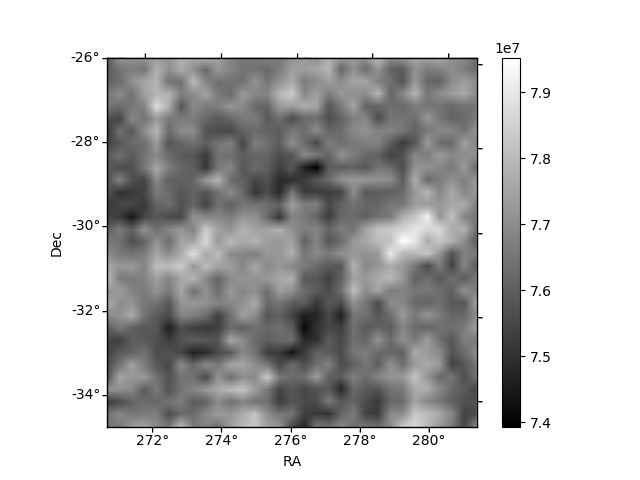
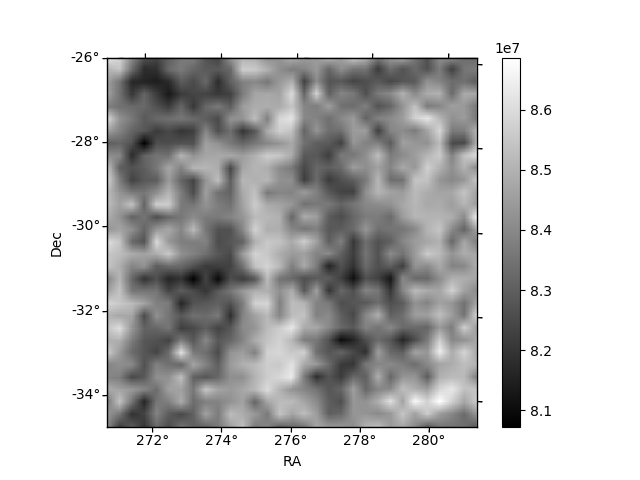
Histogram calculated using DETX and DETY for each event in the final _common_clean file
| Quadrant A | 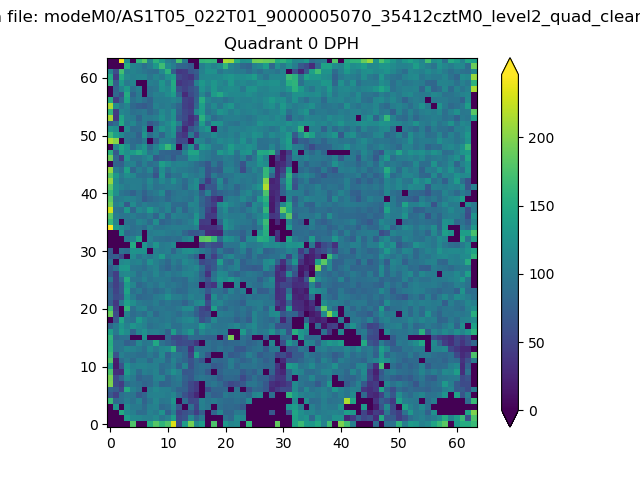 |
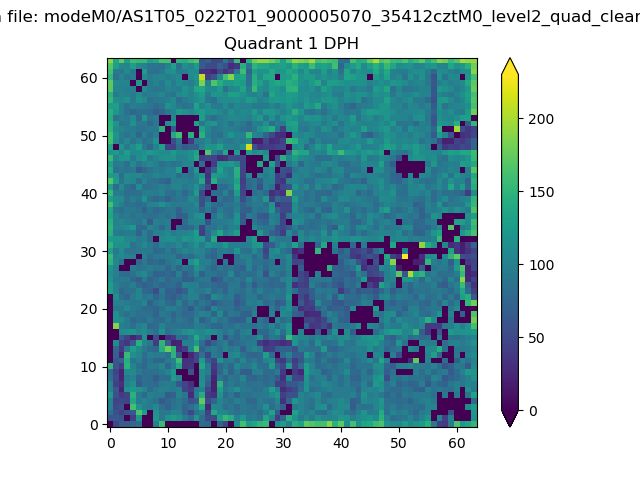 |
Quadrant B |
|---|---|---|---|
| Quadrant D | 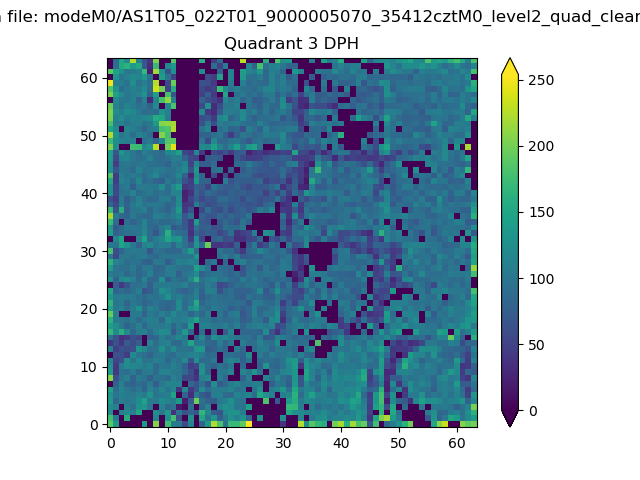 |
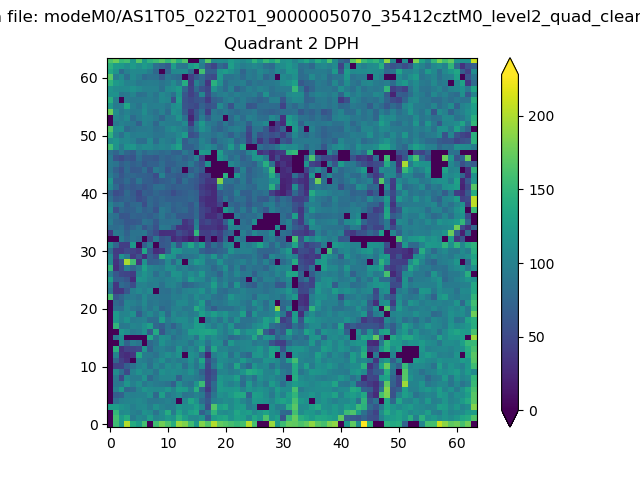 |
Quadrant C |
| Plot type | Count rate plots | Images |
|---|---|---|
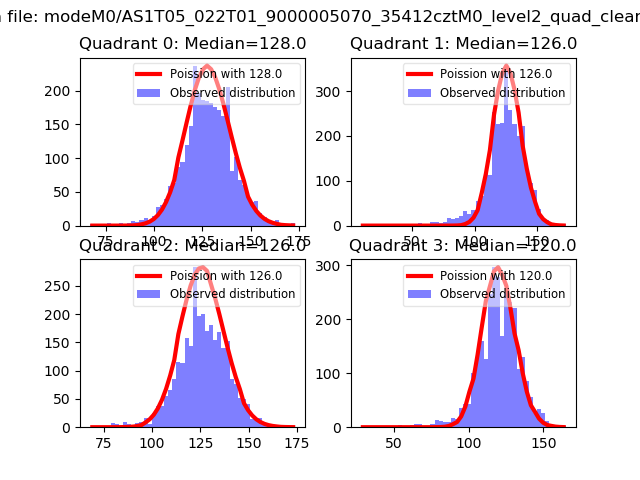
| Comparison with Poisson distribution Blue bars denote a histogram of data divided into 1 sec bins. Red curve is a Poisson curve with rate = median count rate of data. |
 |
 |
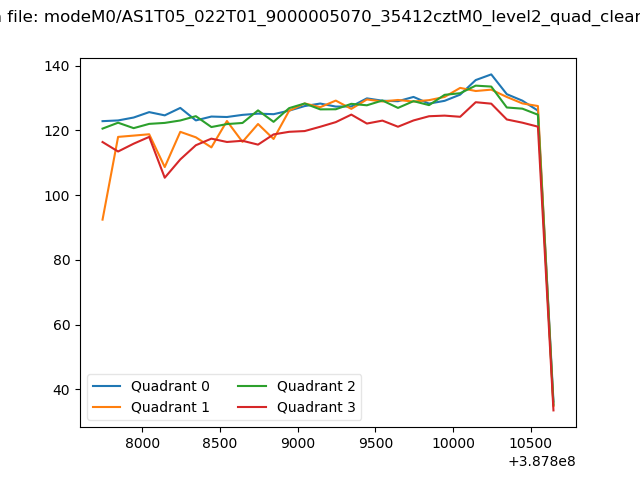
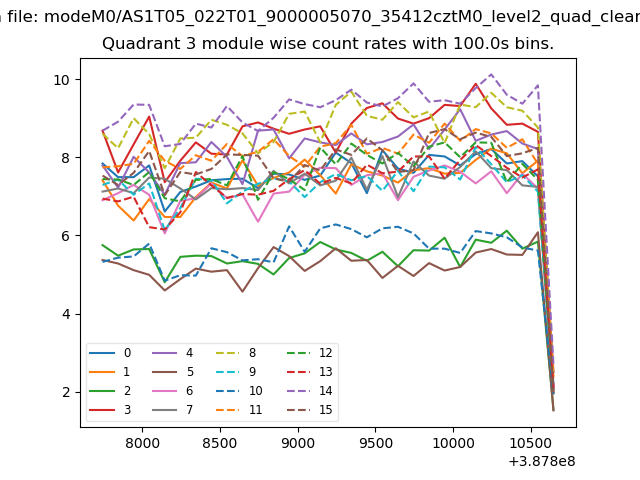
| Quadrant-wise count rates Data is divided into 100 sec bins |
 |
|
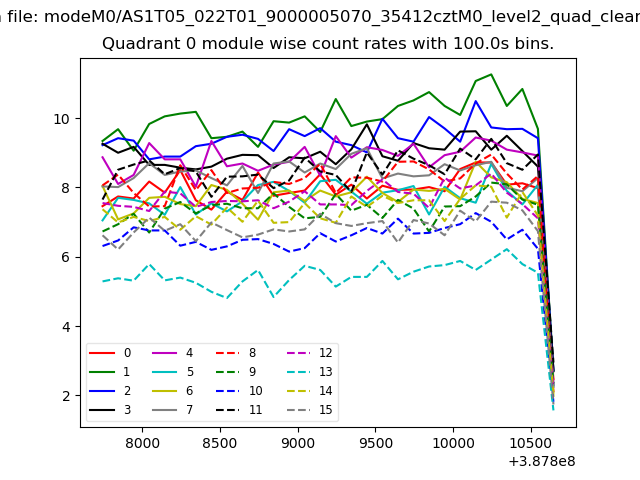
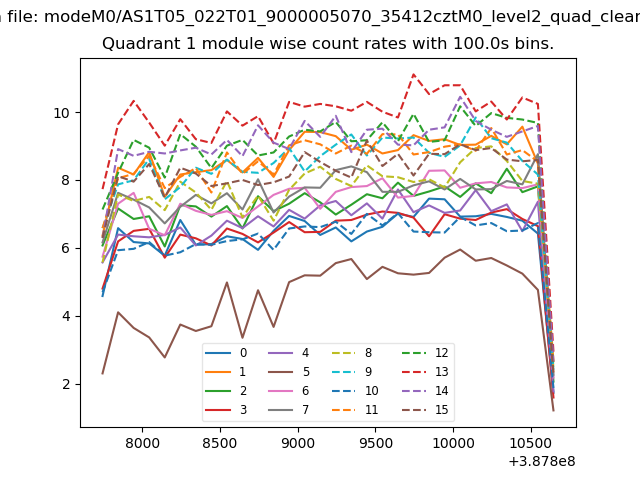
| Module-wise count rates for Quadrant A Data is divided into 100 sec bins |
 |
 |
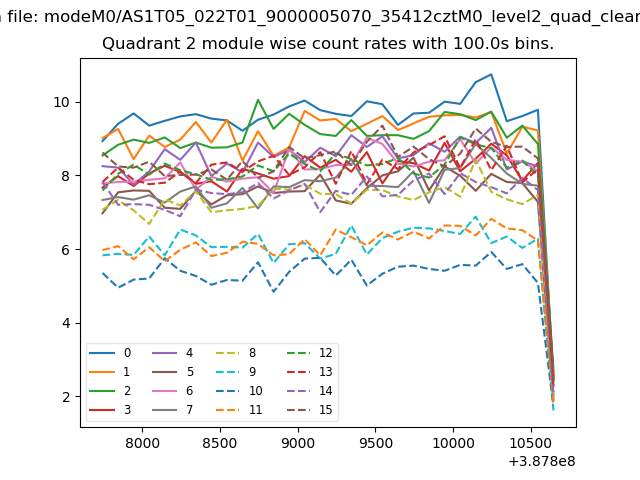
| Module-wise count rates for Quadrant B Data is divided into 100 sec bins |
 |
 |
| Module-wise count rates for Quadrant C Data is divided into 100 sec bins |
 |
 |
| Module-wise count rates for Quadrant D Data is divided into 100 sec bins |
 |
 |
| Parameter | Plot |
|---|---|
| CZT HV Monitor |  |
| D_VDD | 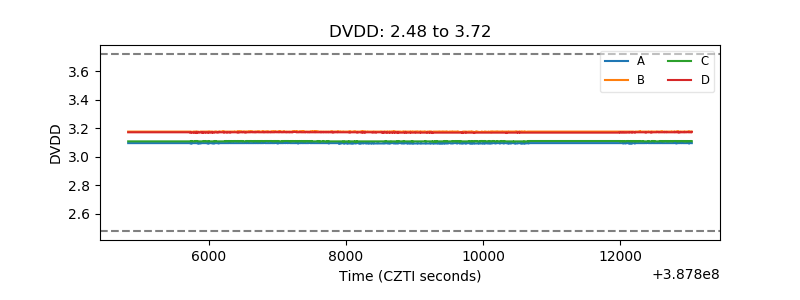 |
| Temperature 1 | 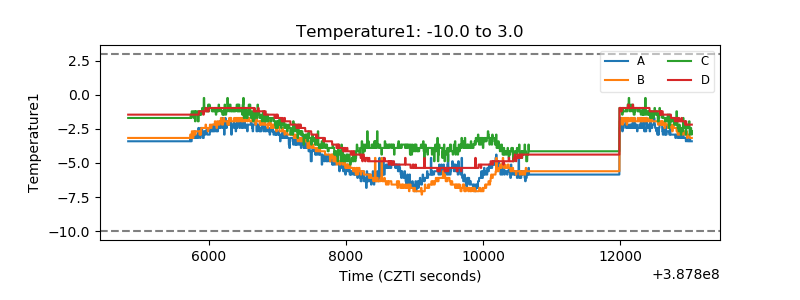 |
| Veto HV Monitor | 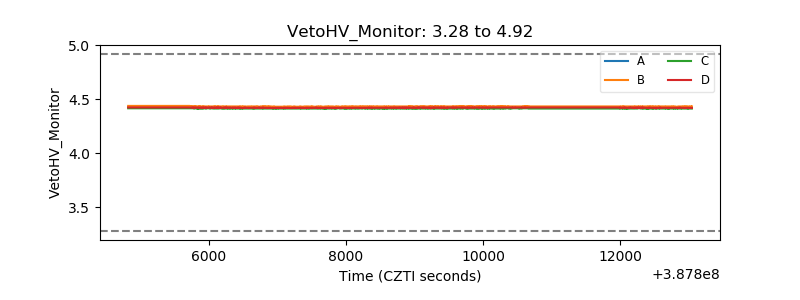 |
| Veto LLD | 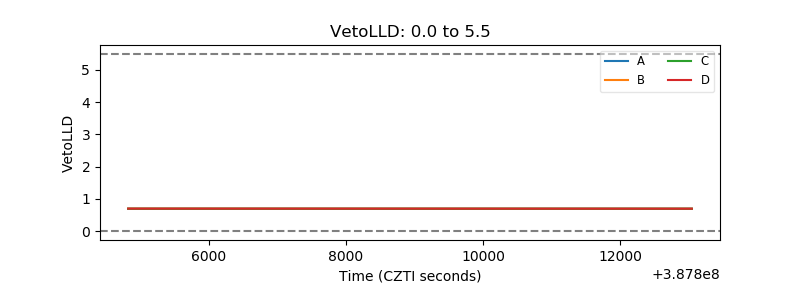 |
| Alpha Counter | 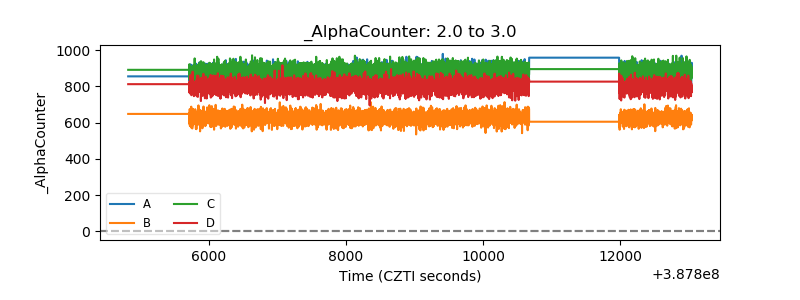 |
| _CPM_Rate | 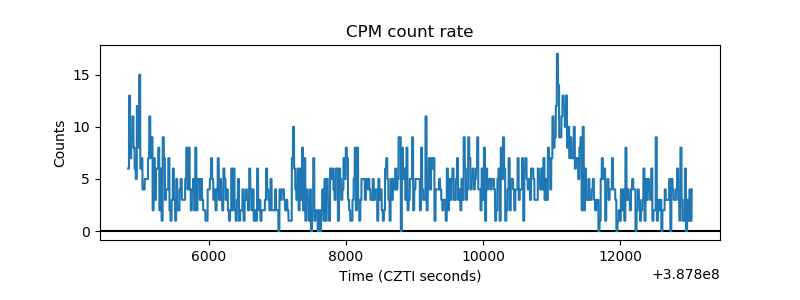 |
| CZT Counter | 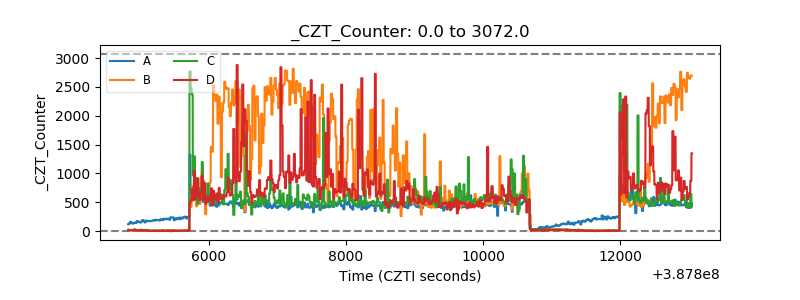 |
| +2.5 Volts monitor | 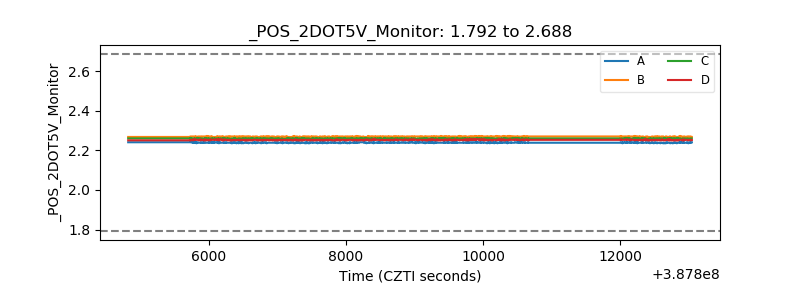 |
| +5 Volts monitor | 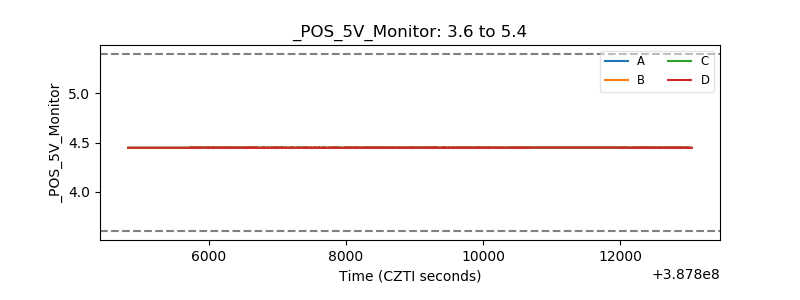 |
| _ROLL_ROT | 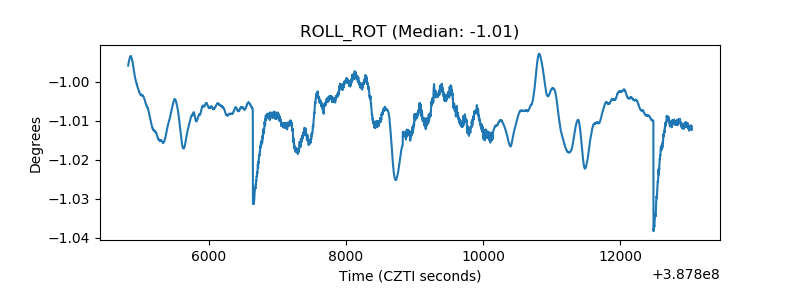 |
| _Roll_DEC | 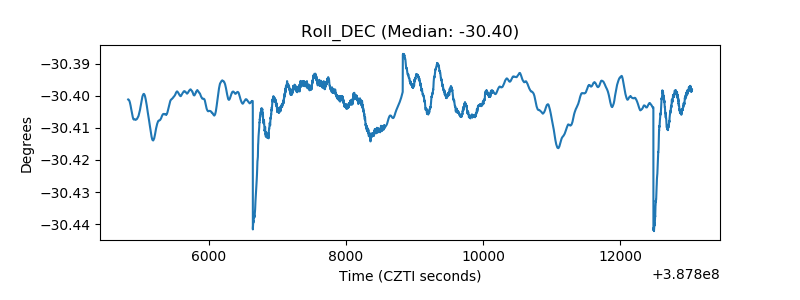 |
| _Roll_RA | 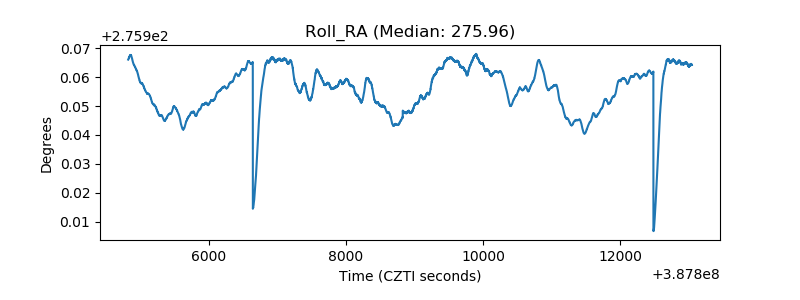 |
| Veto Counter | 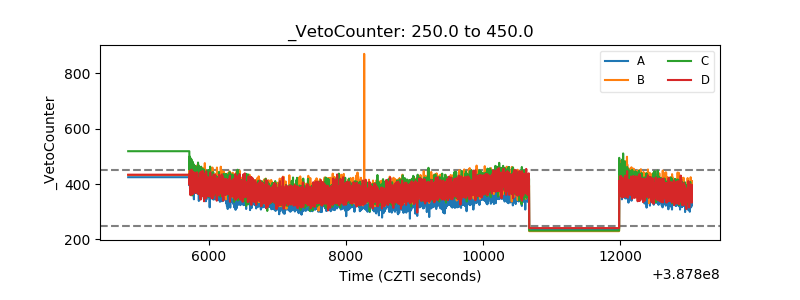 |