| Param | Original file | Final file |
|---|---|---|
| Filename | modeM0/AS1T05_022T01_9000005070_35411cztM0_level2.evt | modeM0/AS1T05_022T01_9000005070_35411cztM0_level2_quad_clean.evt |
| Size (bytes) | 632,678,400 | 57,101,760 |
| Size | 603.4 MB | 54.5 MB |
| Events in quadrant A | 2,771,019 | 338,565 |
| Events in quadrant B | 8,689,784 | 324,831 |
| Events in quadrant C | 3,457,318 | 335,149 |
| Events in quadrant D | 3,844,212 | 319,054 |
| Mode M0 | |||
|---|---|---|---|
| Quadrant | BADHDUFLAG | Total packets | Discarded packets |
| A | 0 | 11949 | 3 |
| B | 0 | 29802 | 2 |
| C | 0 | 13775 | 2 |
| D | 0 | 15192 | 2 |
| Mode SS | |||
|---|---|---|---|
| Quadrant | BADHDUFLAG | Total packets | Discarded packets |
| A | 0 | 120 | 0 |
| B | 0 | 120 | 0 |
| C | 0 | 120 | 0 |
| D | 0 | 120 | 0 |
| Mode M9 | |||
|---|---|---|---|
| Quadrant | BADHDUFLAG | Total packets | Discarded packets |
| A | 0 | 14 | 0 |
| B | 0 | 14 | 0 |
| C | 0 | 14 | 0 |
| D | 0 | 14 | 0 |
| Quadrant | Total seconds | Saturated seconds | Saturation percentage |
|---|---|---|---|
| A | 5879 | 3 | 0.051029% |
| B | 5879 | 2423 | 41.214492% |
| C | 5879 | 82 | 1.394795% |
| D | 5879 | 184 | 3.129784% |
Noise dominated data is calculated using 1-second bins in cleaned event files. If a bin has >2000 counts, and if more than 50% of those come from <1% of pixels, then it is considered to be noise-dominated and hence unusable.
| Quadrant | # 1 sec bins | Bins with >0 counts | Bins with >2000 counts | High rate bins dominated by noise | Noise dominated (total time) | Noise dominated (detector-on time) | Marked lightcurve |
|---|---|---|---|---|---|---|---|
| A | 7282 | 5880 | 0 | 0 | 0.00% | 0.00% | 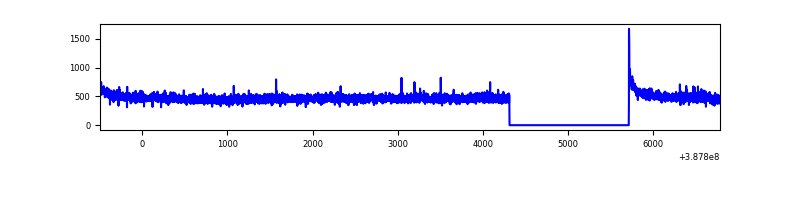 |
| B | 7282 | 5880 | 1945 | 1945 | 26.71% | 33.08% | 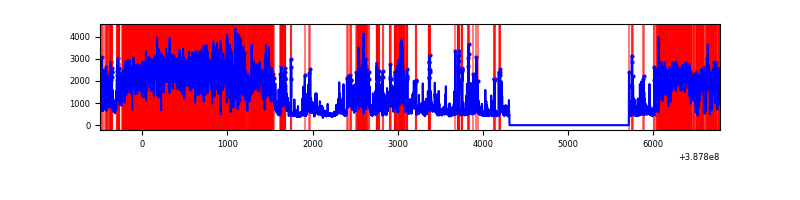 |
| C | 7282 | 5880 | 61 | 61 | 0.84% | 1.04% | 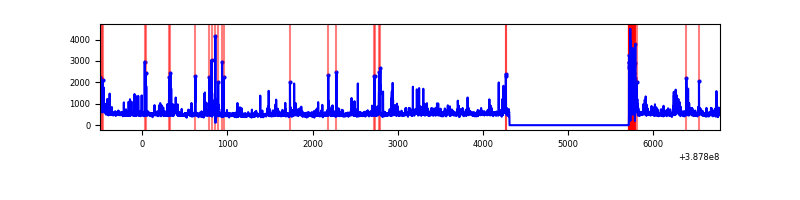 |
| D | 7282 | 5880 | 147 | 147 | 2.02% | 2.50% | 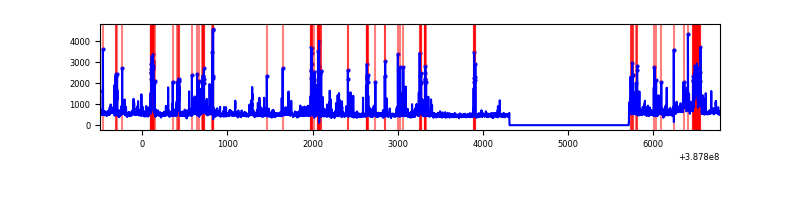 |
Top three noisy pixels from each quadrant. If the there are fewer than three noisy pixels in the level2.evt file, extra rows are filled as -1
| Pixel properties | Quadrant properties | ||||||
|---|---|---|---|---|---|---|---|
| Quadrant | DetID | PixID | Counts | Sigma | Mean | Median | Sigma |
| A | 10 | 83 | 118755 | 852.96 | 681 | 666 | 138.4 |
| A | 13 | 6 | 18945 | 132.03 | 681 | 666 | 138.4 |
| A | 13 | 254 | 9479 | 63.66 | 681 | 666 | 138.4 |
| B | 4 | 251 | 2172406 | 20088.39 | 561 | 545 | 108.1 |
| B | 5 | 236 | 1591712 | 14717.32 | 561 | 545 | 108.1 |
| B | 5 | 14 | 740259 | 6841.9 | 561 | 545 | 108.1 |
| C | 0 | 207 | 282341 | 1842.08 | 662 | 665 | 152.9 |
| C | 0 | 10 | 269863 | 1760.48 | 662 | 665 | 152.9 |
| C | 15 | 214 | 240451 | 1568.13 | 662 | 665 | 152.9 |
| D | 7 | 80 | 486536 | 2998.84 | 660 | 642 | 162.0 |
| D | 8 | 195 | 130502 | 801.47 | 660 | 642 | 162.0 |
| D | 2 | 31 | 86162 | 527.81 | 660 | 642 | 162.0 |
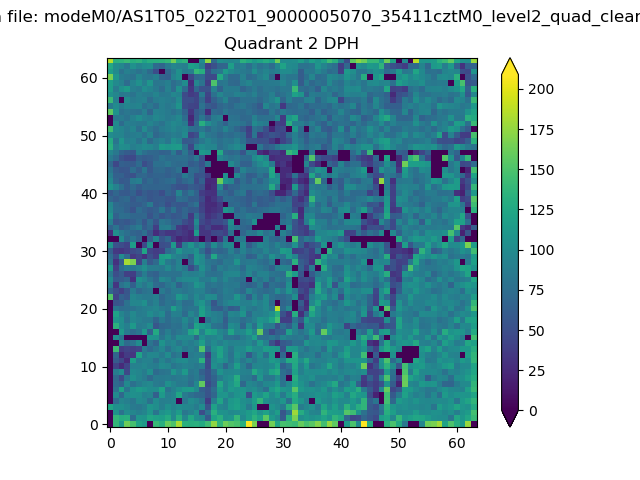
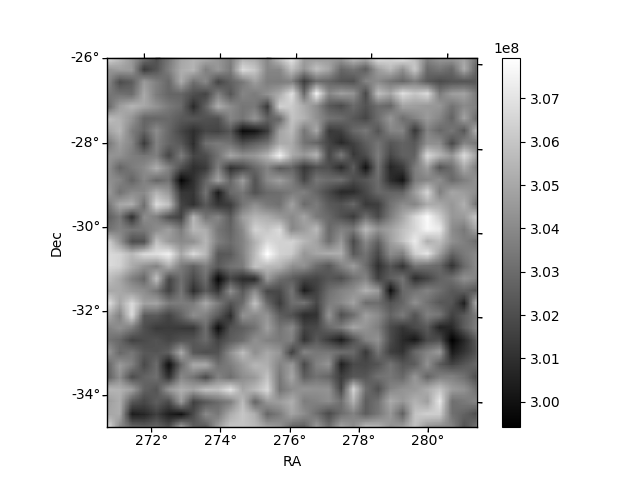
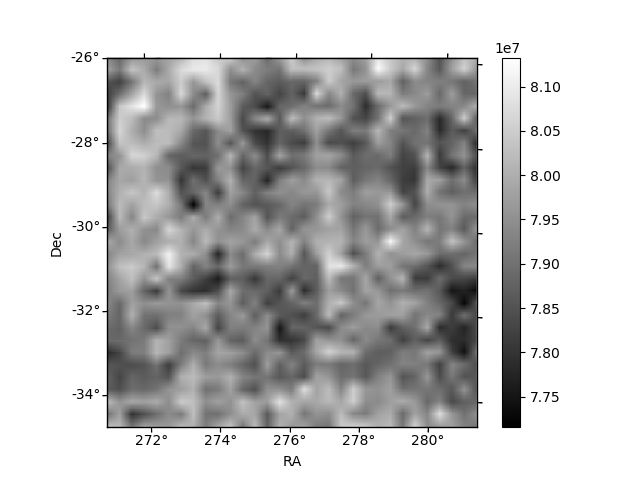
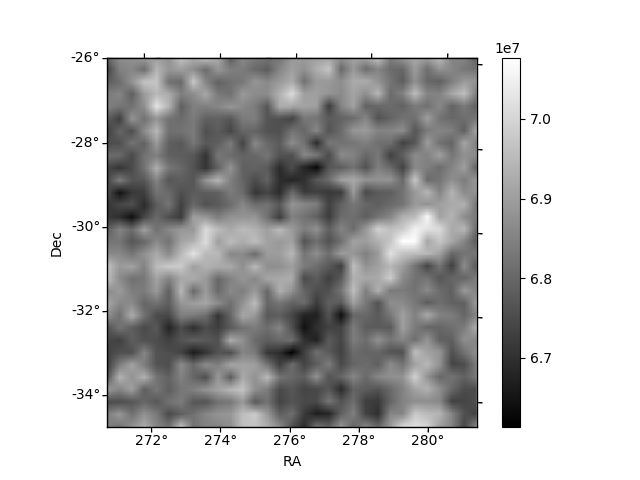
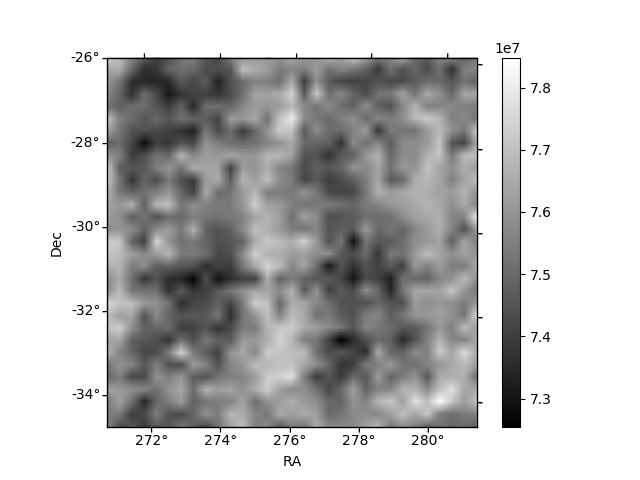
Histogram calculated using DETX and DETY for each event in the final _common_clean file
| Quadrant A | 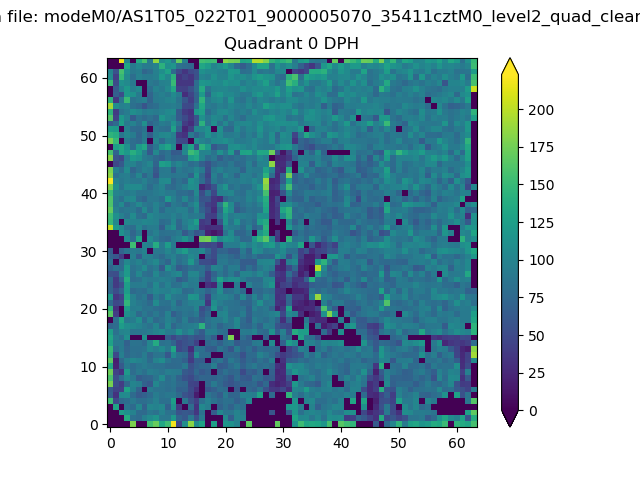 |
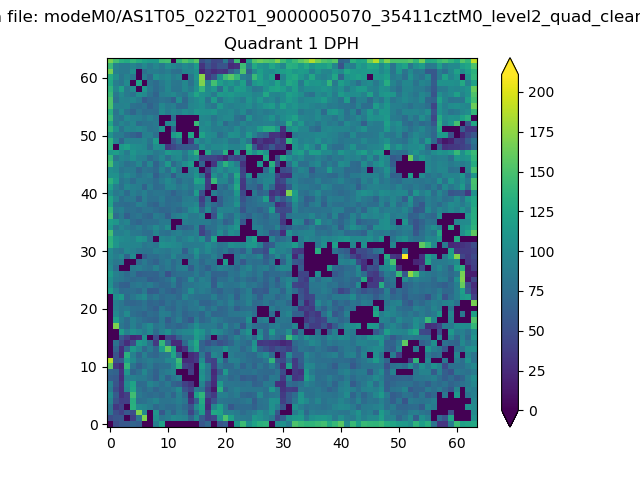 |
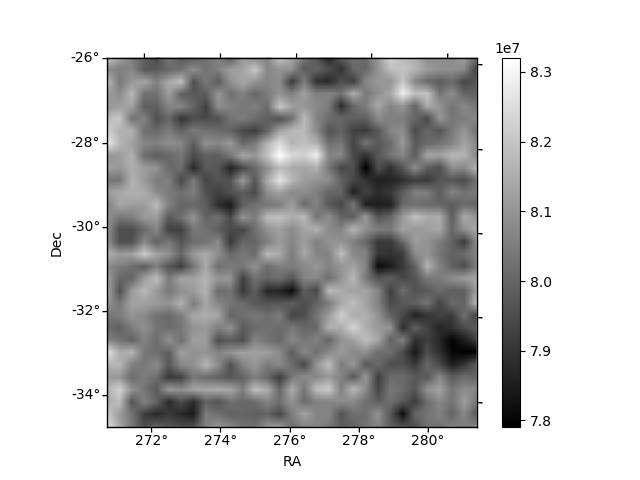
Quadrant B |
|---|---|---|---|
| Quadrant D | 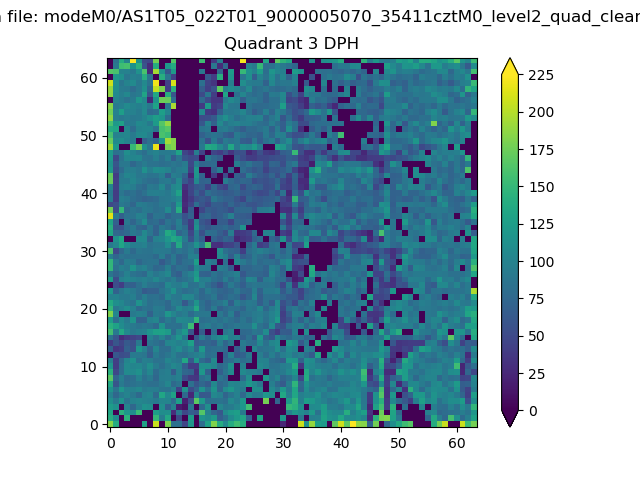 |
 |
Quadrant C |
| Plot type | Count rate plots | Images |
|---|---|---|
| Comparison with Poisson distribution Blue bars denote a histogram of data divided into 1 sec bins. Red curve is a Poisson curve with rate = median count rate of data. |
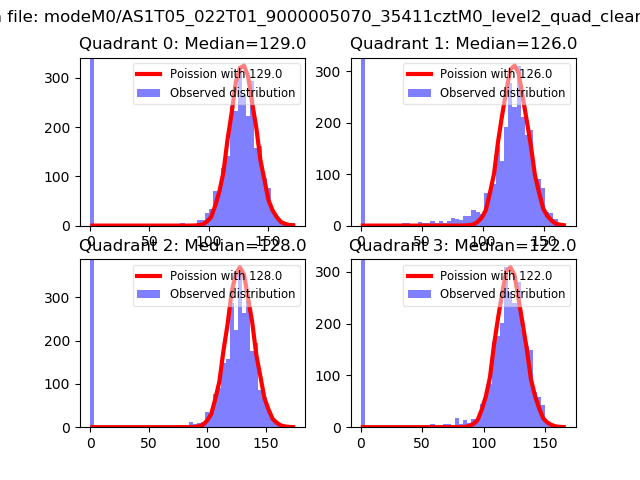 |
 |
| Quadrant-wise count rates Data is divided into 100 sec bins |
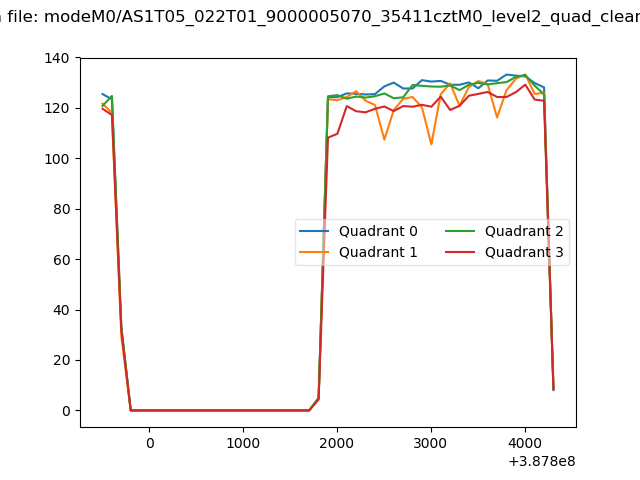 |
|
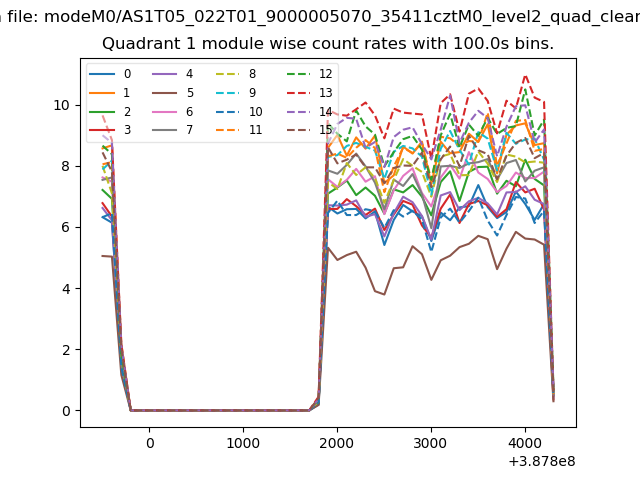
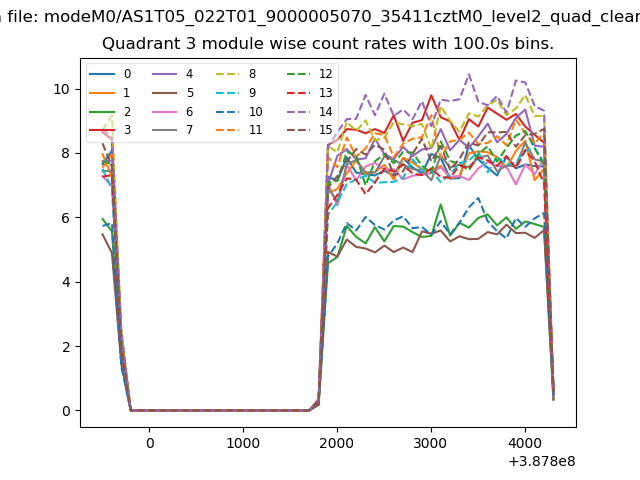
| Module-wise count rates for Quadrant A Data is divided into 100 sec bins |
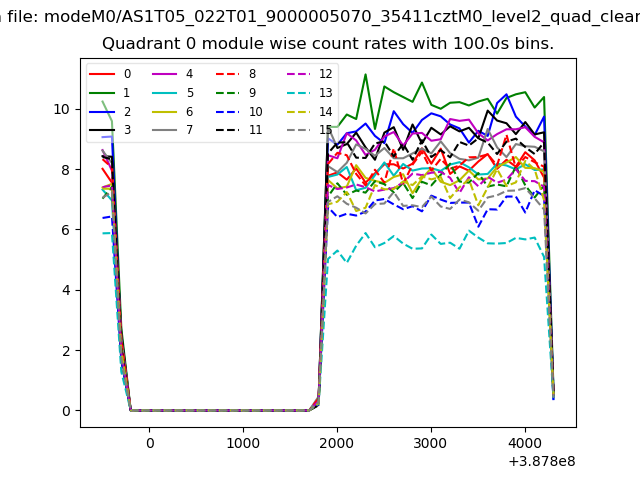 |
 |
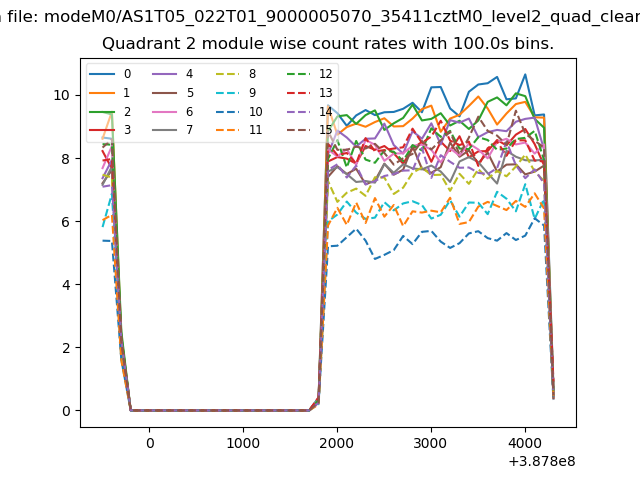
| Module-wise count rates for Quadrant B Data is divided into 100 sec bins |
 |
 |
| Module-wise count rates for Quadrant C Data is divided into 100 sec bins |
 |
 |
| Module-wise count rates for Quadrant D Data is divided into 100 sec bins |
 |
 |
| Parameter | Plot |
|---|---|
| CZT HV Monitor | 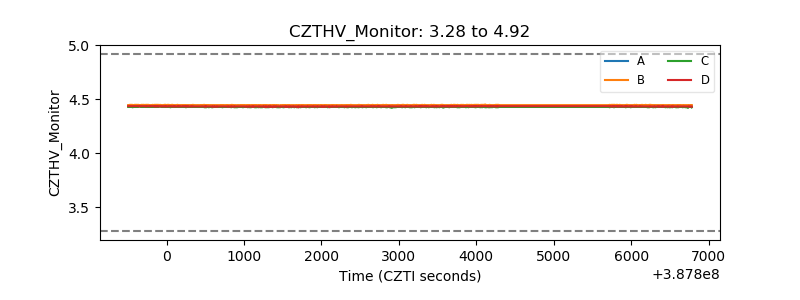 |
| D_VDD | 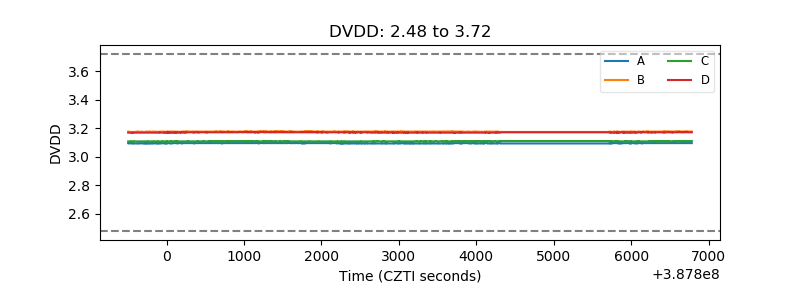 |
| Temperature 1 | 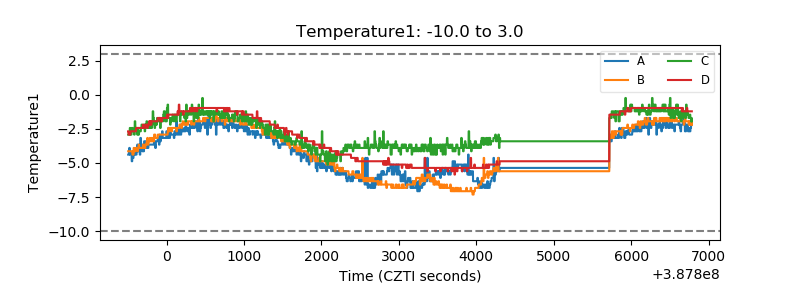 |
| Veto HV Monitor | 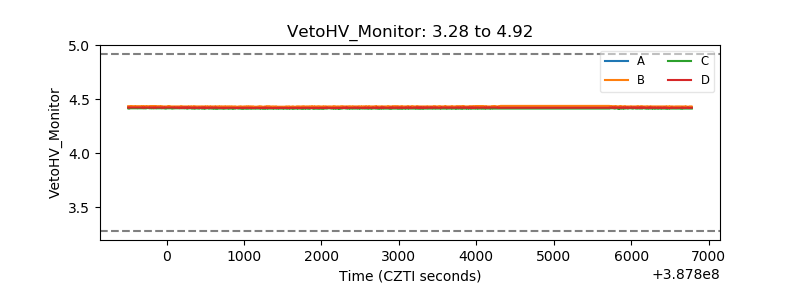 |
| Veto LLD | 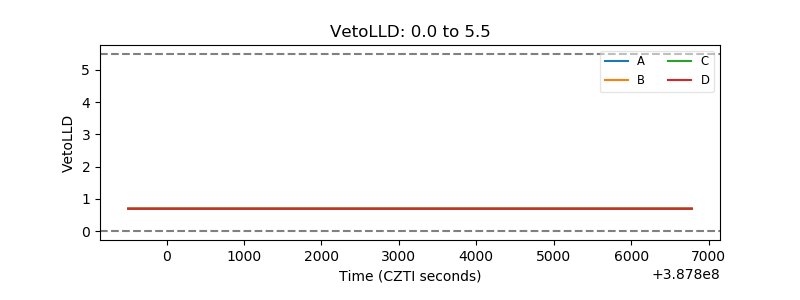 |
| Alpha Counter | 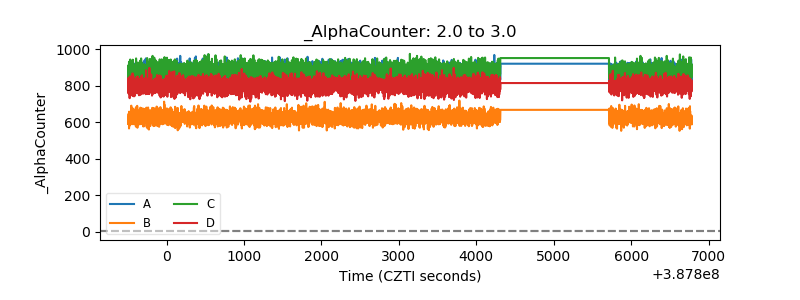 |
| _CPM_Rate | 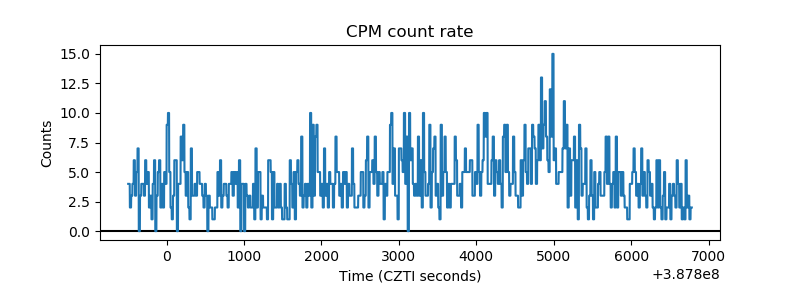 |
| CZT Counter | 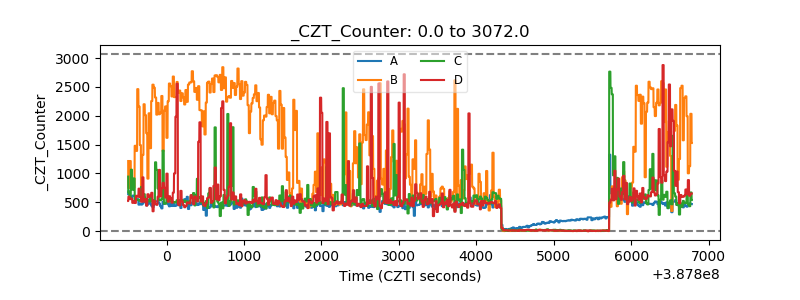 |
| +2.5 Volts monitor | 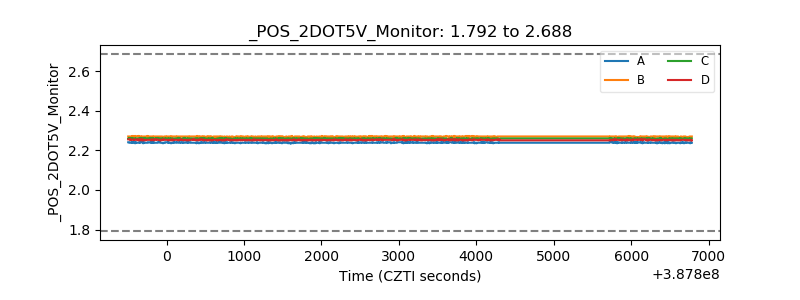 |
| +5 Volts monitor | 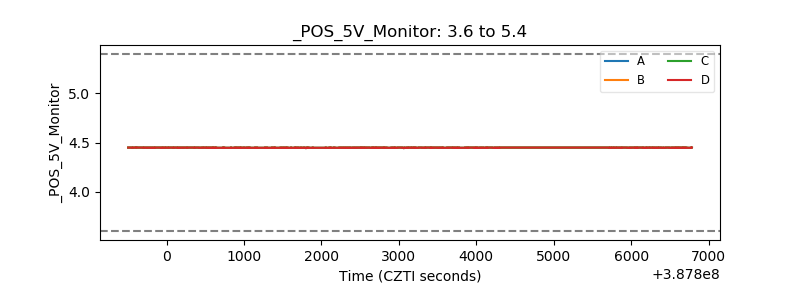 |
| _ROLL_ROT | 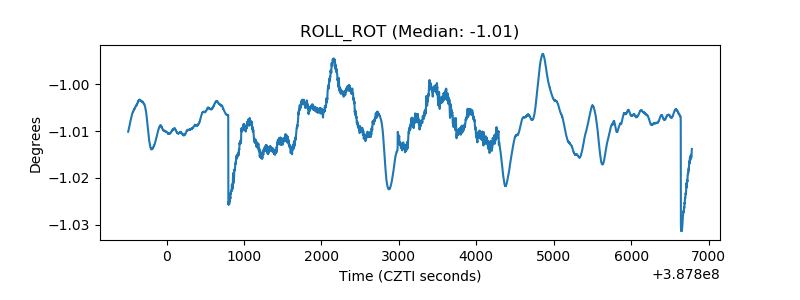 |
| _Roll_DEC | 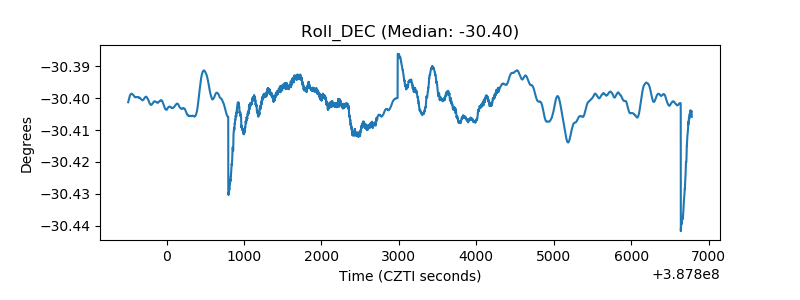 |
| _Roll_RA | 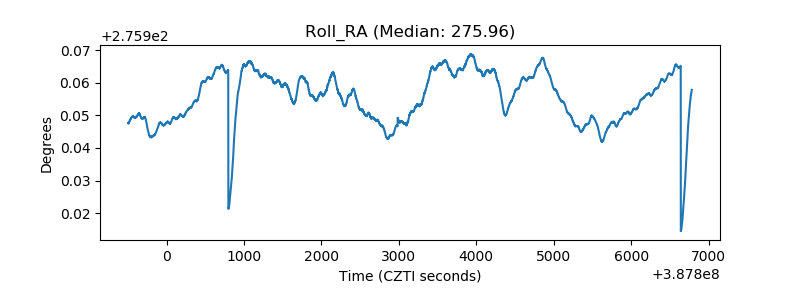 |
| Veto Counter | 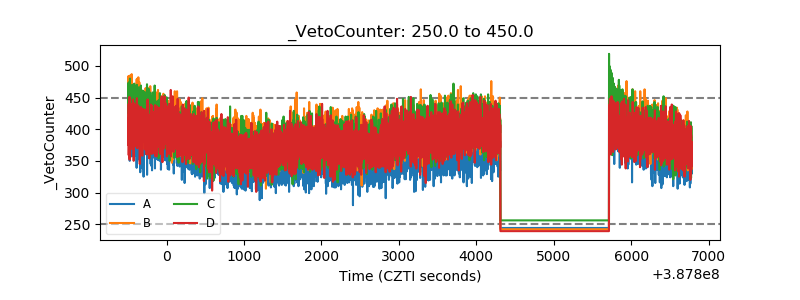 |