| Param | Original file | Final file |
|---|---|---|
| Filename | modeM0/AS1T05_022T01_9000005070_35409cztM0_level2.evt | modeM0/AS1T05_022T01_9000005070_35409cztM0_level2_quad_clean.evt |
| Size (bytes) | 649,664,640 | 54,561,600 |
| Size | 619.6 MB | 52.0 MB |
| Events in quadrant A | 2,433,963 | 352,336 |
| Events in quadrant B | 7,969,361 | 328,774 |
| Events in quadrant C | 3,142,028 | 349,949 |
| Events in quadrant D | 5,797,721 | 275,662 |
| Mode M0 | |||
|---|---|---|---|
| Quadrant | BADHDUFLAG | Total packets | Discarded packets |
| A | 0 | 10141 | 2 |
| B | 0 | 27088 | 1 |
| C | 0 | 12239 | 1 |
| D | 0 | 20667 | 1 |
| Mode SS | |||
|---|---|---|---|
| Quadrant | BADHDUFLAG | Total packets | Discarded packets |
| A | 0 | 100 | 0 |
| B | 0 | 100 | 0 |
| C | 0 | 100 | 0 |
| D | 0 | 100 | 0 |
| Mode M9 | |||
|---|---|---|---|
| Quadrant | BADHDUFLAG | Total packets | Discarded packets |
| A | 0 | 20 | 0 |
| B | 0 | 20 | 0 |
| C | 0 | 20 | 0 |
| D | 0 | 20 | 0 |
| Quadrant | Total seconds | Saturated seconds | Saturation percentage |
|---|---|---|---|
| A | 4911 | 7 | 0.142537% |
| B | 4911 | 2195 | 44.695581% |
| C | 4911 | 94 | 1.914070% |
| D | 4911 | 1214 | 24.720016% |
Noise dominated data is calculated using 1-second bins in cleaned event files. If a bin has >2000 counts, and if more than 50% of those come from <1% of pixels, then it is considered to be noise-dominated and hence unusable.
| Quadrant | # 1 sec bins | Bins with >0 counts | Bins with >2000 counts | High rate bins dominated by noise | Noise dominated (total time) | Noise dominated (detector-on time) | Marked lightcurve |
|---|---|---|---|---|---|---|---|
| A | 6913 | 4912 | 1 | 1 | 0.01% | 0.02% | 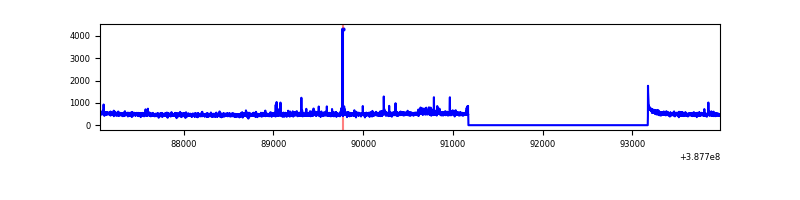 |
| B | 6913 | 4912 | 1871 | 1871 | 27.06% | 38.09% | 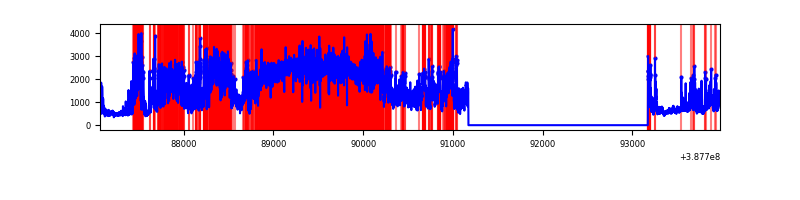 |
| C | 6913 | 4912 | 79 | 79 | 1.14% | 1.61% | 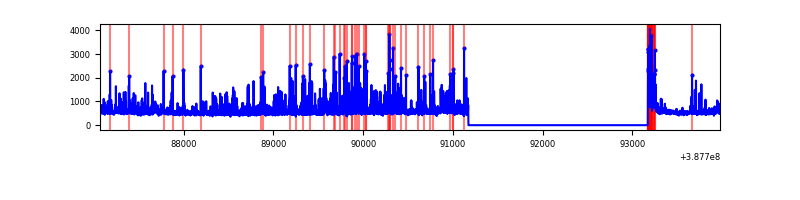 |
| D | 6913 | 4912 | 1124 | 1124 | 16.26% | 22.88% | 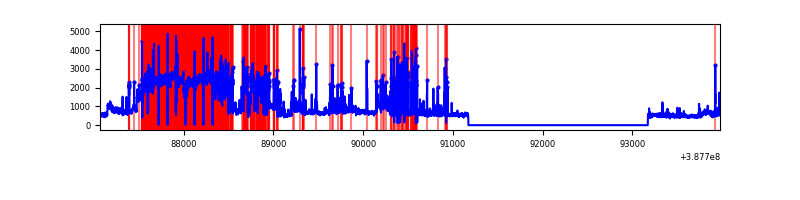 |
Top three noisy pixels from each quadrant. If the there are fewer than three noisy pixels in the level2.evt file, extra rows are filled as -1
| Pixel properties | Quadrant properties | ||||||
|---|---|---|---|---|---|---|---|
| Quadrant | DetID | PixID | Counts | Sigma | Mean | Median | Sigma |
| A | 10 | 83 | 98042 | 820.55 | 589 | 580 | 118.8 |
| A | 9 | 143 | 24634 | 202.52 | 589 | 580 | 118.8 |
| A | 7 | 16 | 22815 | 187.2 | 589 | 580 | 118.8 |
| B | 4 | 251 | 2135124 | 23738.21 | 464 | 451 | 89.9 |
| B | 5 | 236 | 987941 | 10981.19 | 464 | 451 | 89.9 |
| B | 5 | 31 | 918986 | 10214.39 | 464 | 451 | 89.9 |
| C | 0 | 10 | 570755 | 4290.5 | 571 | 575 | 132.9 |
| C | 15 | 214 | 203430 | 1526.45 | 571 | 575 | 132.9 |
| C | 0 | 207 | 96920 | 724.98 | 571 | 575 | 132.9 |
| D | 7 | 80 | 3177901 | 26497.32 | 482 | 466 | 119.9 |
| D | 8 | 195 | 254228 | 2116.18 | 482 | 466 | 119.9 |
| D | 13 | 249 | 170704 | 1419.65 | 482 | 466 | 119.9 |
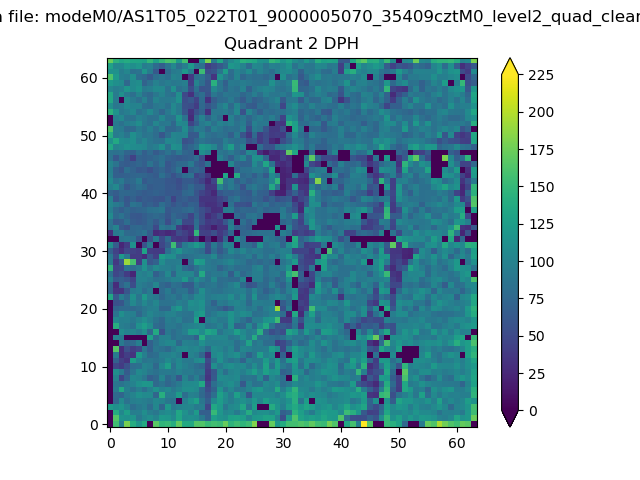
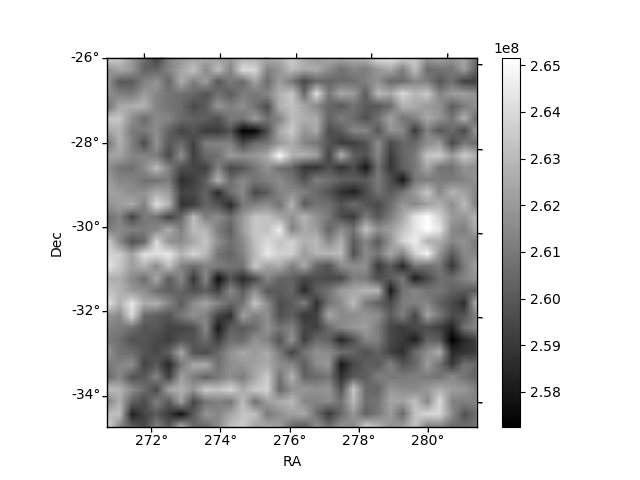
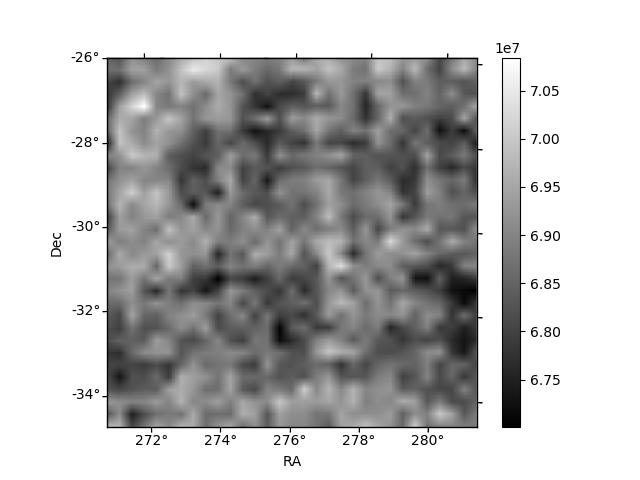
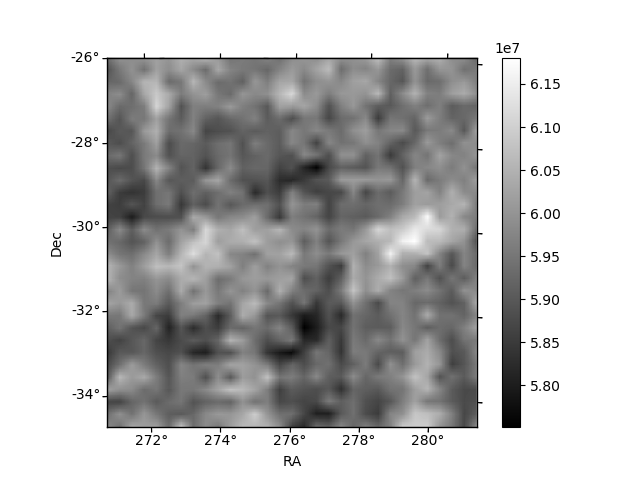
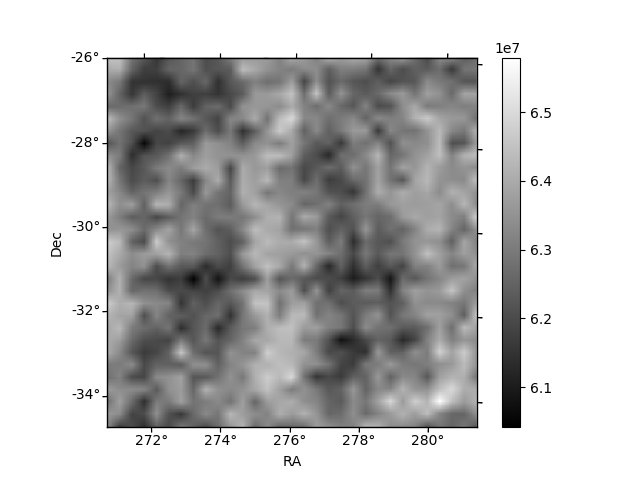
Histogram calculated using DETX and DETY for each event in the final _common_clean file
| Quadrant A | 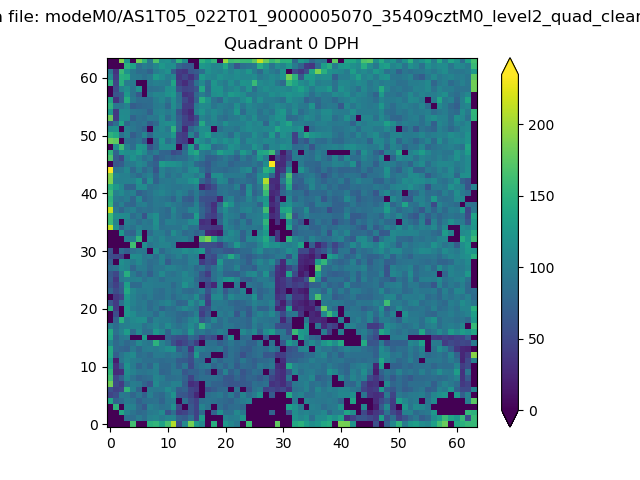 |
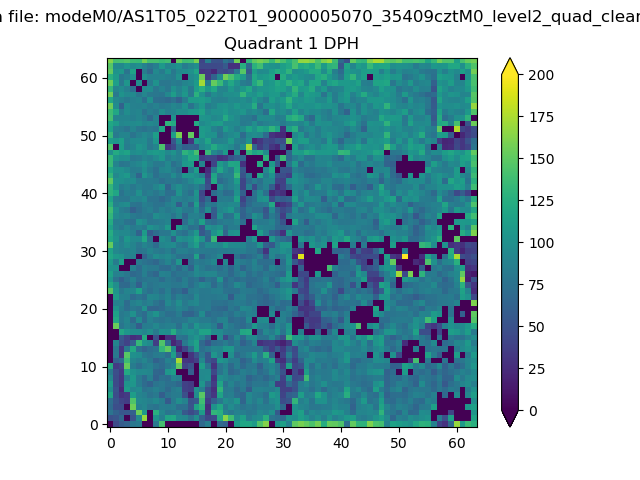 |
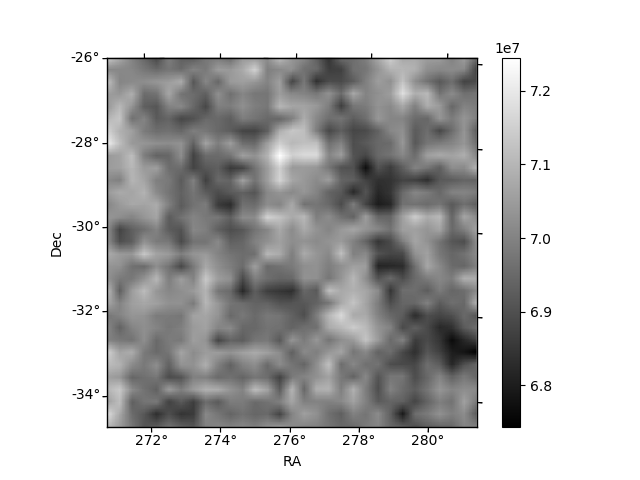
Quadrant B |
|---|---|---|---|
| Quadrant D | 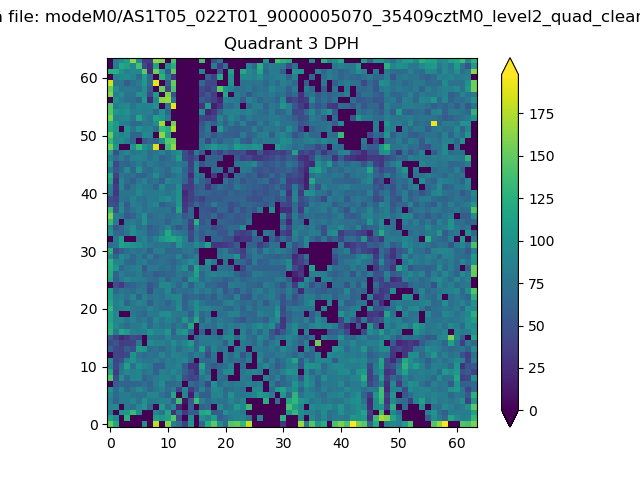 |
 |
Quadrant C |
| Plot type | Count rate plots | Images |
|---|---|---|
| Comparison with Poisson distribution Blue bars denote a histogram of data divided into 1 sec bins. Red curve is a Poisson curve with rate = median count rate of data. |
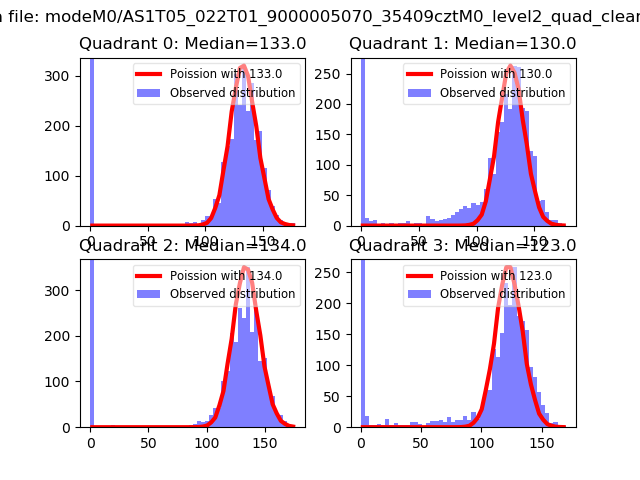 |
 |
| Quadrant-wise count rates Data is divided into 100 sec bins |
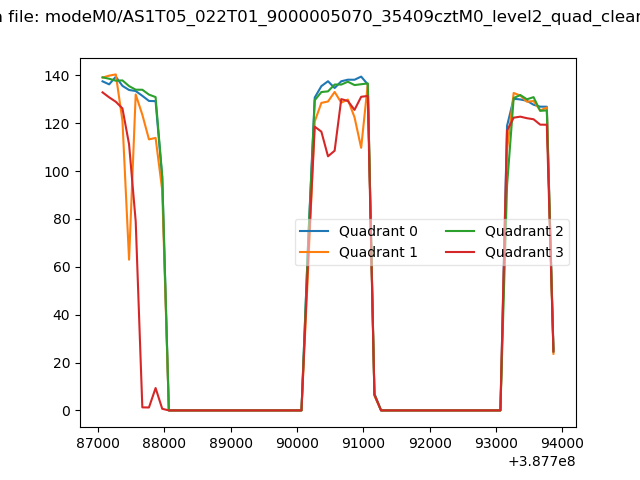 |
|
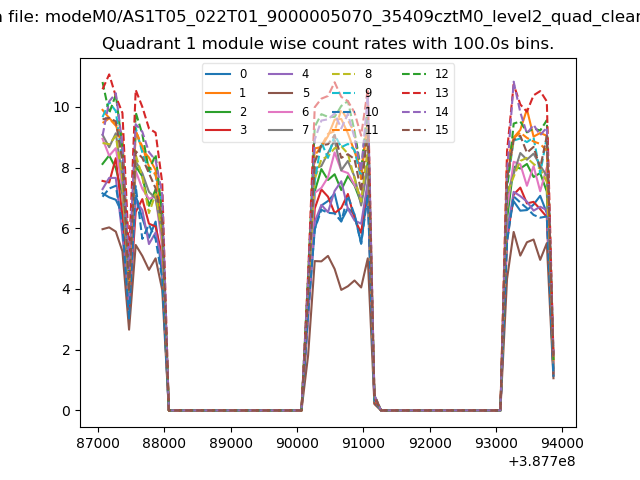
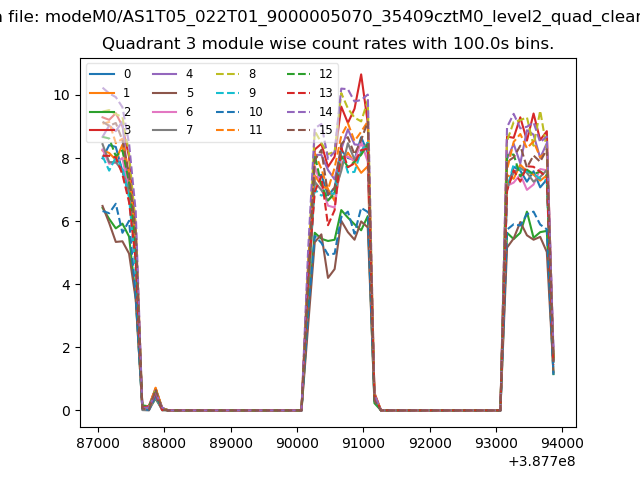
| Module-wise count rates for Quadrant A Data is divided into 100 sec bins |
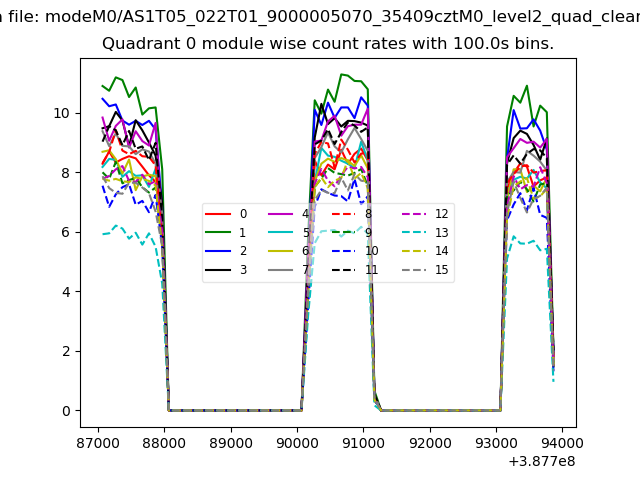 |
 |
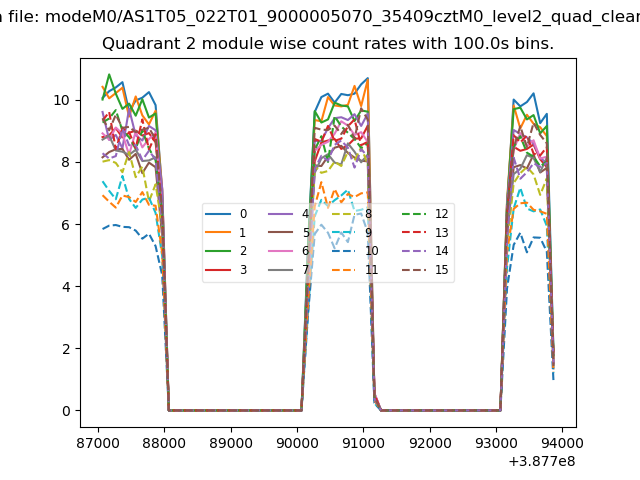
| Module-wise count rates for Quadrant B Data is divided into 100 sec bins |
 |
 |
| Module-wise count rates for Quadrant C Data is divided into 100 sec bins |
 |
 |
| Module-wise count rates for Quadrant D Data is divided into 100 sec bins |
 |
 |
| Parameter | Plot |
|---|---|
| CZT HV Monitor | 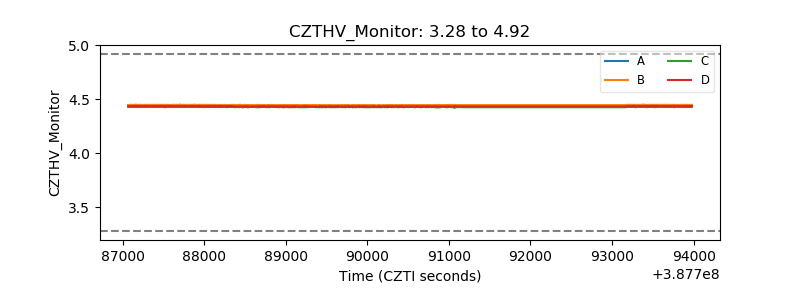 |
| D_VDD | 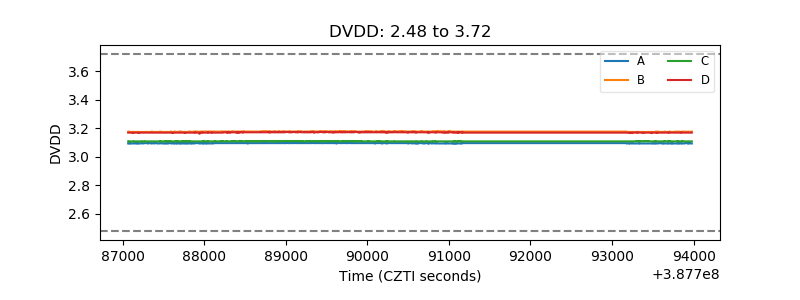 |
| Temperature 1 | 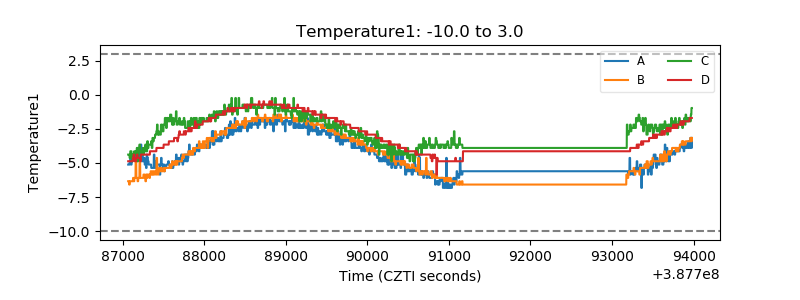 |
| Veto HV Monitor |  |
| Veto LLD | 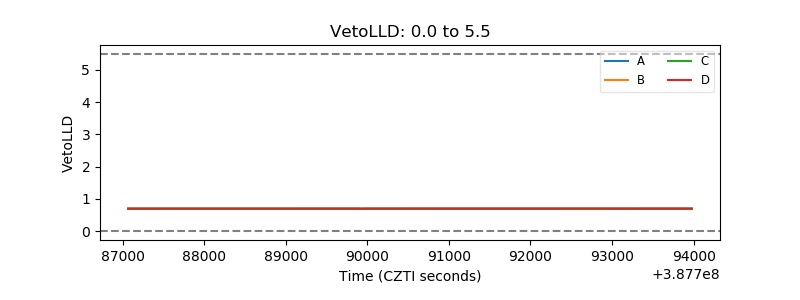 |
| Alpha Counter | 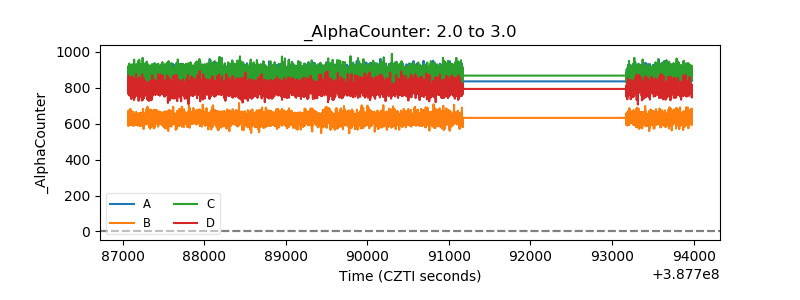 |
| _CPM_Rate | 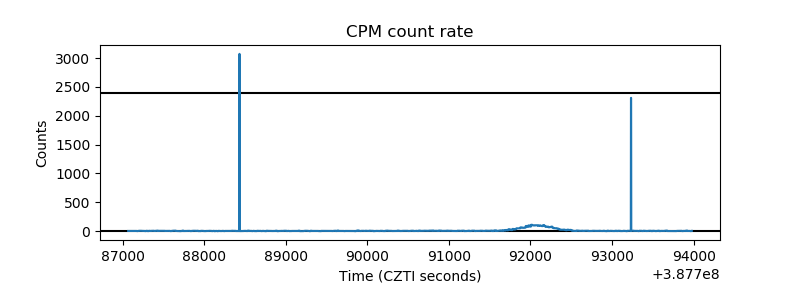 |
| CZT Counter | 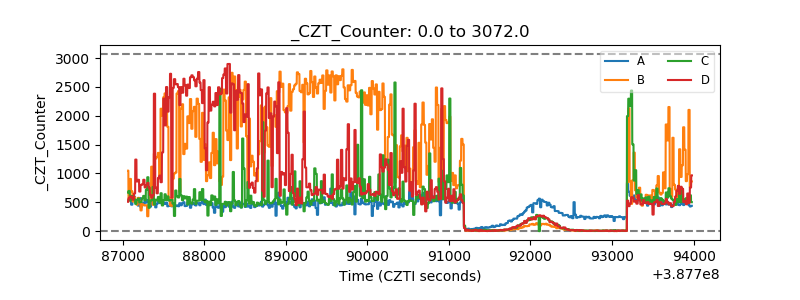 |
| +2.5 Volts monitor | 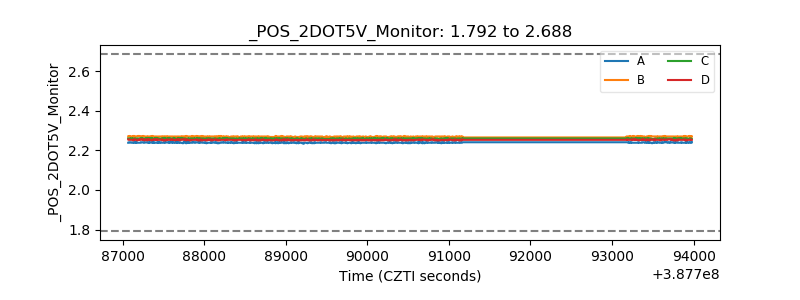 |
| +5 Volts monitor | 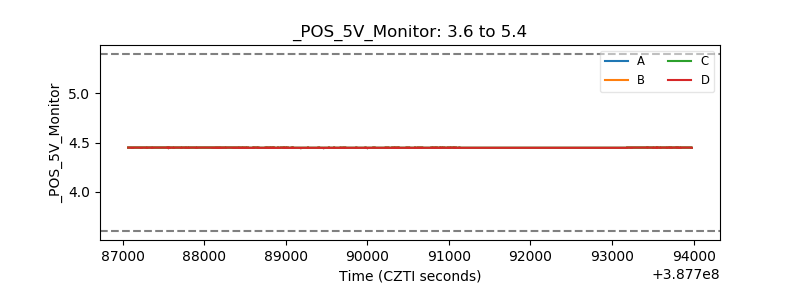 |
| _ROLL_ROT | 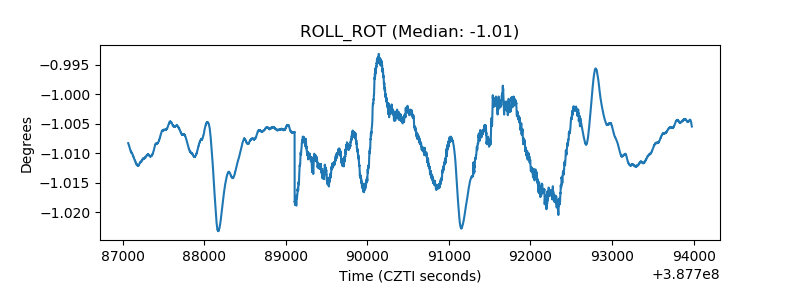 |
| _Roll_DEC | 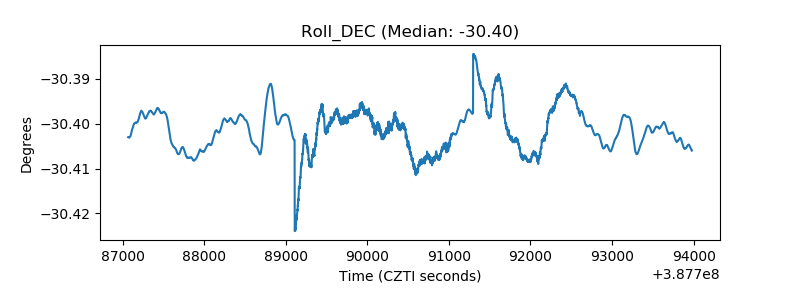 |
| _Roll_RA | 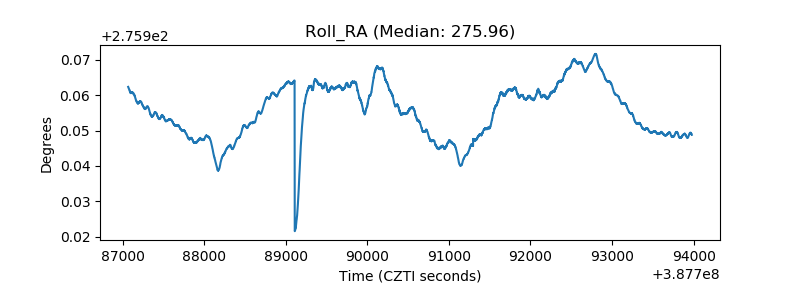 |
| Veto Counter | 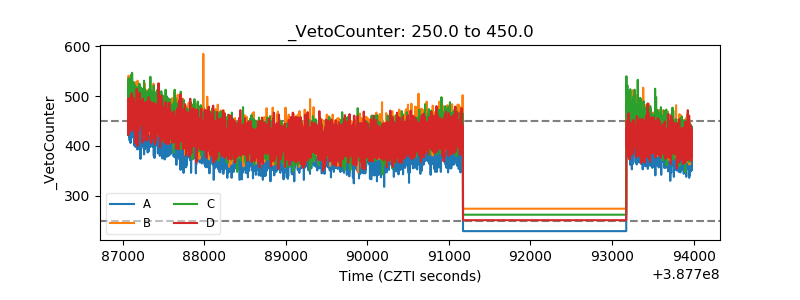 |