| Param | Original file | Final file |
|---|---|---|
| Filename | modeM0/AS1T05_022T01_9000005070_35406cztM0_level2.evt | modeM0/AS1T05_022T01_9000005070_35406cztM0_level2_quad_clean.evt |
| Size (bytes) | 627,353,280 | 78,546,240 |
| Size | 598.3 MB | 74.9 MB |
| Events in quadrant A | 2,790,046 | 517,306 |
| Events in quadrant B | 7,743,704 | 497,887 |
| Events in quadrant C | 3,183,988 | 520,764 |
| Events in quadrant D | 4,919,643 | 467,308 |
| Mode M0 | |||
|---|---|---|---|
| Quadrant | BADHDUFLAG | Total packets | Discarded packets |
| A | 0 | 11427 | 3 |
| B | 0 | 26755 | 2 |
| C | 0 | 12356 | 2 |
| D | 0 | 18256 | 2 |
| Mode SS | |||
|---|---|---|---|
| Quadrant | BADHDUFLAG | Total packets | Discarded packets |
| A | 0 | 110 | 0 |
| B | 0 | 110 | 0 |
| C | 0 | 110 | 0 |
| D | 0 | 110 | 0 |
| Mode M9 | |||
|---|---|---|---|
| Quadrant | BADHDUFLAG | Total packets | Discarded packets |
| A | 0 | 26 | 0 |
| B | 0 | 26 | 0 |
| C | 0 | 26 | 0 |
| D | 0 | 27 | 0 |
| Quadrant | Total seconds | Saturated seconds | Saturation percentage |
|---|---|---|---|
| A | 5350 | 8 | 0.149533% |
| B | 5350 | 1793 | 33.514019% |
| C | 5350 | 131 | 2.448598% |
| D | 5350 | 516 | 9.644860% |
Noise dominated data is calculated using 1-second bins in cleaned event files. If a bin has >2000 counts, and if more than 50% of those come from <1% of pixels, then it is considered to be noise-dominated and hence unusable.
| Quadrant | # 1 sec bins | Bins with >0 counts | Bins with >2000 counts | High rate bins dominated by noise | Noise dominated (total time) | Noise dominated (detector-on time) | Marked lightcurve |
|---|---|---|---|---|---|---|---|
| A | 7382 | 5351 | 1 | 1 | 0.01% | 0.02% | 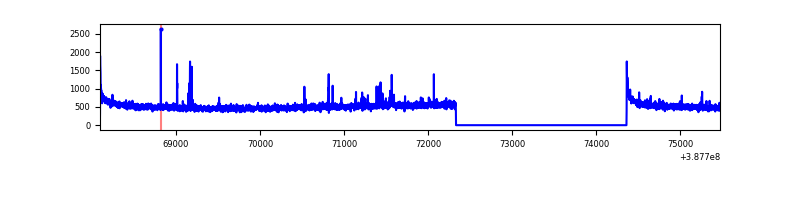 |
| B | 7382 | 5351 | 1482 | 1482 | 20.08% | 27.70% | 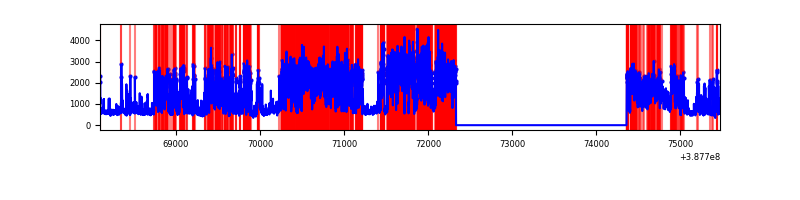 |
| C | 7382 | 5351 | 92 | 92 | 1.25% | 1.72% | 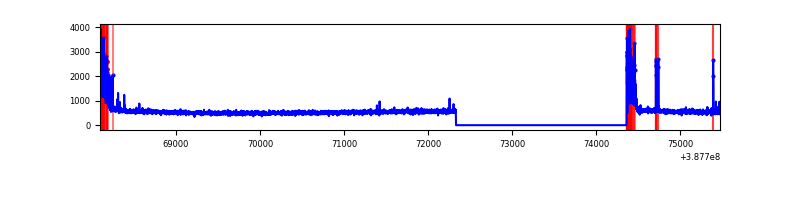 |
| D | 7382 | 5351 | 515 | 515 | 6.98% | 9.62% | 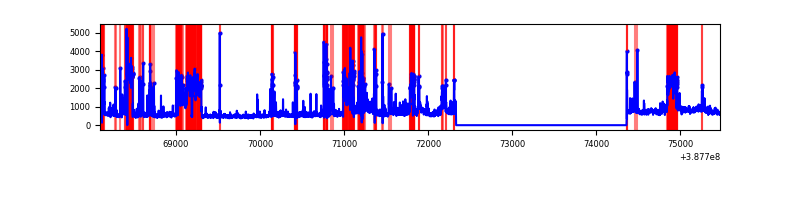 |
Top three noisy pixels from each quadrant. If the there are fewer than three noisy pixels in the level2.evt file, extra rows are filled as -1
| Pixel properties | Quadrant properties | ||||||
|---|---|---|---|---|---|---|---|
| Quadrant | DetID | PixID | Counts | Sigma | Mean | Median | Sigma |
| A | 10 | 83 | 126018 | 949.23 | 669 | 659 | 132.1 |
| A | 9 | 143 | 46677 | 348.45 | 669 | 659 | 132.1 |
| A | 13 | 6 | 15615 | 113.25 | 669 | 659 | 132.1 |
| B | 4 | 251 | 4749653 | 44561.95 | 567 | 553 | 106.6 |
| B | 5 | 236 | 258258 | 2418.11 | 567 | 553 | 106.6 |
| B | 0 | 219 | 167476 | 1566.28 | 567 | 553 | 106.6 |
| C | 0 | 10 | 366685 | 2399.34 | 662 | 669 | 152.5 |
| C | 15 | 214 | 219707 | 1435.86 | 662 | 669 | 152.5 |
| C | 3 | 233 | 8679 | 52.51 | 662 | 669 | 152.5 |
| D | 7 | 80 | 1404365 | 9187.08 | 633 | 617 | 152.8 |
| D | 8 | 195 | 200248 | 1306.52 | 633 | 617 | 152.8 |
| D | 1 | 47 | 185742 | 1211.58 | 633 | 617 | 152.8 |
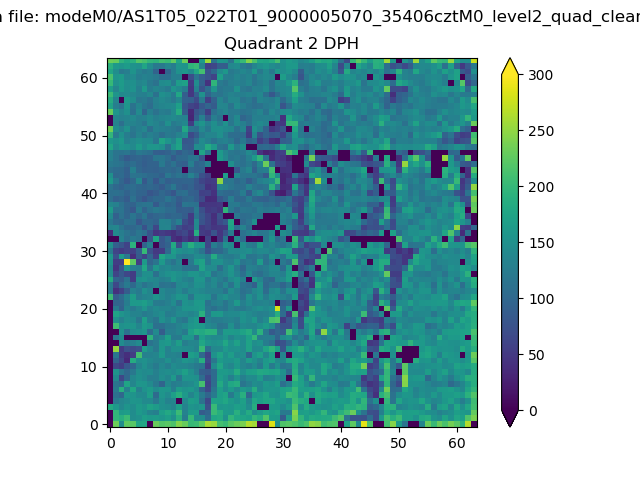
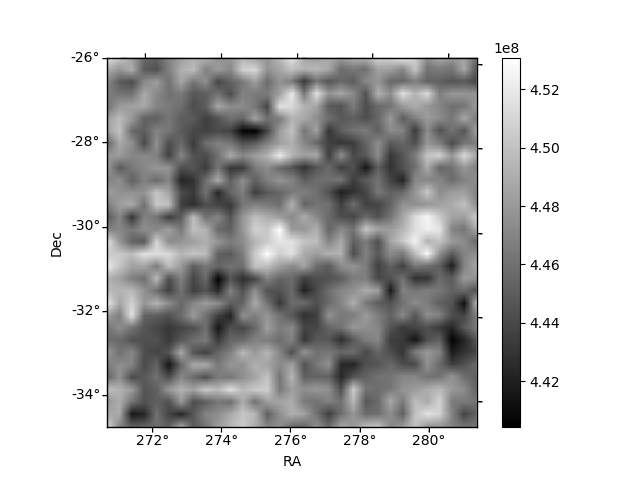
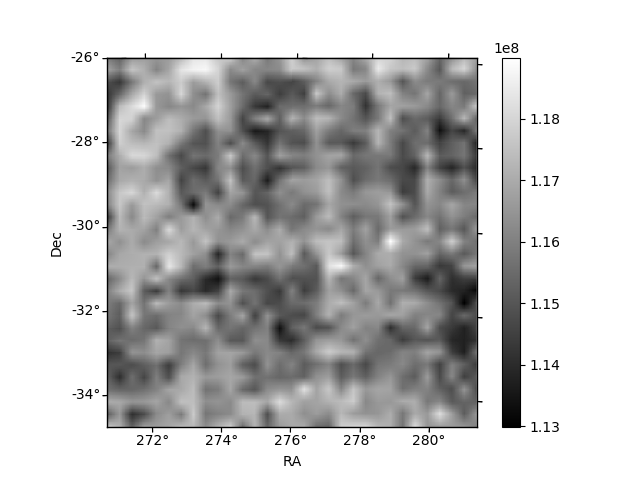
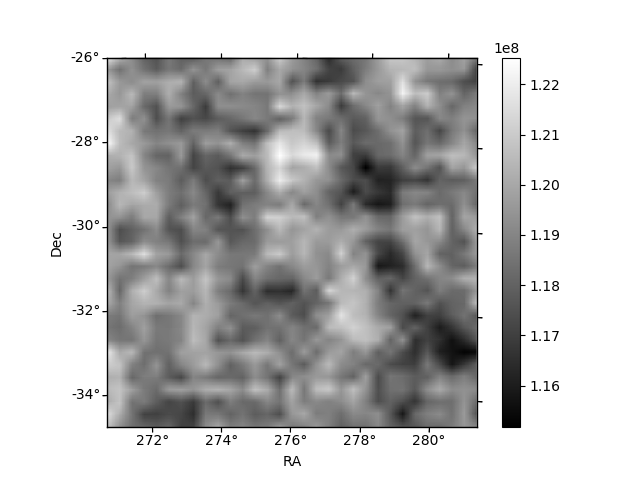
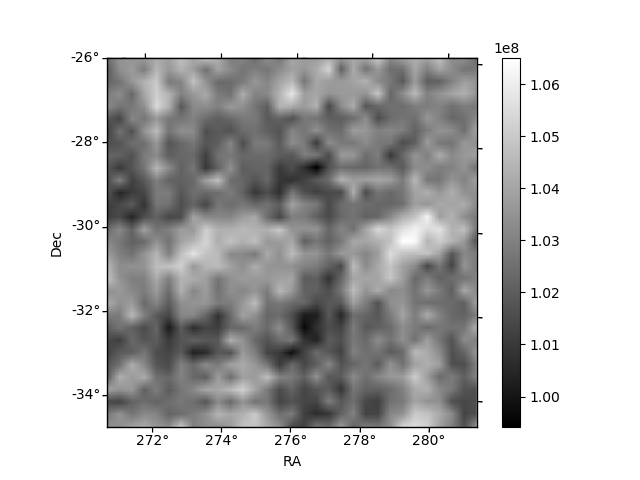
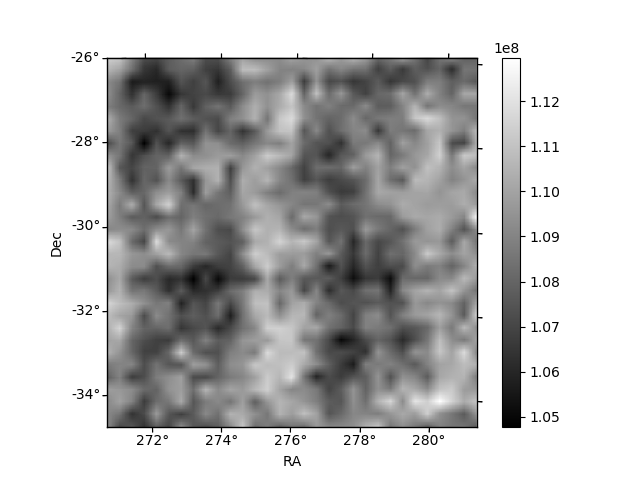
Histogram calculated using DETX and DETY for each event in the final _common_clean file
| Quadrant A | 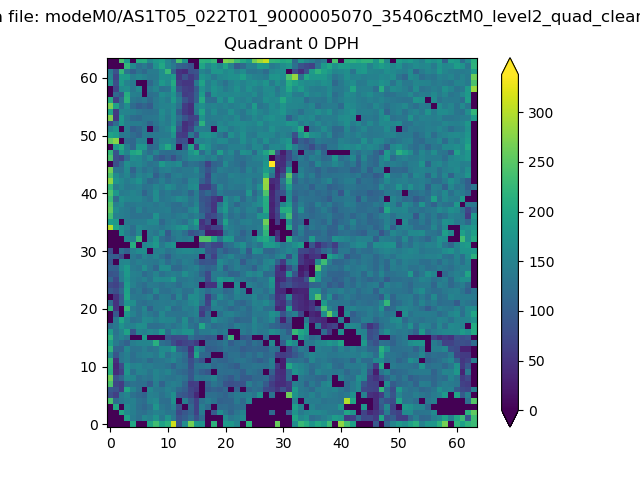 |
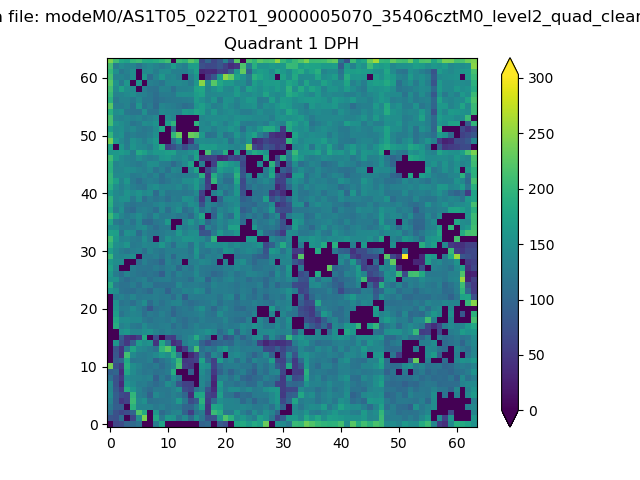 |
Quadrant B |
|---|---|---|---|
| Quadrant D | 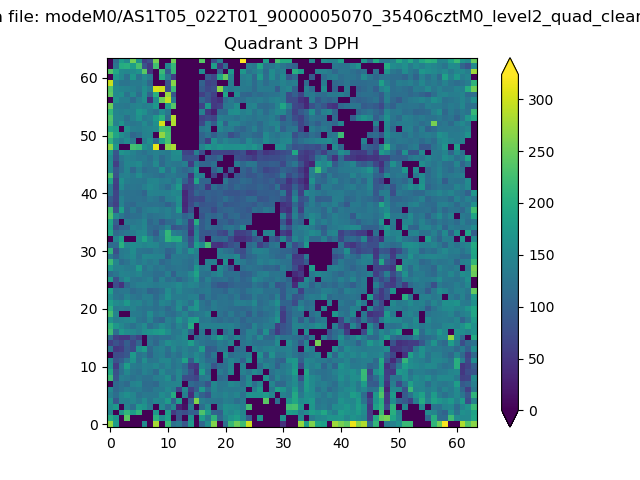 |
 |
Quadrant C |
| Plot type | Count rate plots | Images |
|---|---|---|
| Comparison with Poisson distribution Blue bars denote a histogram of data divided into 1 sec bins. Red curve is a Poisson curve with rate = median count rate of data. |
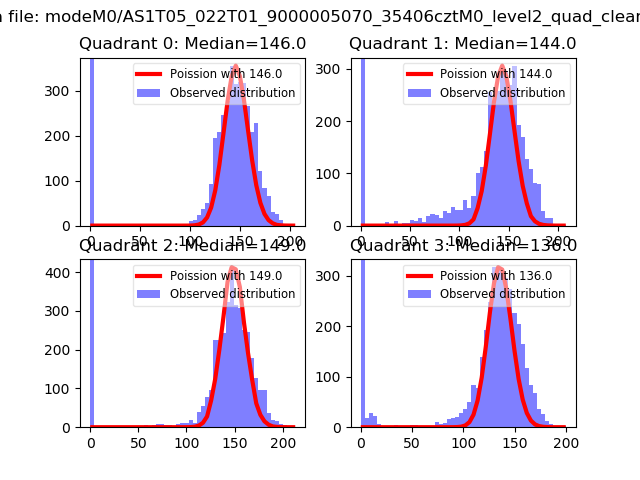 |
 |
| Quadrant-wise count rates Data is divided into 100 sec bins |
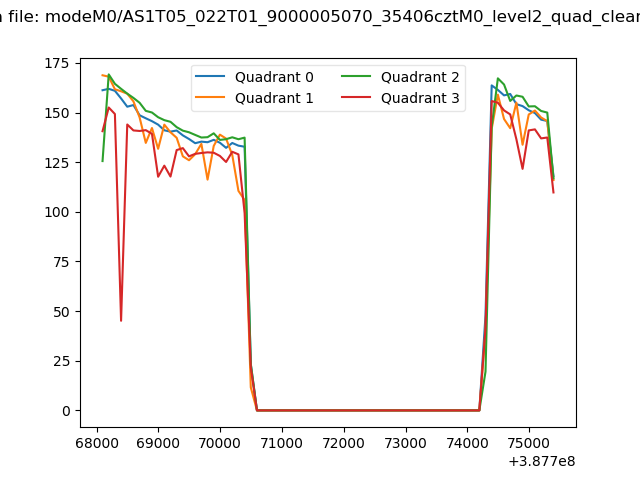 |
|
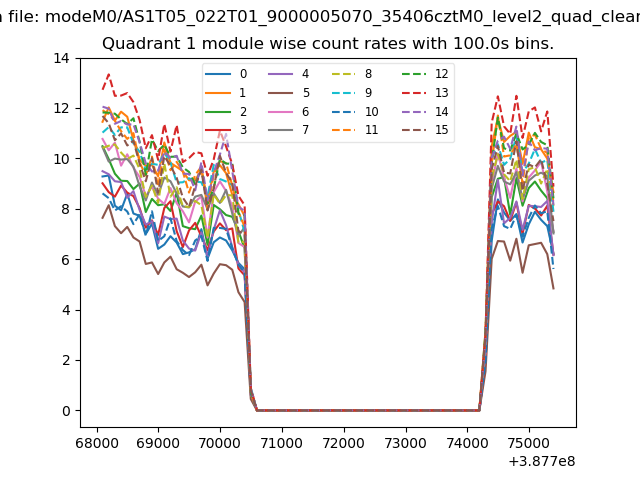
| Module-wise count rates for Quadrant A Data is divided into 100 sec bins |
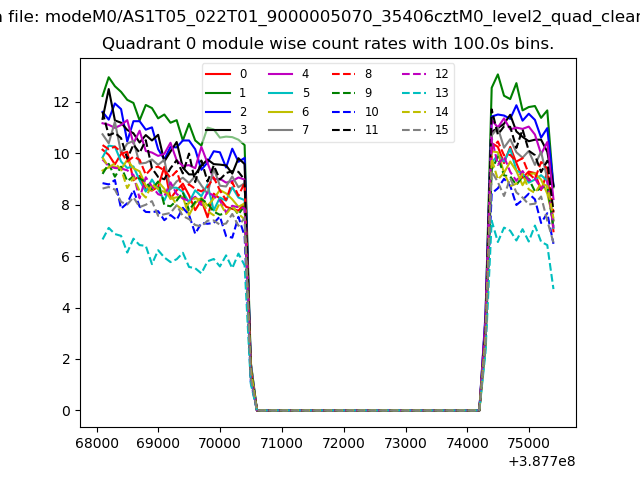 |
 |
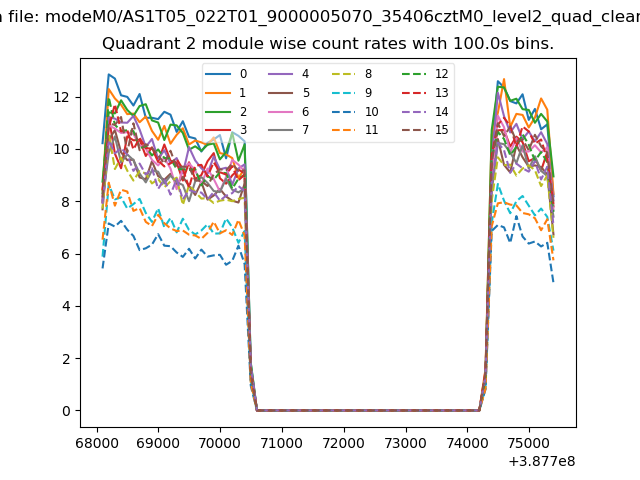
| Module-wise count rates for Quadrant B Data is divided into 100 sec bins |
 |
 |
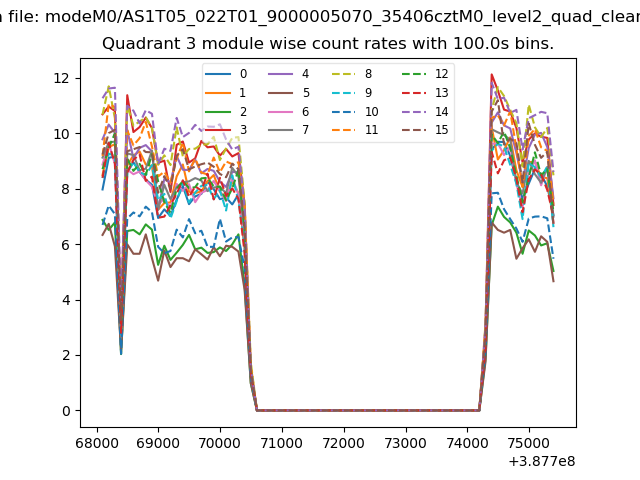
| Module-wise count rates for Quadrant C Data is divided into 100 sec bins |
 |
 |
| Module-wise count rates for Quadrant D Data is divided into 100 sec bins |
 |
 |
| Parameter | Plot |
|---|---|
| CZT HV Monitor | 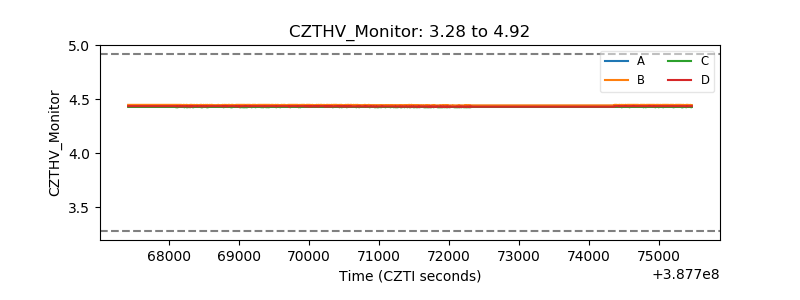 |
| D_VDD | 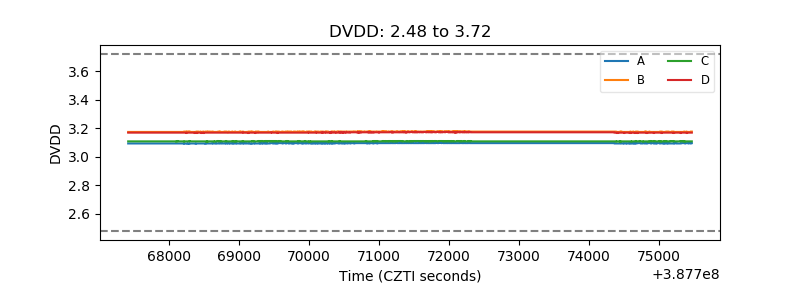 |
| Temperature 1 | 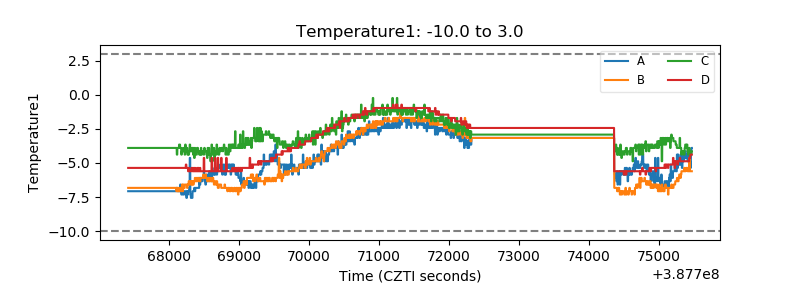 |
| Veto HV Monitor | 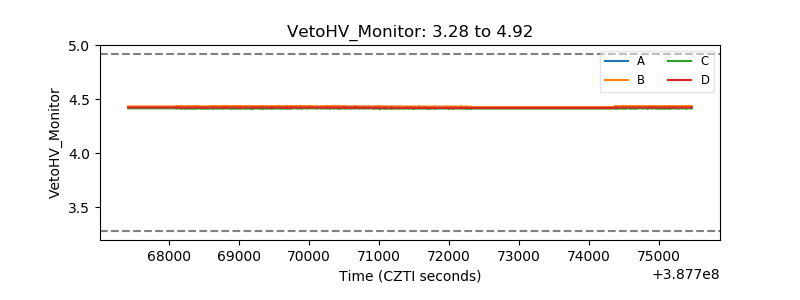 |
| Veto LLD | 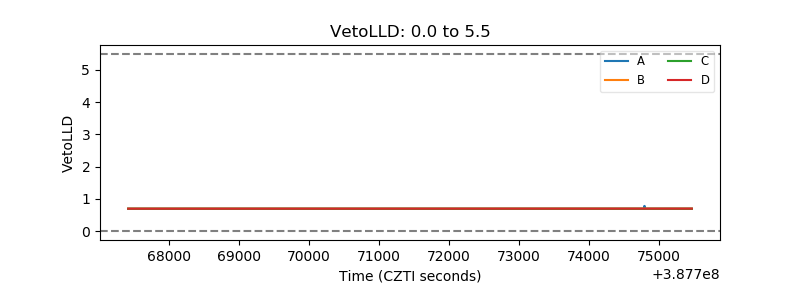 |
| Alpha Counter | 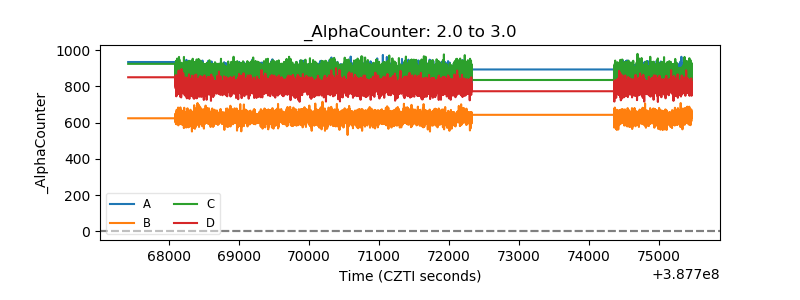 |
| _CPM_Rate | 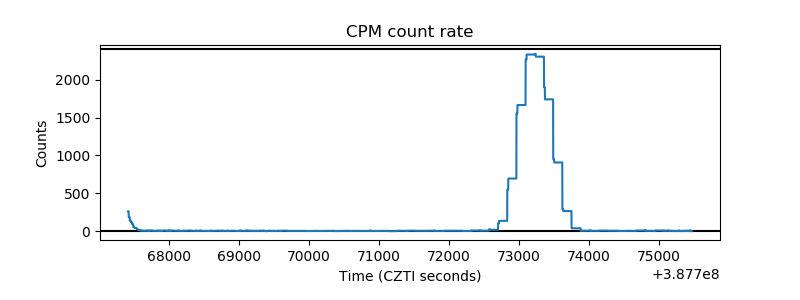 |
| CZT Counter | 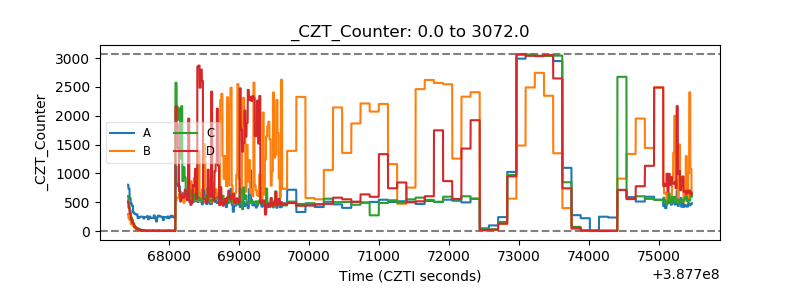 |
| +2.5 Volts monitor | 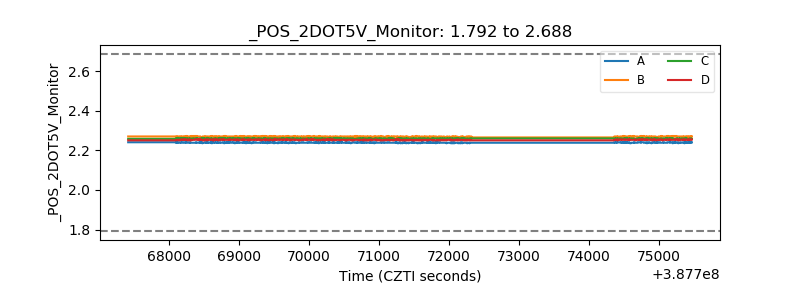 |
| +5 Volts monitor | 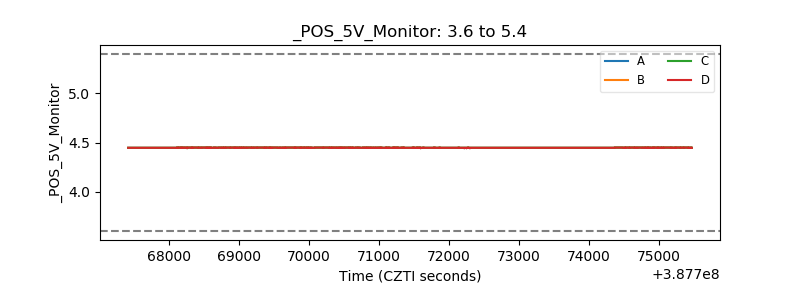 |
| _ROLL_ROT | 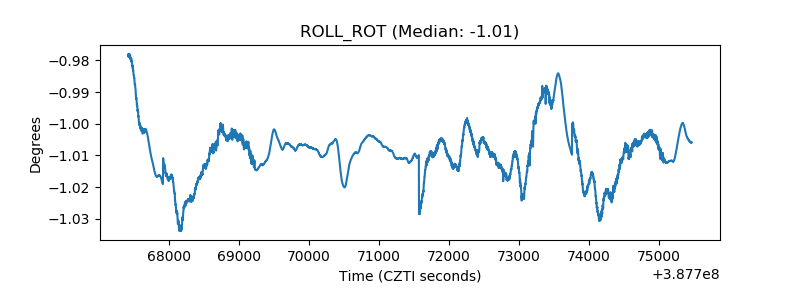 |
| _Roll_DEC | 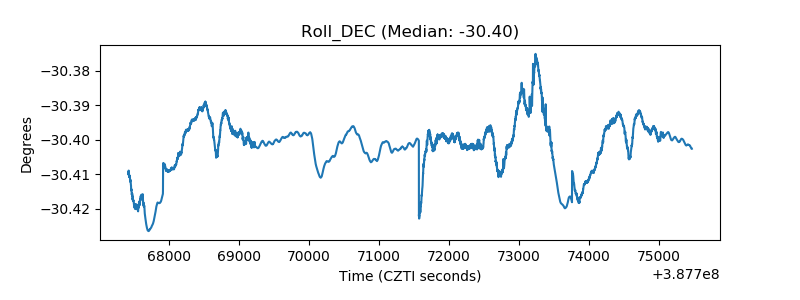 |
| _Roll_RA | 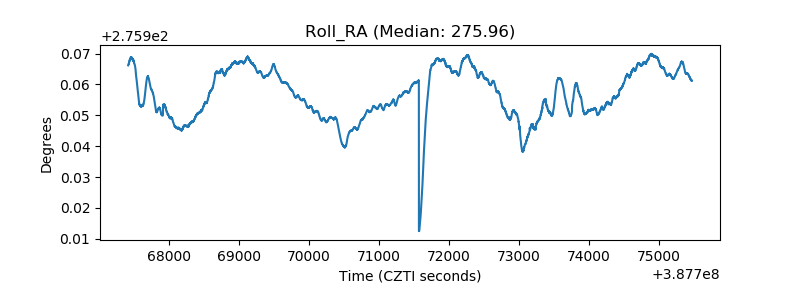 |
| Veto Counter | 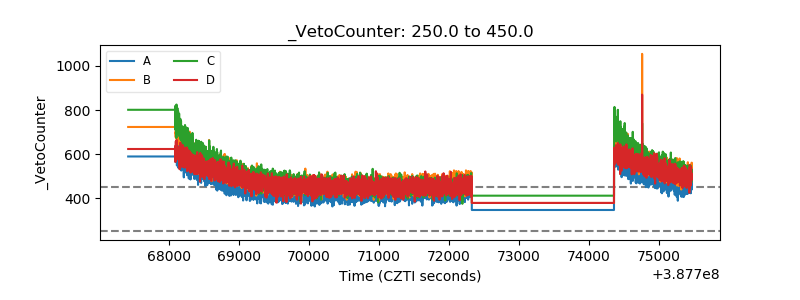 |