| Param | Original file | Final file |
|---|---|---|
| Filename | modeM0/AS1T05_022T01_9000005070_35405cztM0_level2.evt | modeM0/AS1T05_022T01_9000005070_35405cztM0_level2_quad_clean.evt |
| Size (bytes) | 593,504,640 | 83,966,400 |
| Size | 566.0 MB | 80.1 MB |
| Events in quadrant A | 2,754,912 | 564,644 |
| Events in quadrant B | 3,889,578 | 573,412 |
| Events in quadrant C | 3,222,448 | 570,928 |
| Events in quadrant D | 7,735,369 | 448,753 |
| Mode M0 | |||
|---|---|---|---|
| Quadrant | BADHDUFLAG | Total packets | Discarded packets |
| A | 0 | 11507 | 3 |
| B | 0 | 15159 | 2 |
| C | 0 | 12621 | 2 |
| D | 0 | 26688 | 2 |
| Mode SS | |||
|---|---|---|---|
| Quadrant | BADHDUFLAG | Total packets | Discarded packets |
| A | 0 | 112 | 0 |
| B | 0 | 112 | 0 |
| C | 0 | 112 | 0 |
| D | 0 | 112 | 0 |
| Mode M9 | |||
|---|---|---|---|
| Quadrant | BADHDUFLAG | Total packets | Discarded packets |
| A | 0 | 26 | 0 |
| B | 0 | 26 | 0 |
| C | 0 | 26 | 0 |
| D | 0 | 27 | 0 |
| Quadrant | Total seconds | Saturated seconds | Saturation percentage |
|---|---|---|---|
| A | 5494 | 13 | 0.236622% |
| B | 5494 | 272 | 4.950855% |
| C | 5494 | 114 | 2.074991% |
| D | 5494 | 1839 | 33.472880% |
Noise dominated data is calculated using 1-second bins in cleaned event files. If a bin has >2000 counts, and if more than 50% of those come from <1% of pixels, then it is considered to be noise-dominated and hence unusable.
| Quadrant | # 1 sec bins | Bins with >0 counts | Bins with >2000 counts | High rate bins dominated by noise | Noise dominated (total time) | Noise dominated (detector-on time) | Marked lightcurve |
|---|---|---|---|---|---|---|---|
| A | 7436 | 5495 | 1 | 1 | 0.01% | 0.02% | 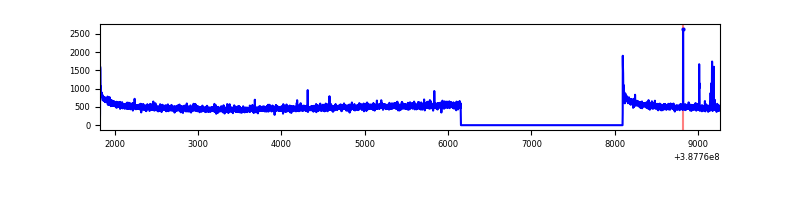 |
| B | 7436 | 5495 | 207 | 207 | 2.78% | 3.77% | 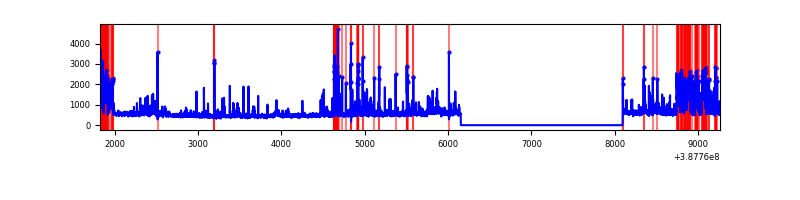 |
| C | 7436 | 5495 | 80 | 80 | 1.08% | 1.46% | 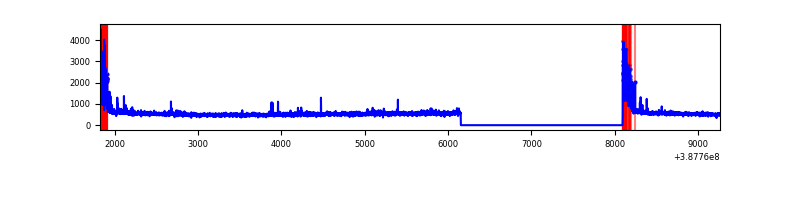 |
| D | 7436 | 5495 | 1510 | 1510 | 20.31% | 27.48% | 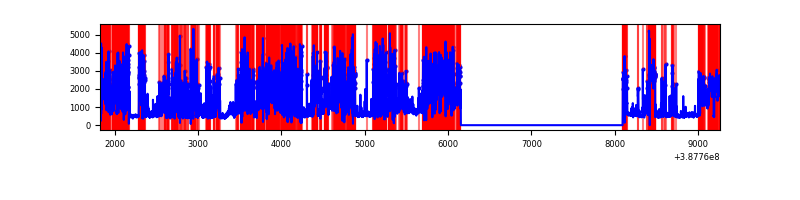 |
Top three noisy pixels from each quadrant. If the there are fewer than three noisy pixels in the level2.evt file, extra rows are filled as -1
| Pixel properties | Quadrant properties | ||||||
|---|---|---|---|---|---|---|---|
| Quadrant | DetID | PixID | Counts | Sigma | Mean | Median | Sigma |
| A | 10 | 83 | 126663 | 932.12 | 671 | 659 | 135.2 |
| A | 9 | 143 | 21067 | 150.97 | 671 | 659 | 135.2 |
| A | 13 | 6 | 13908 | 98.01 | 671 | 659 | 135.2 |
| B | 4 | 251 | 604023 | 4796.61 | 663 | 645 | 125.8 |
| B | 5 | 172 | 257173 | 2039.29 | 663 | 645 | 125.8 |
| B | 5 | 236 | 164276 | 1300.8 | 663 | 645 | 125.8 |
| C | 0 | 10 | 374932 | 2435.15 | 666 | 671 | 153.7 |
| C | 15 | 214 | 226205 | 1467.45 | 666 | 671 | 153.7 |
| C | 14 | 67 | 10513 | 64.04 | 666 | 671 | 153.7 |
| D | 7 | 80 | 4686690 | 35131.83 | 548 | 534 | 133.4 |
| D | 1 | 47 | 435737 | 3262.69 | 548 | 534 | 133.4 |
| D | 13 | 249 | 188724 | 1410.85 | 548 | 534 | 133.4 |
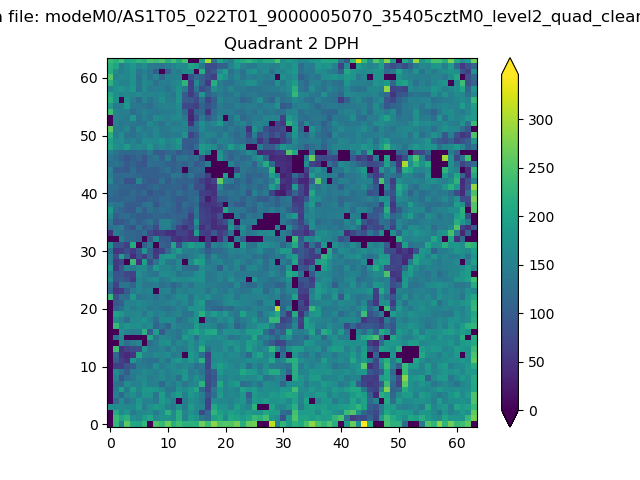
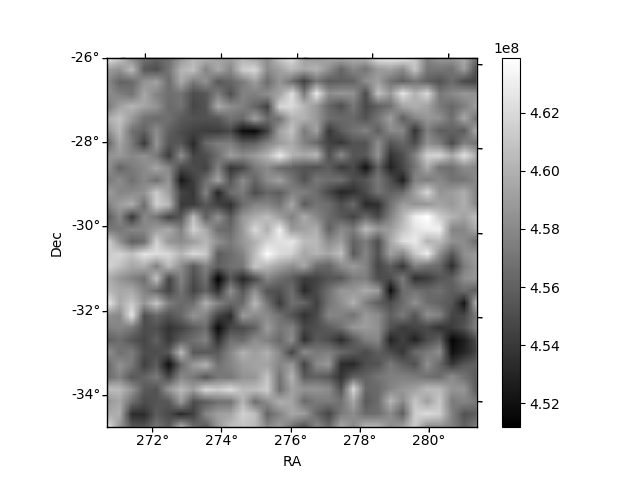
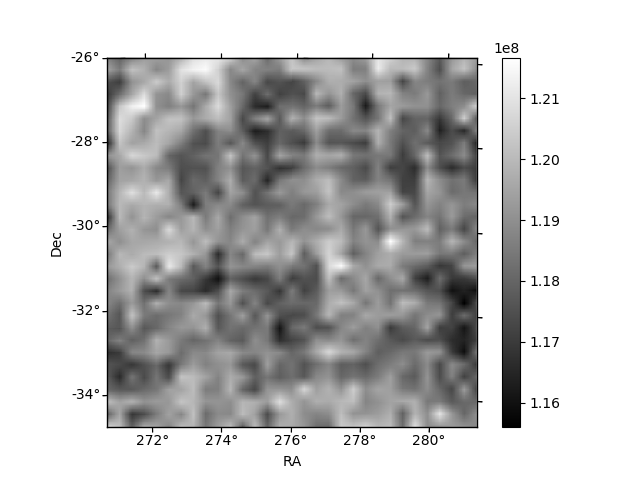
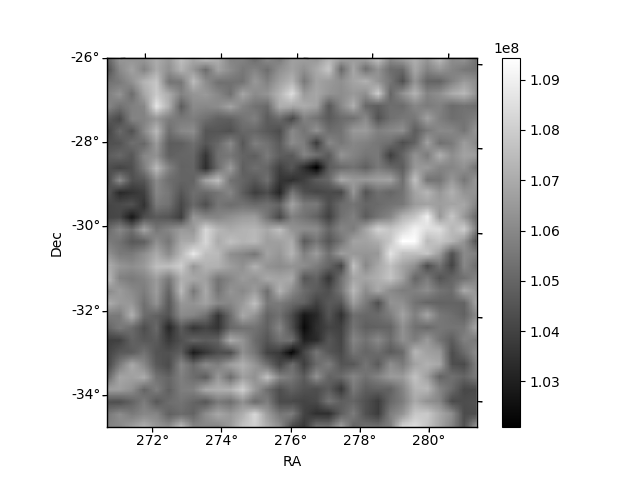
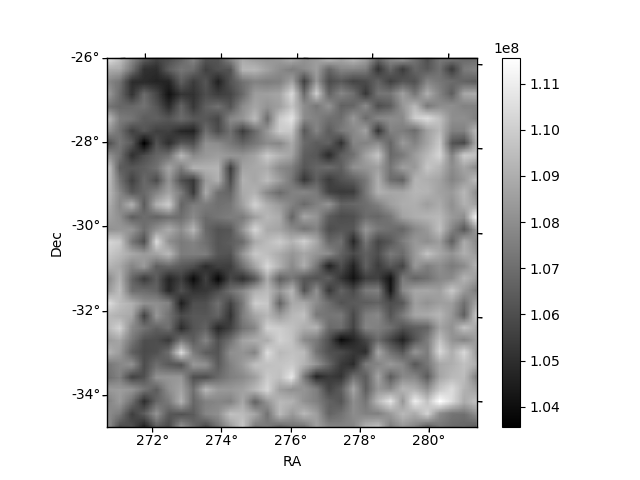
Histogram calculated using DETX and DETY for each event in the final _common_clean file
| Quadrant A | 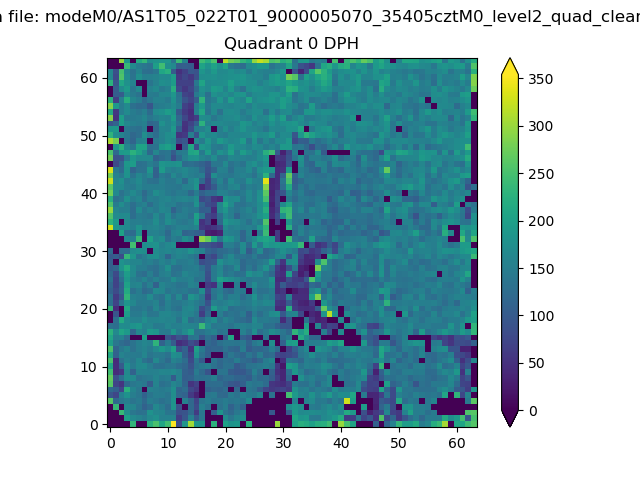 |
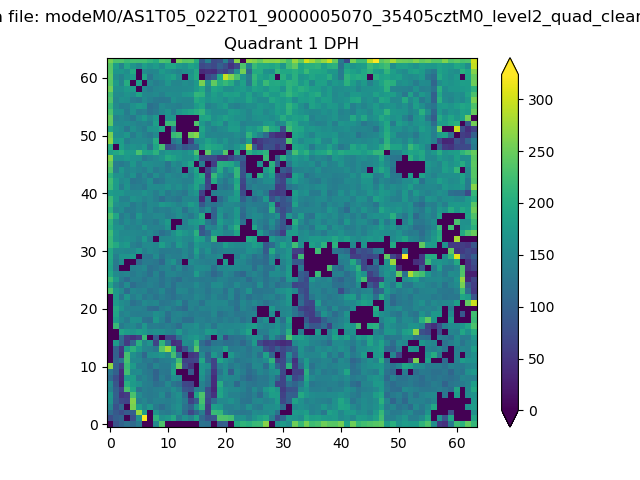 |
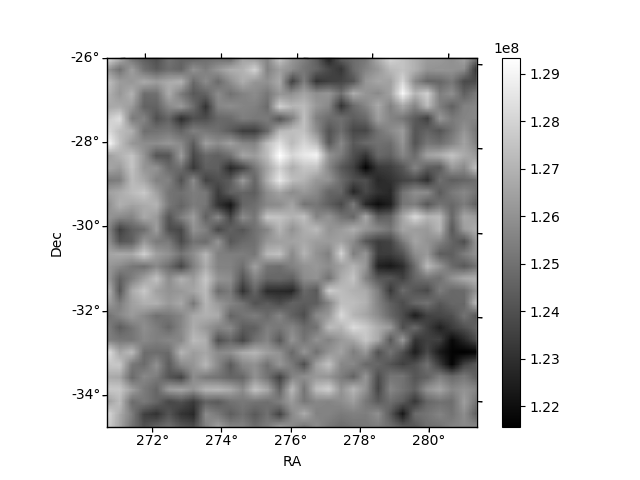
Quadrant B |
|---|---|---|---|
| Quadrant D | 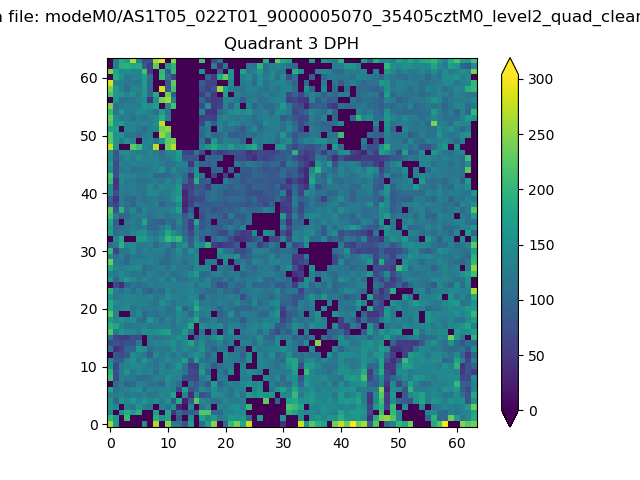 |
 |
Quadrant C |
| Plot type | Count rate plots | Images |
|---|---|---|
| Comparison with Poisson distribution Blue bars denote a histogram of data divided into 1 sec bins. Red curve is a Poisson curve with rate = median count rate of data. |
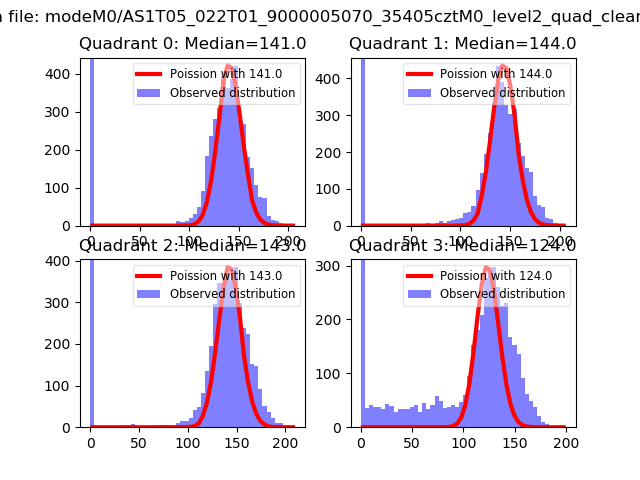 |
 |
| Quadrant-wise count rates Data is divided into 100 sec bins |
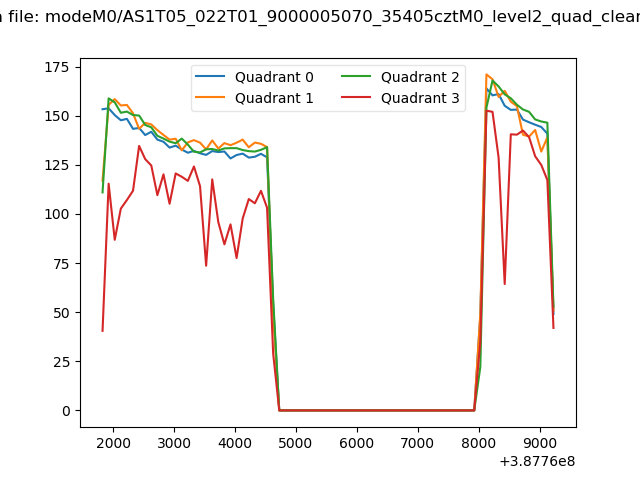 |
|
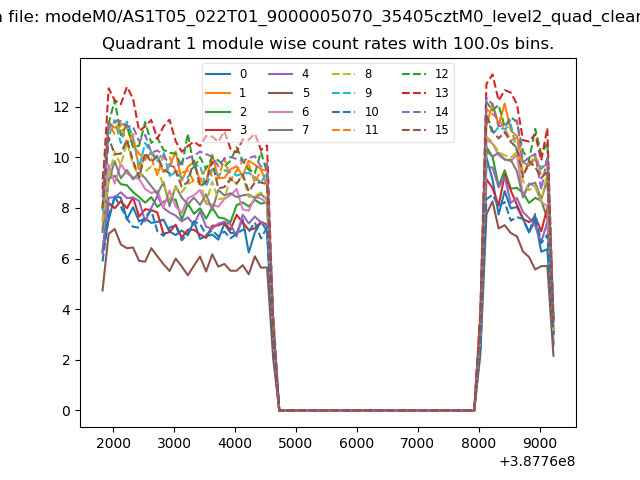
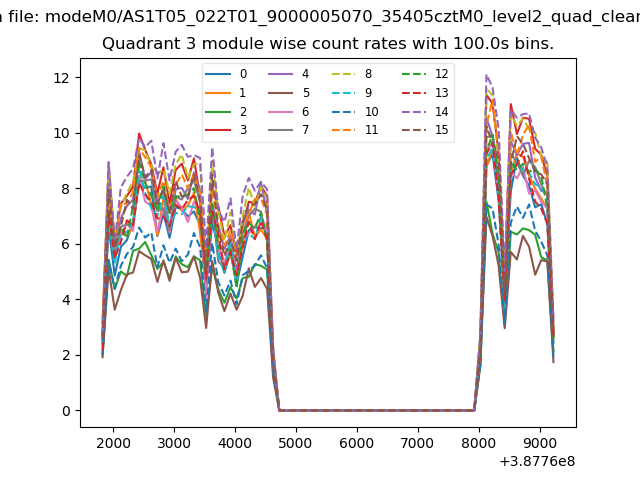
| Module-wise count rates for Quadrant A Data is divided into 100 sec bins |
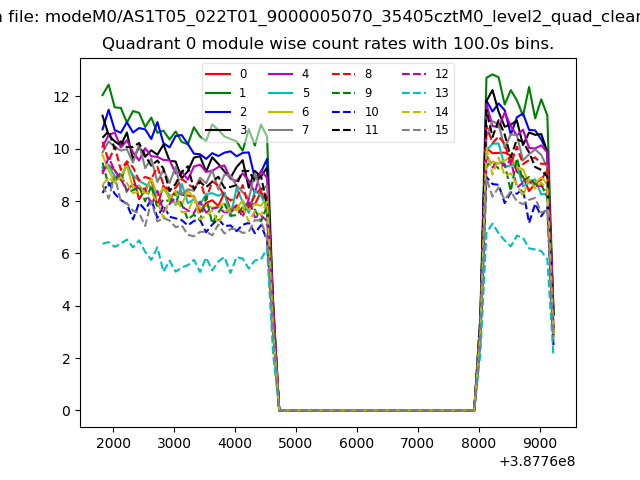 |
 |
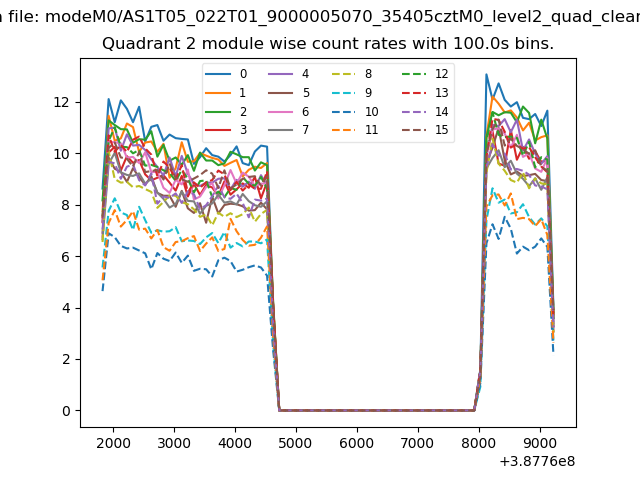
| Module-wise count rates for Quadrant B Data is divided into 100 sec bins |
 |
 |
| Module-wise count rates for Quadrant C Data is divided into 100 sec bins |
 |
 |
| Module-wise count rates for Quadrant D Data is divided into 100 sec bins |
 |
 |
| Parameter | Plot |
|---|---|
| CZT HV Monitor |  |
| D_VDD | 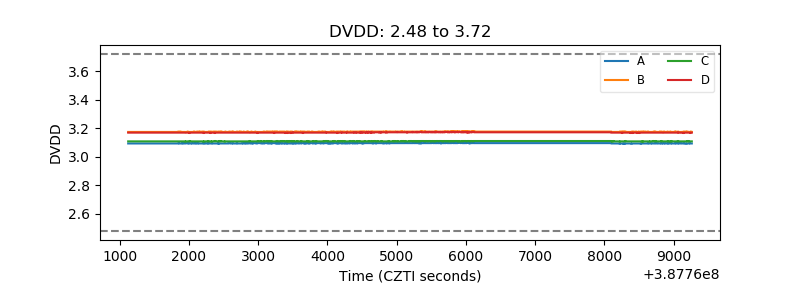 |
| Temperature 1 | 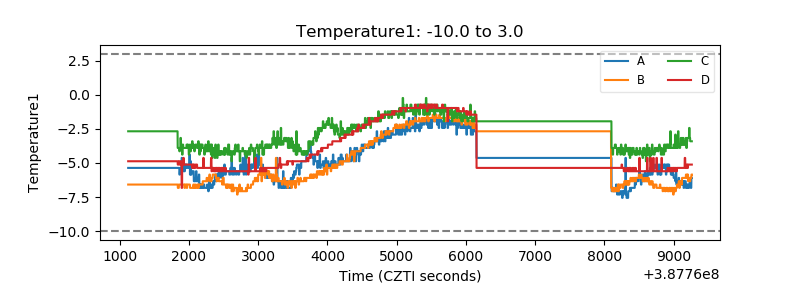 |
| Veto HV Monitor | 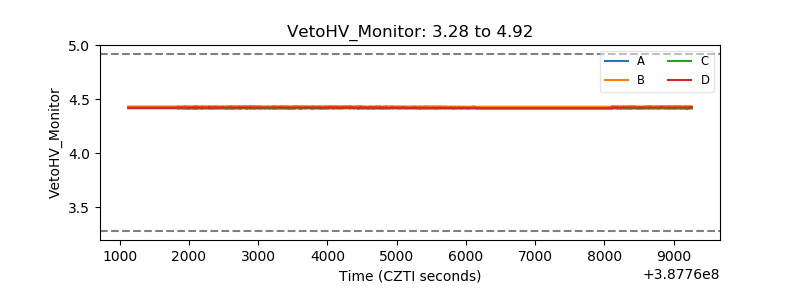 |
| Veto LLD | 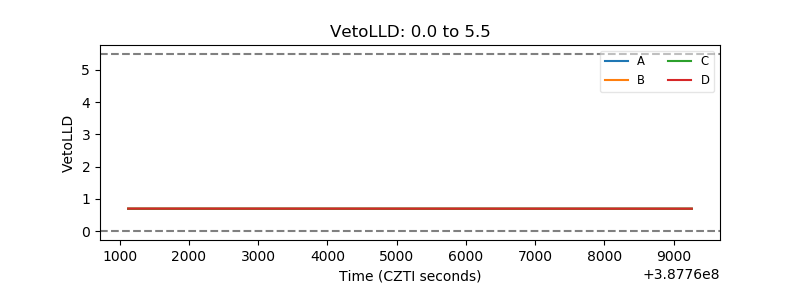 |
| Alpha Counter | 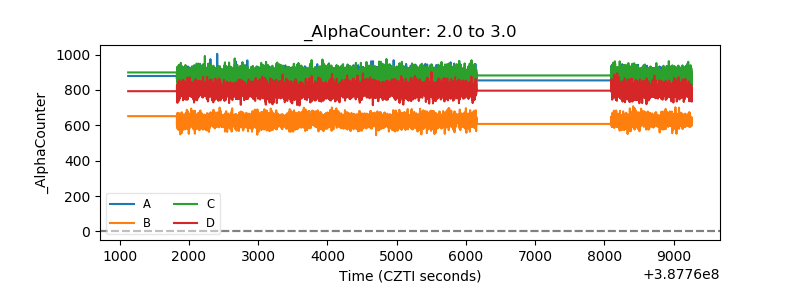 |
| _CPM_Rate | 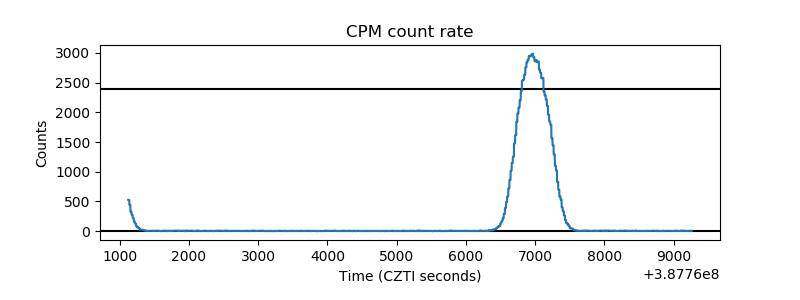 |
| CZT Counter | 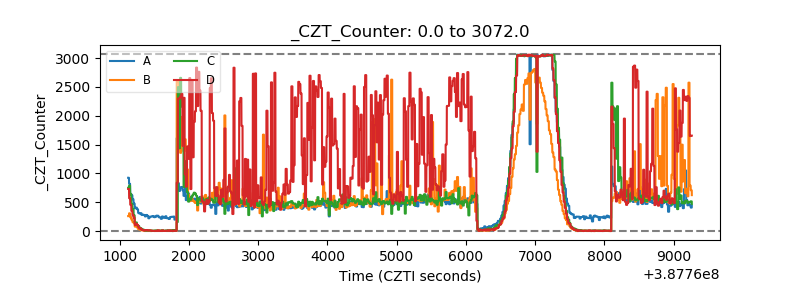 |
| +2.5 Volts monitor | 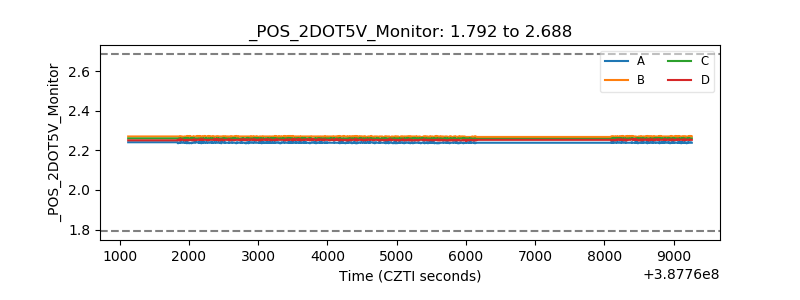 |
| +5 Volts monitor | 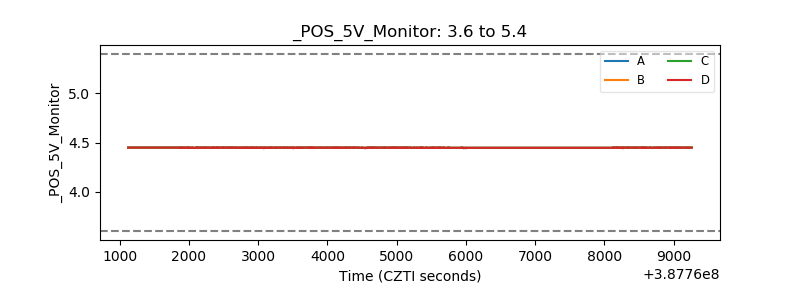 |
| _ROLL_ROT | 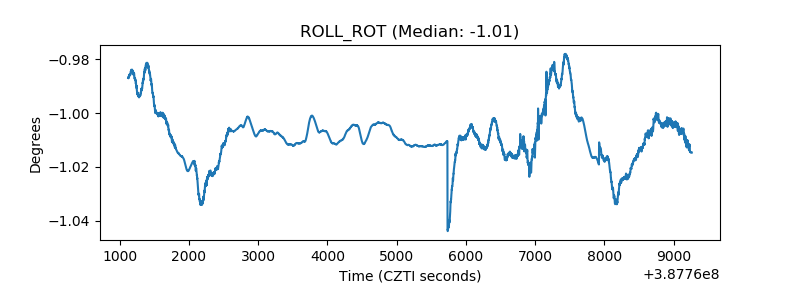 |
| _Roll_DEC | 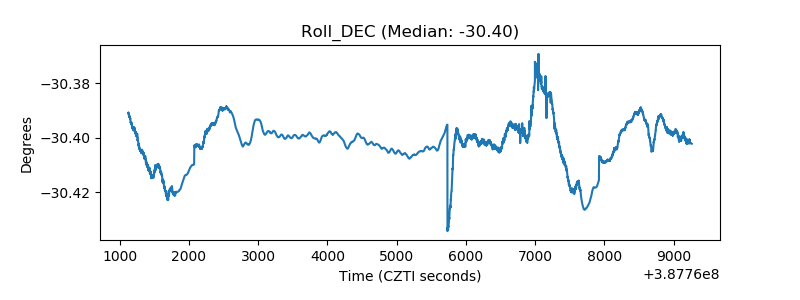 |
| _Roll_RA | 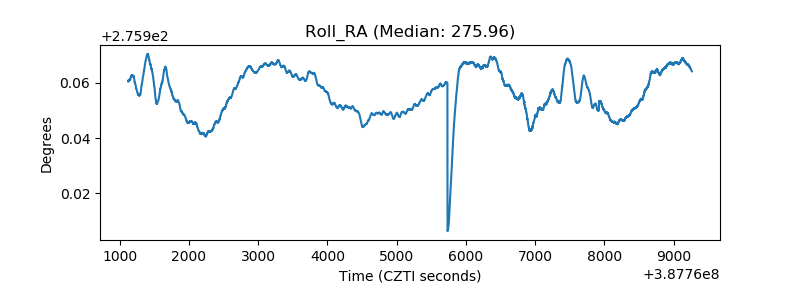 |
| Veto Counter | 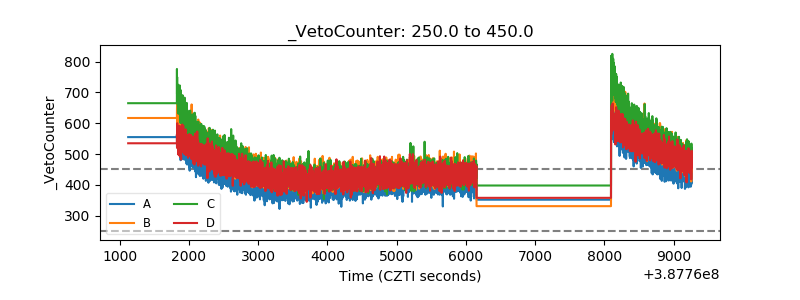 |