| Param | Original file | Final file |
|---|---|---|
| Filename | modeM0/AS1T05_022T01_9000005070_35402cztM0_level2.evt | modeM0/AS1T05_022T01_9000005070_35402cztM0_level2_quad_clean.evt |
| Size (bytes) | 656,792,640 | 81,573,120 |
| Size | 626.4 MB | 77.8 MB |
| Events in quadrant A | 2,615,125 | 574,253 |
| Events in quadrant B | 6,888,029 | 535,485 |
| Events in quadrant C | 3,955,948 | 535,231 |
| Events in quadrant D | 6,064,827 | 444,401 |
| Mode M0 | |||
|---|---|---|---|
| Quadrant | BADHDUFLAG | Total packets | Discarded packets |
| A | 0 | 11299 | 3 |
| B | 0 | 24194 | 2 |
| C | 0 | 14917 | 2 |
| D | 0 | 21712 | 2 |
| Mode SS | |||
|---|---|---|---|
| Quadrant | BADHDUFLAG | Total packets | Discarded packets |
| A | 0 | 112 | 0 |
| B | 0 | 112 | 0 |
| C | 0 | 112 | 0 |
| D | 0 | 112 | 0 |
| Mode M9 | |||
|---|---|---|---|
| Quadrant | BADHDUFLAG | Total packets | Discarded packets |
| A | 0 | 23 | 0 |
| B | 0 | 23 | 0 |
| C | 0 | 23 | 0 |
| D | 0 | 24 | 0 |
| Quadrant | Total seconds | Saturated seconds | Saturation percentage |
|---|---|---|---|
| A | 5420 | 6 | 0.110701% |
| B | 5420 | 1424 | 26.273063% |
| C | 5420 | 492 | 9.077491% |
| D | 5420 | 1257 | 23.191882% |
Noise dominated data is calculated using 1-second bins in cleaned event files. If a bin has >2000 counts, and if more than 50% of those come from <1% of pixels, then it is considered to be noise-dominated and hence unusable.
| Quadrant | # 1 sec bins | Bins with >0 counts | Bins with >2000 counts | High rate bins dominated by noise | Noise dominated (total time) | Noise dominated (detector-on time) | Marked lightcurve |
|---|---|---|---|---|---|---|---|
| A | 7122 | 5421 | 1 | 1 | 0.01% | 0.02% | 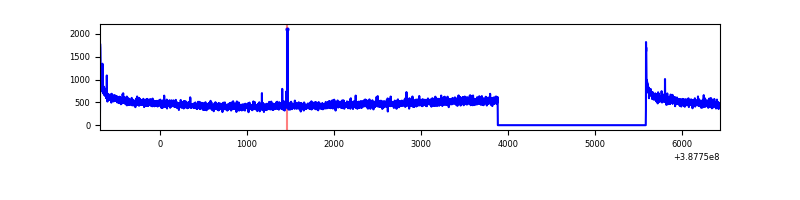 |
| B | 7122 | 5421 | 1099 | 1099 | 15.43% | 20.27% | 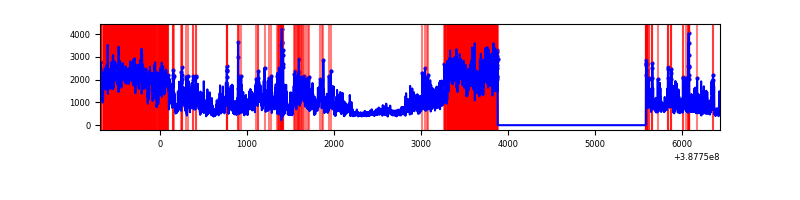 |
| C | 7122 | 5421 | 397 | 397 | 5.57% | 7.32% | 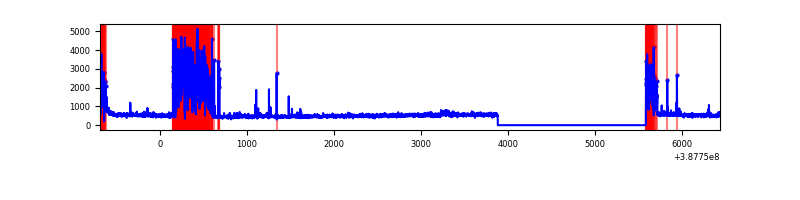 |
| D | 7122 | 5421 | 965 | 965 | 13.55% | 17.80% | 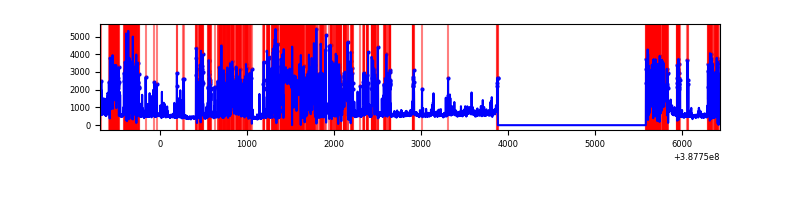 |
Top three noisy pixels from each quadrant. If the there are fewer than three noisy pixels in the level2.evt file, extra rows are filled as -1
| Pixel properties | Quadrant properties | ||||||
|---|---|---|---|---|---|---|---|
| Quadrant | DetID | PixID | Counts | Sigma | Mean | Median | Sigma |
| A | 10 | 83 | 125990 | 971.78 | 636 | 621 | 129.0 |
| A | 13 | 6 | 16982 | 126.82 | 636 | 621 | 129.0 |
| A | 13 | 254 | 8732 | 62.87 | 636 | 621 | 129.0 |
| B | 4 | 251 | 2333925 | 21242.9 | 560 | 545 | 109.8 |
| B | 5 | 14 | 539798 | 4909.31 | 560 | 545 | 109.8 |
| B | 5 | 31 | 526071 | 4784.35 | 560 | 545 | 109.8 |
| C | 0 | 207 | 1062571 | 7608.67 | 596 | 600 | 139.6 |
| C | 0 | 10 | 329061 | 2353.31 | 596 | 600 | 139.6 |
| C | 15 | 214 | 214935 | 1535.64 | 596 | 600 | 139.6 |
| D | 7 | 80 | 2489720 | 18701.08 | 539 | 524 | 133.1 |
| D | 13 | 249 | 715515 | 5371.66 | 539 | 524 | 133.1 |
| D | 8 | 195 | 183867 | 1377.44 | 539 | 524 | 133.1 |
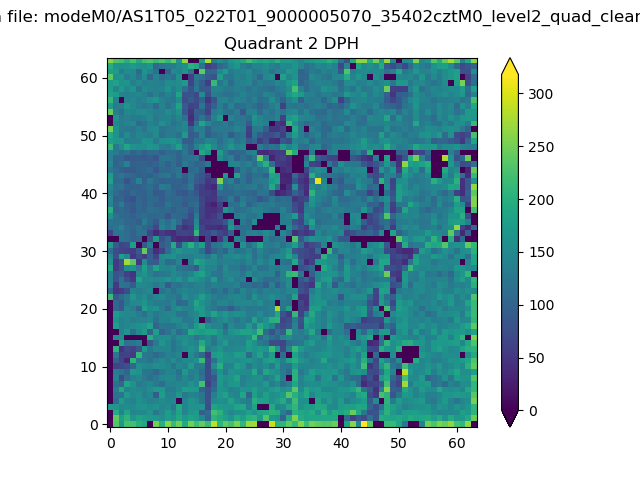
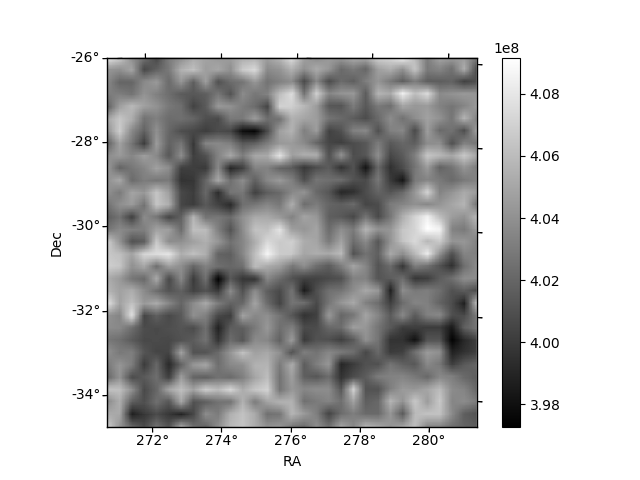
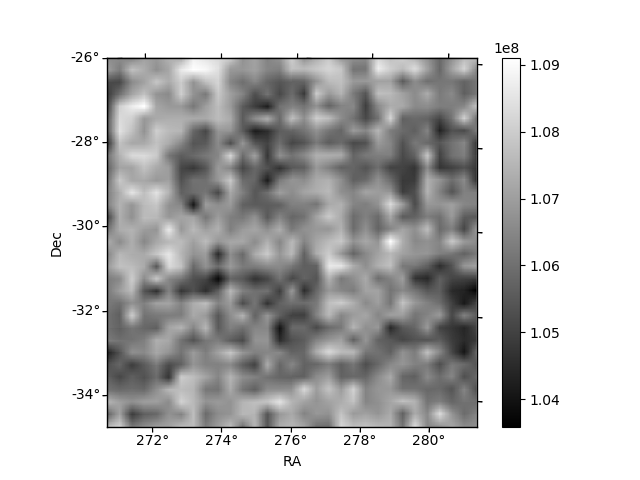
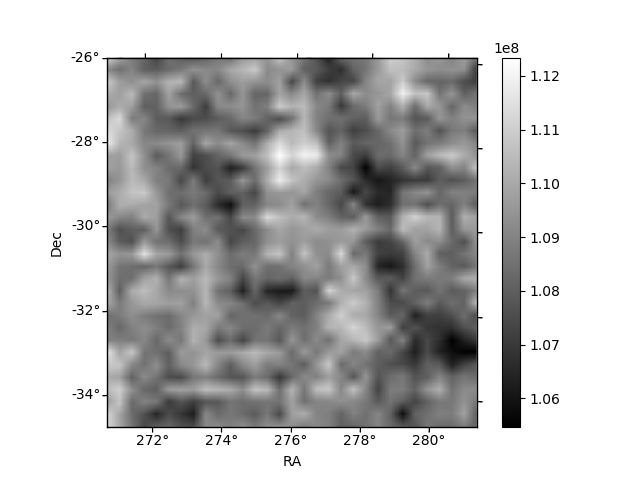
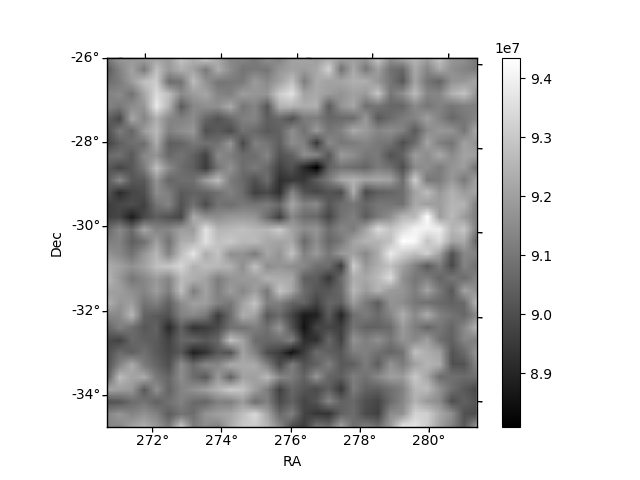
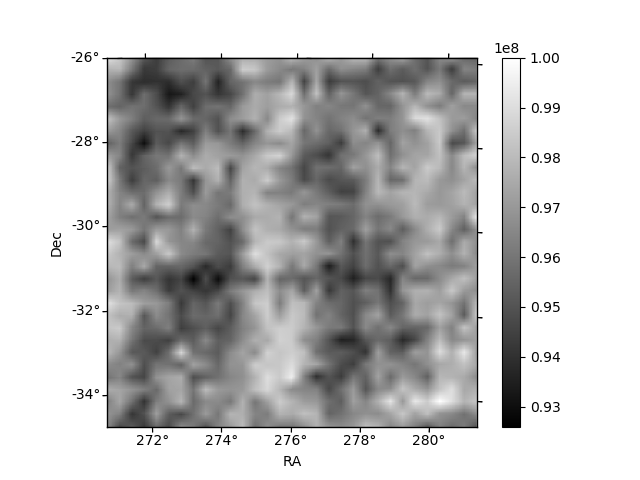
Histogram calculated using DETX and DETY for each event in the final _common_clean file
| Quadrant A | 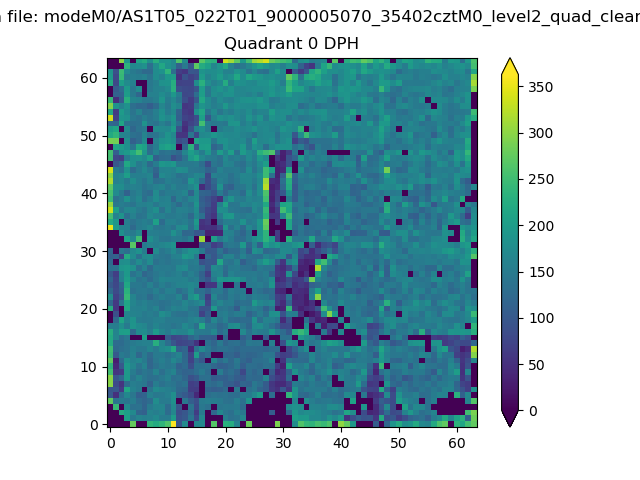 |
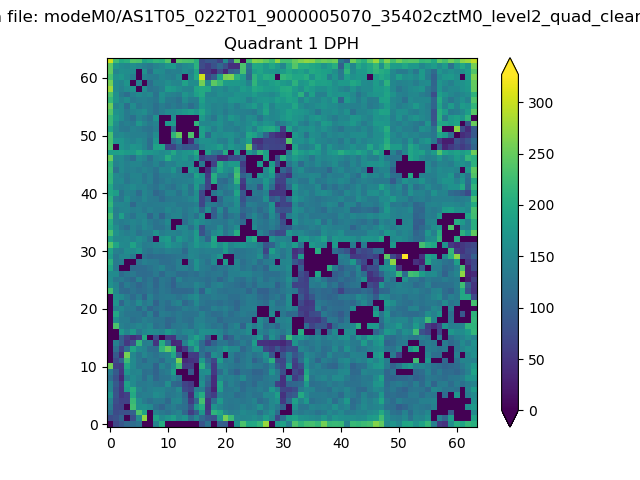 |
Quadrant B |
|---|---|---|---|
| Quadrant D | 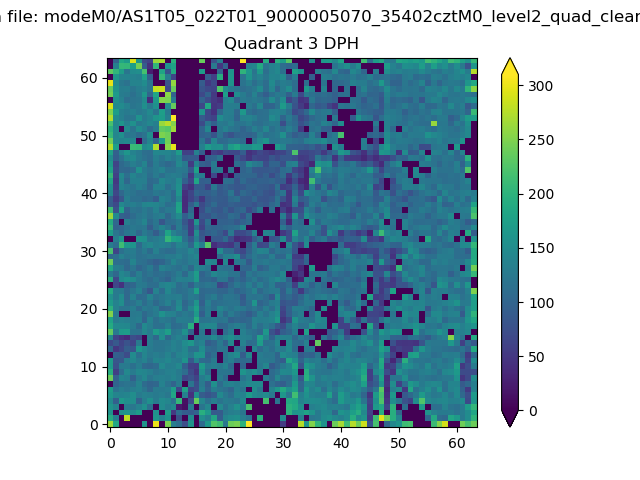 |
 |
Quadrant C |
| Plot type | Count rate plots | Images |
|---|---|---|
| Comparison with Poisson distribution Blue bars denote a histogram of data divided into 1 sec bins. Red curve is a Poisson curve with rate = median count rate of data. |
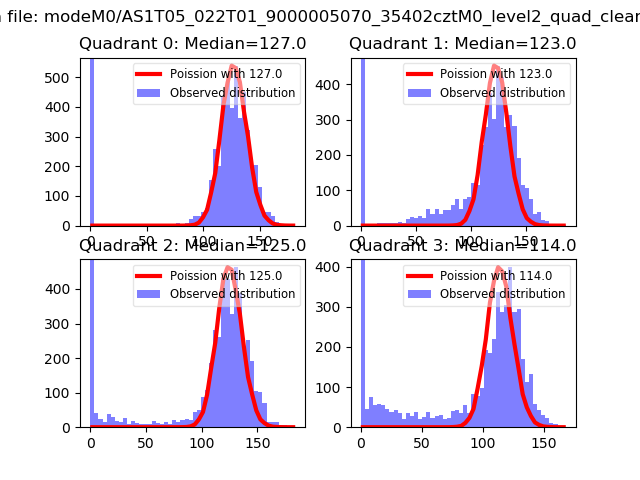 |
 |
| Quadrant-wise count rates Data is divided into 100 sec bins |
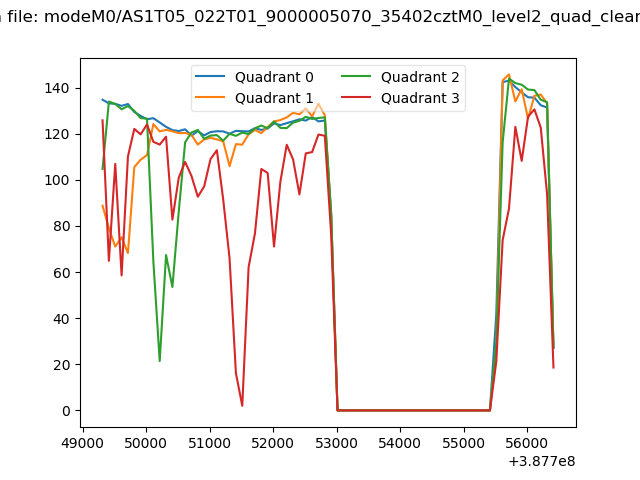 |
|
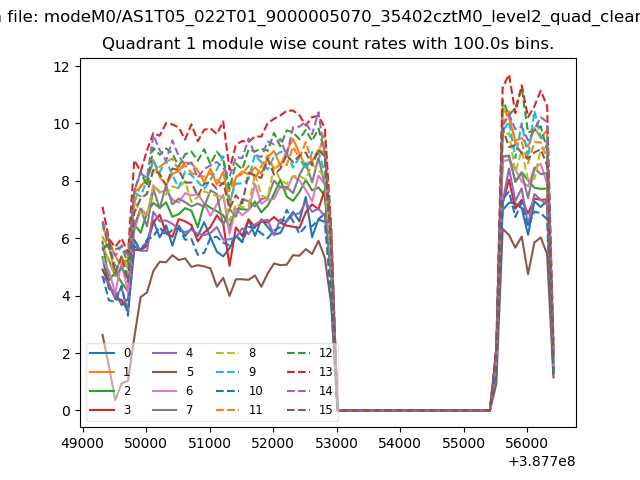
| Module-wise count rates for Quadrant A Data is divided into 100 sec bins |
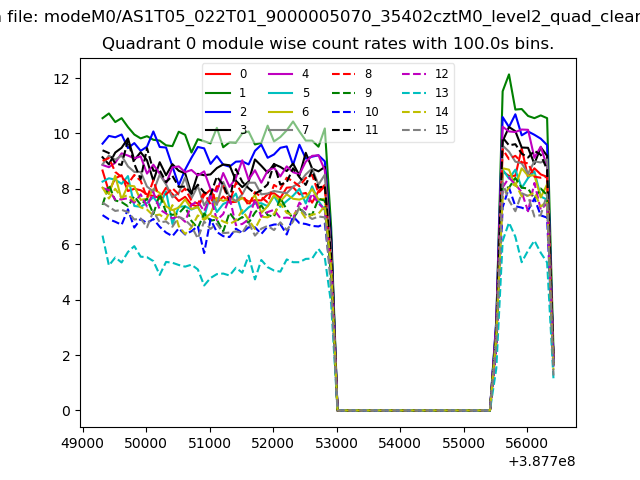 |
 |
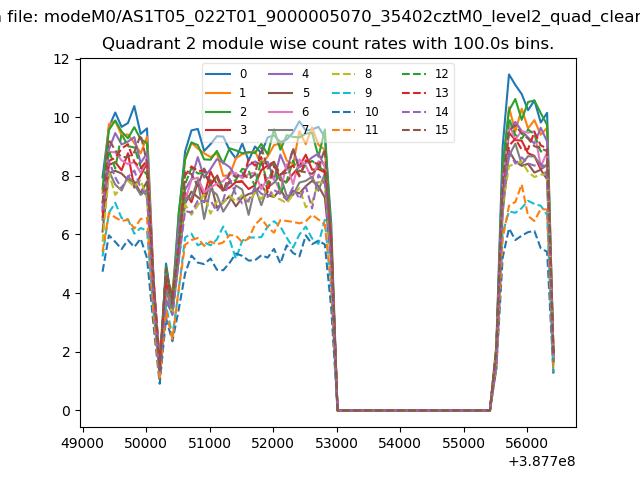
| Module-wise count rates for Quadrant B Data is divided into 100 sec bins |
 |
 |
| Module-wise count rates for Quadrant C Data is divided into 100 sec bins |
 |
 |
| Module-wise count rates for Quadrant D Data is divided into 100 sec bins |
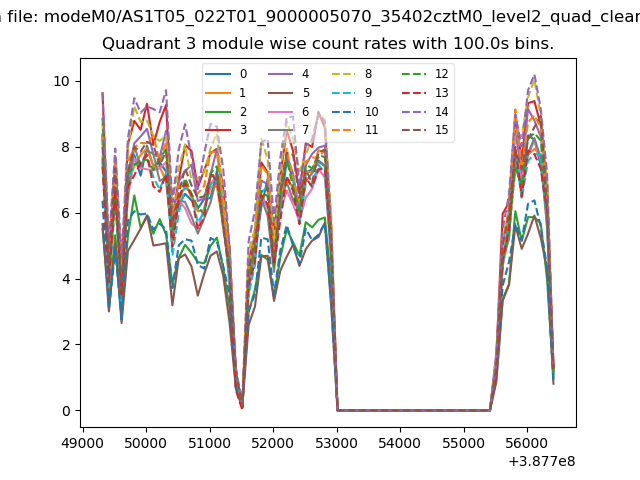 |
 |
| Parameter | Plot |
|---|---|
| CZT HV Monitor | 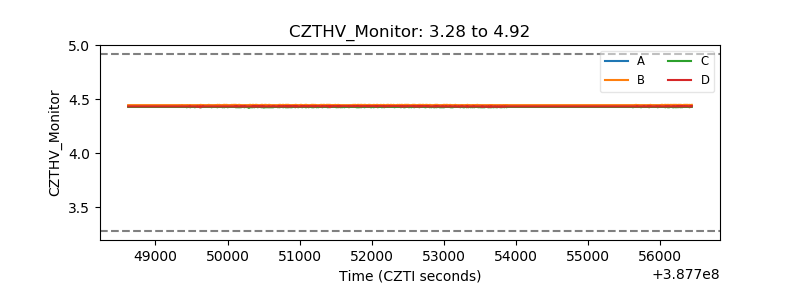 |
| D_VDD | 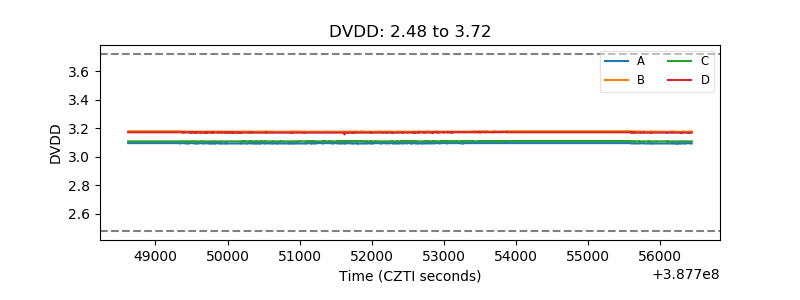 |
| Temperature 1 | 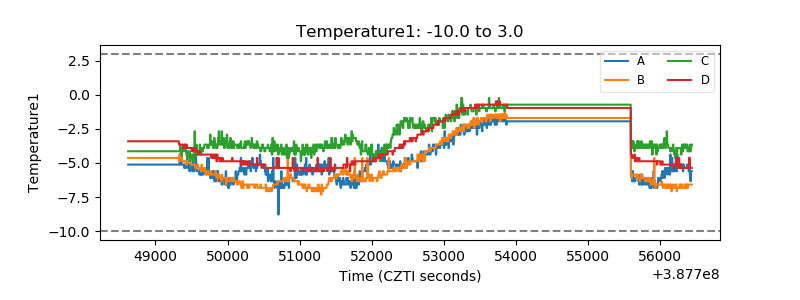 |
| Veto HV Monitor |  |
| Veto LLD | 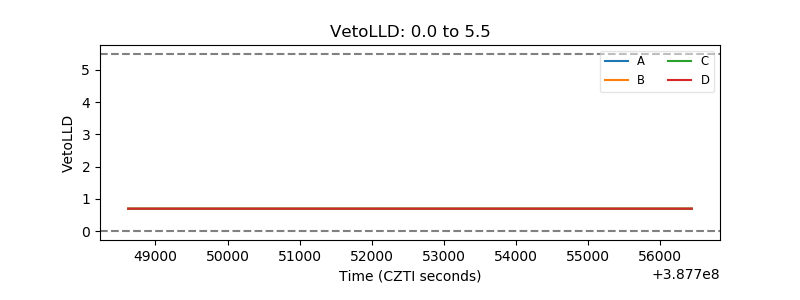 |
| Alpha Counter | 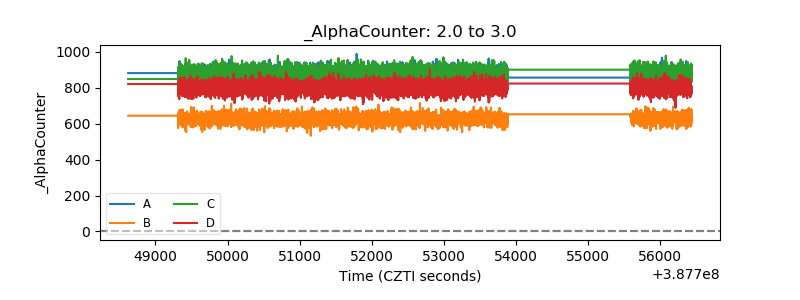 |
| _CPM_Rate | 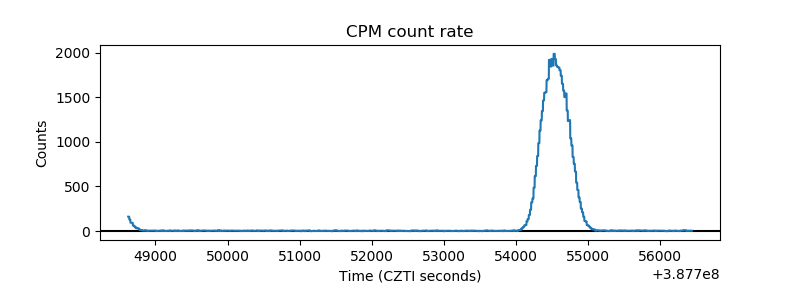 |
| CZT Counter | 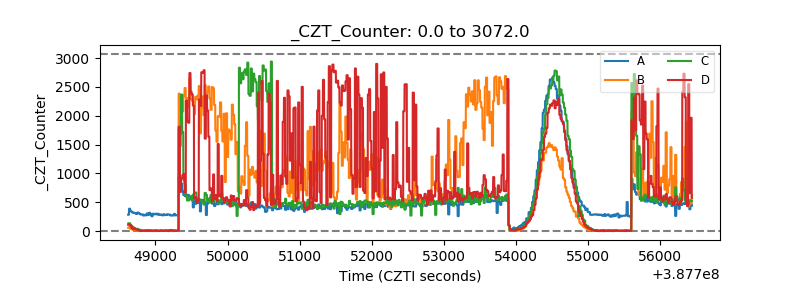 |
| +2.5 Volts monitor | 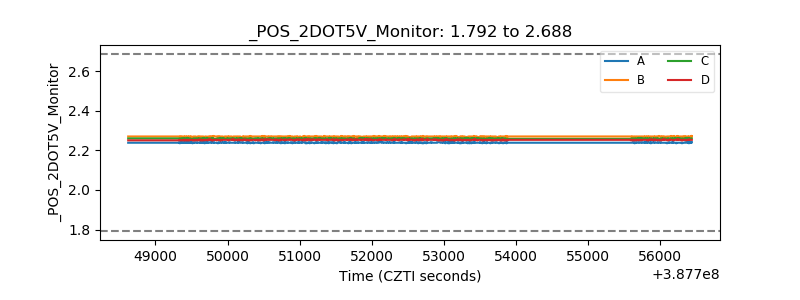 |
| +5 Volts monitor | 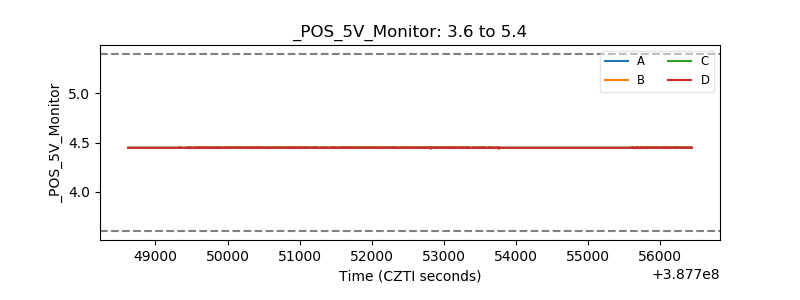 |
| _ROLL_ROT | 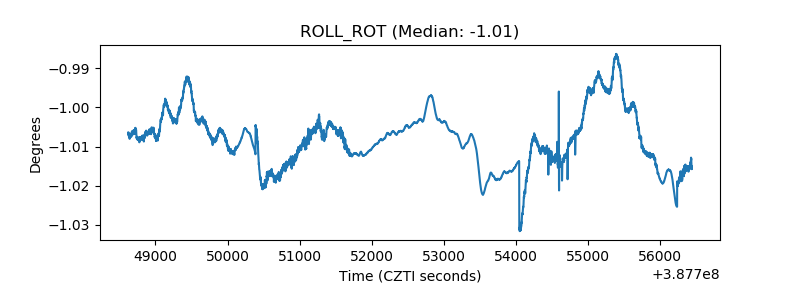 |
| _Roll_DEC | 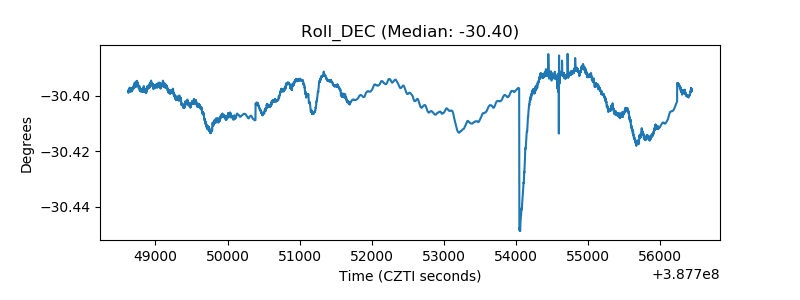 |
| _Roll_RA | 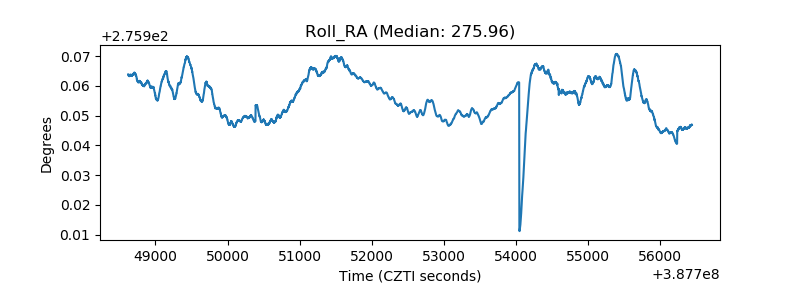 |
| Veto Counter | 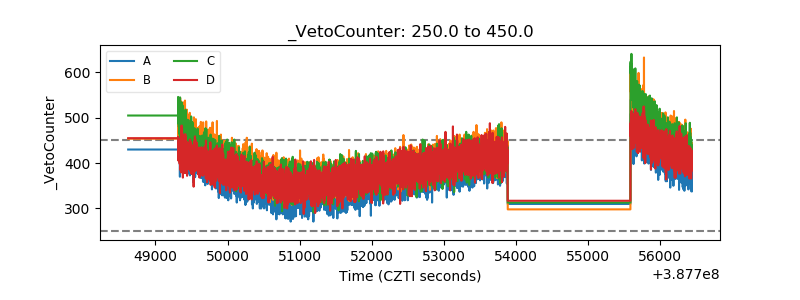 |