| Param | Original file | Final file |
|---|---|---|
| Filename | modeM0/AS1T05_022T01_9000005070_35401cztM0_level2.evt | modeM0/AS1T05_022T01_9000005070_35401cztM0_level2_quad_clean.evt |
| Size (bytes) | 745,349,760 | 78,920,640 |
| Size | 710.8 MB | 75.3 MB |
| Events in quadrant A | 2,728,299 | 572,517 |
| Events in quadrant B | 9,280,597 | 437,718 |
| Events in quadrant C | 3,655,648 | 554,418 |
| Events in quadrant D | 6,529,579 | 431,221 |
| Mode M0 | |||
|---|---|---|---|
| Quadrant | BADHDUFLAG | Total packets | Discarded packets |
| A | 0 | 11766 | 3 |
| B | 0 | 31442 | 2 |
| C | 0 | 14294 | 2 |
| D | 0 | 23081 | 2 |
| Mode SS | |||
|---|---|---|---|
| Quadrant | BADHDUFLAG | Total packets | Discarded packets |
| A | 0 | 116 | 0 |
| B | 0 | 116 | 0 |
| C | 0 | 116 | 0 |
| D | 0 | 116 | 0 |
| Mode M9 | |||
|---|---|---|---|
| Quadrant | BADHDUFLAG | Total packets | Discarded packets |
| A | 0 | 18 | 0 |
| B | 0 | 18 | 0 |
| C | 0 | 18 | 0 |
| D | 0 | 19 | 0 |
| Quadrant | Total seconds | Saturated seconds | Saturation percentage |
|---|---|---|---|
| A | 5602 | 5 | 0.089254% |
| B | 5602 | 2712 | 48.411282% |
| C | 5602 | 235 | 4.194930% |
| D | 5602 | 1522 | 27.168868% |
Noise dominated data is calculated using 1-second bins in cleaned event files. If a bin has >2000 counts, and if more than 50% of those come from <1% of pixels, then it is considered to be noise-dominated and hence unusable.
| Quadrant | # 1 sec bins | Bins with >0 counts | Bins with >2000 counts | High rate bins dominated by noise | Noise dominated (total time) | Noise dominated (detector-on time) | Marked lightcurve |
|---|---|---|---|---|---|---|---|
| A | 7183 | 5603 | 0 | 0 | 0.00% | 0.00% | 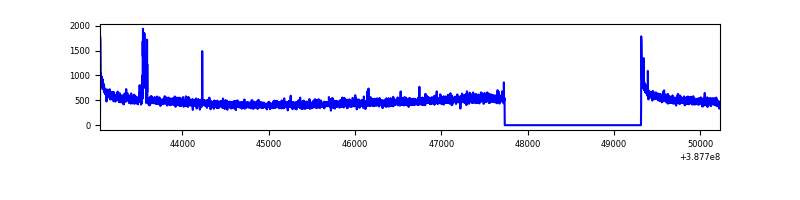 |
| B | 7183 | 5603 | 2297 | 2297 | 31.98% | 41.00% | 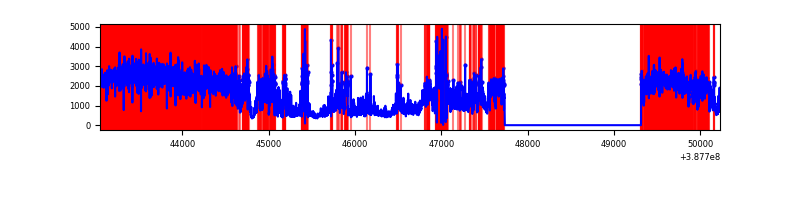 |
| C | 7183 | 5603 | 169 | 169 | 2.35% | 3.02% | 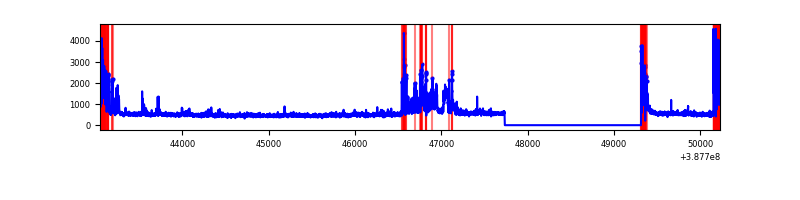 |
| D | 7183 | 5602 | 1165 | 1165 | 16.22% | 20.80% | 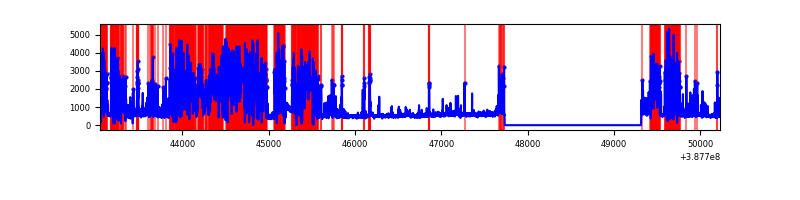 |
Top three noisy pixels from each quadrant. If the there are fewer than three noisy pixels in the level2.evt file, extra rows are filled as -1
| Pixel properties | Quadrant properties | ||||||
|---|---|---|---|---|---|---|---|
| Quadrant | DetID | PixID | Counts | Sigma | Mean | Median | Sigma |
| A | 10 | 83 | 128987 | 967.36 | 655 | 641 | 132.7 |
| A | 9 | 143 | 44406 | 329.86 | 655 | 641 | 132.7 |
| A | 13 | 6 | 17503 | 127.09 | 655 | 641 | 132.7 |
| B | 4 | 251 | 3604678 | 36546.75 | 502 | 488 | 98.6 |
| B | 5 | 14 | 888797 | 9007.52 | 502 | 488 | 98.6 |
| B | 5 | 31 | 847676 | 8590.55 | 502 | 488 | 98.6 |
| C | 0 | 207 | 554333 | 3766.41 | 627 | 633 | 147.0 |
| C | 0 | 10 | 332210 | 2255.47 | 627 | 633 | 147.0 |
| C | 15 | 214 | 228387 | 1549.24 | 627 | 633 | 147.0 |
| D | 7 | 80 | 3501291 | 26138.53 | 540 | 523 | 133.9 |
| D | 13 | 249 | 283870 | 2115.61 | 540 | 523 | 133.9 |
| D | 8 | 195 | 138424 | 1029.64 | 540 | 523 | 133.9 |
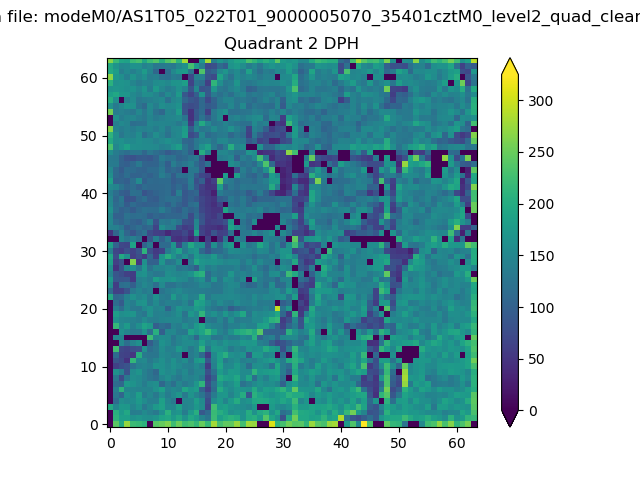
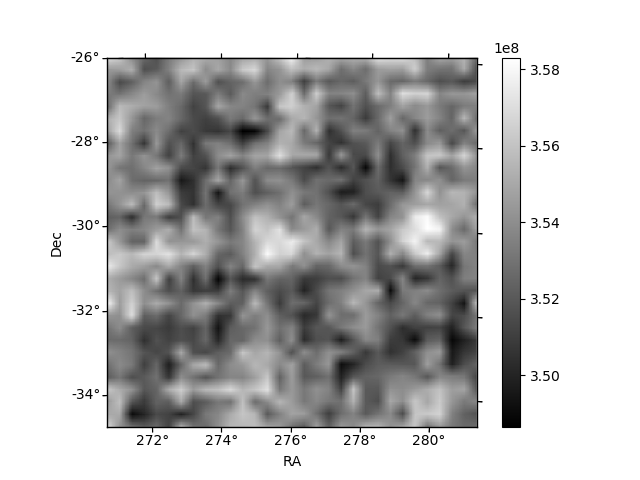
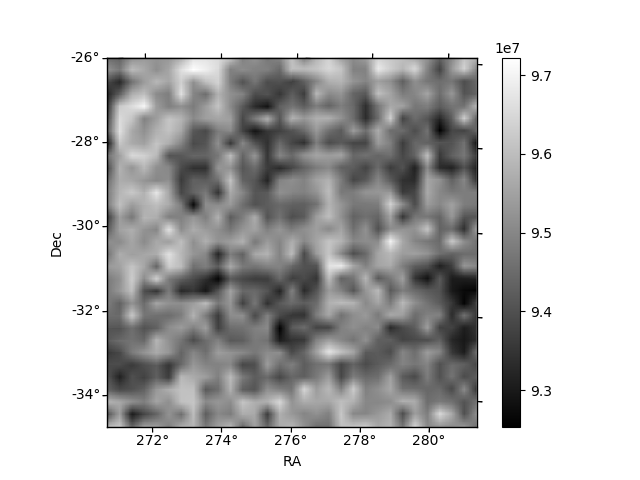
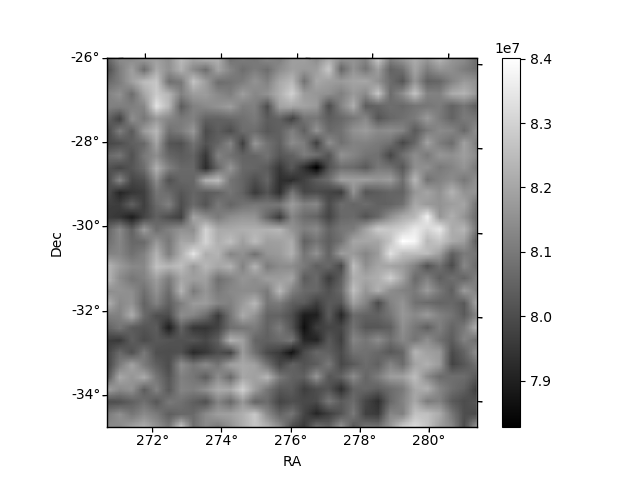
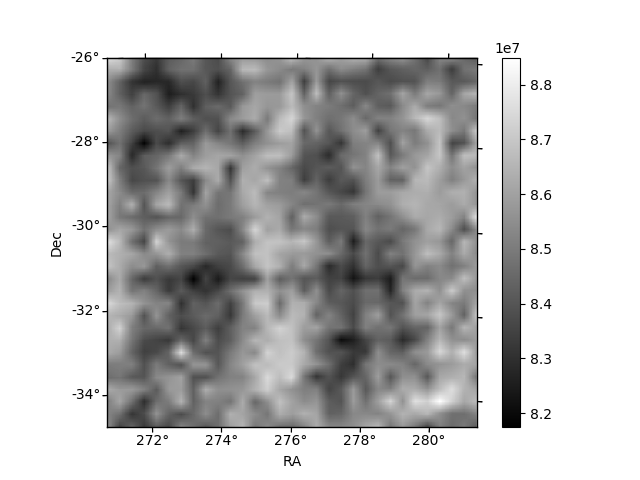
Histogram calculated using DETX and DETY for each event in the final _common_clean file
| Quadrant A | 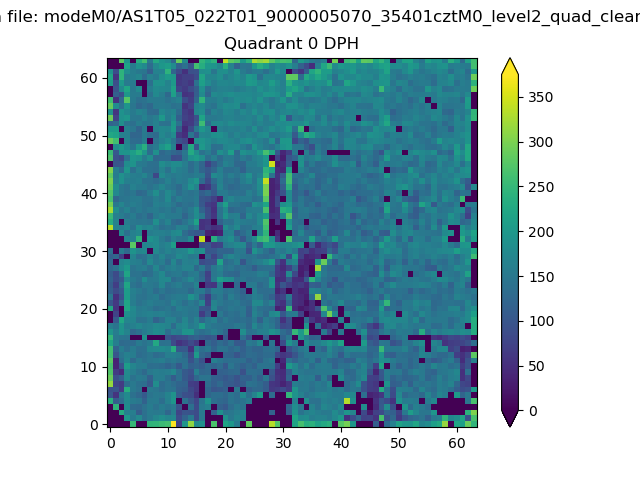 |
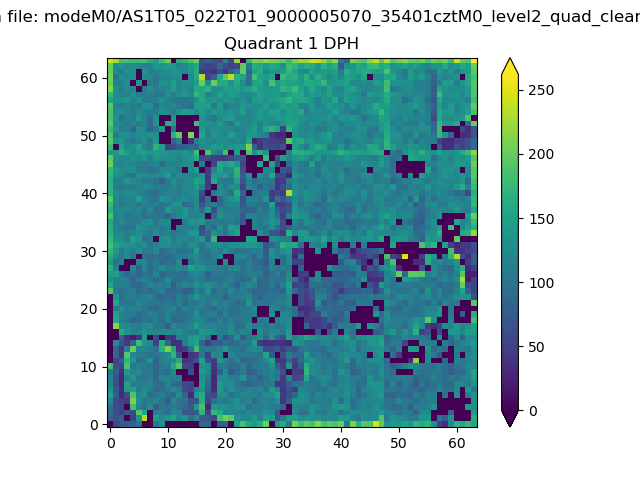 |
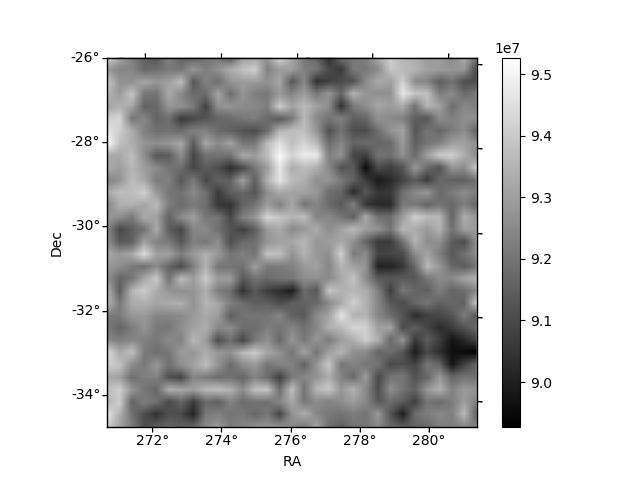
Quadrant B |
|---|---|---|---|
| Quadrant D | 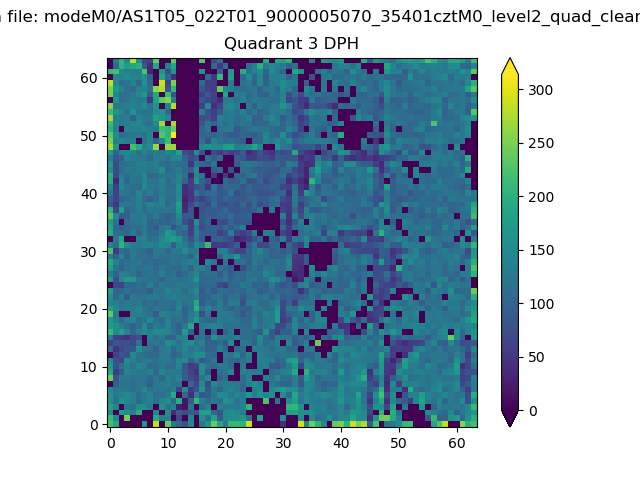 |
 |
Quadrant C |
| Plot type | Count rate plots | Images |
|---|---|---|
| Comparison with Poisson distribution Blue bars denote a histogram of data divided into 1 sec bins. Red curve is a Poisson curve with rate = median count rate of data. |
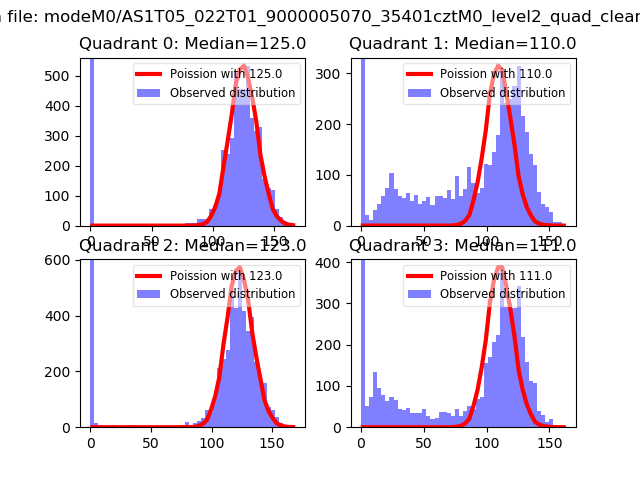 |
 |
| Quadrant-wise count rates Data is divided into 100 sec bins |
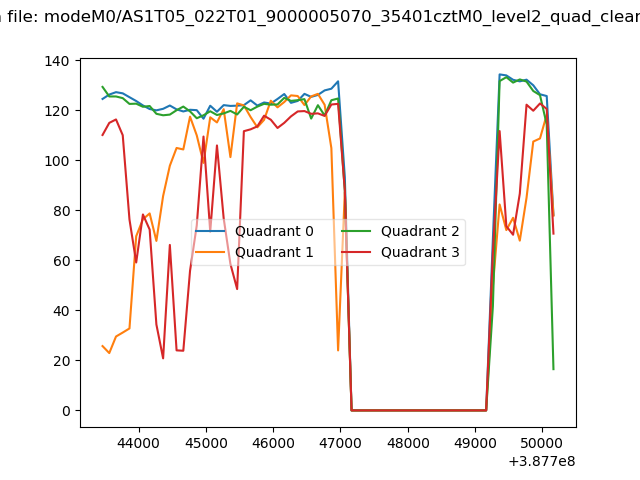 |
|
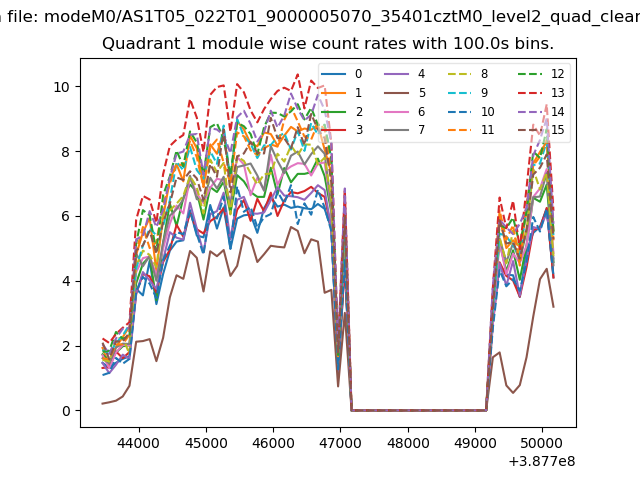
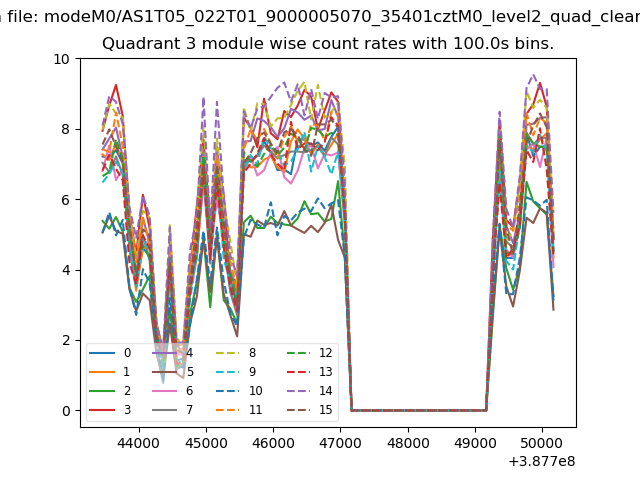
| Module-wise count rates for Quadrant A Data is divided into 100 sec bins |
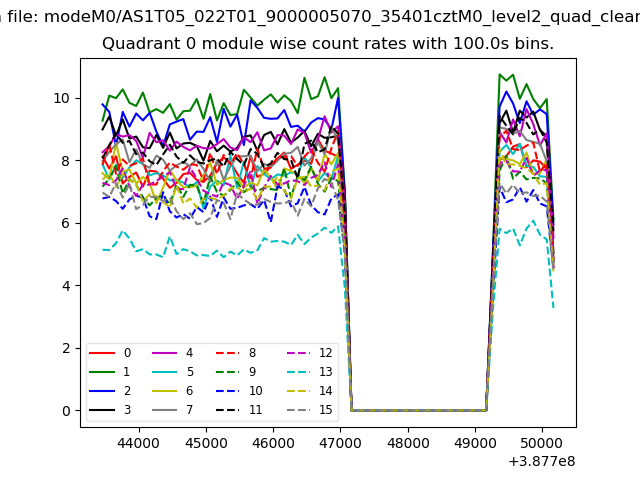 |
 |
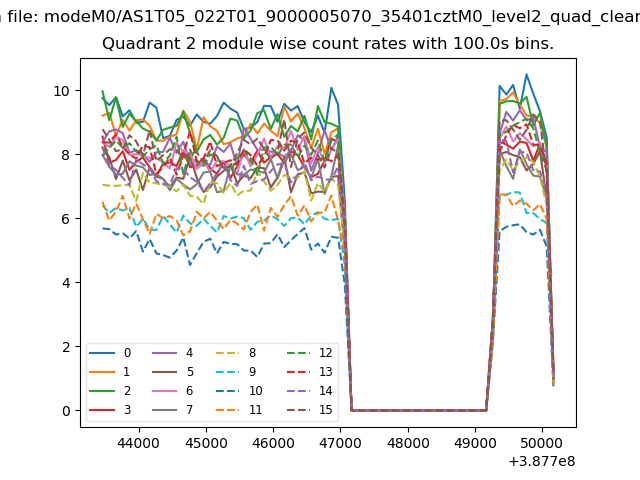
| Module-wise count rates for Quadrant B Data is divided into 100 sec bins |
 |
 |
| Module-wise count rates for Quadrant C Data is divided into 100 sec bins |
 |
 |
| Module-wise count rates for Quadrant D Data is divided into 100 sec bins |
 |
 |
| Parameter | Plot |
|---|---|
| CZT HV Monitor | 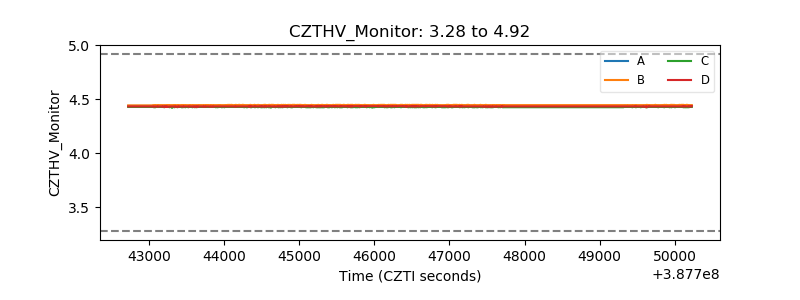 |
| D_VDD | 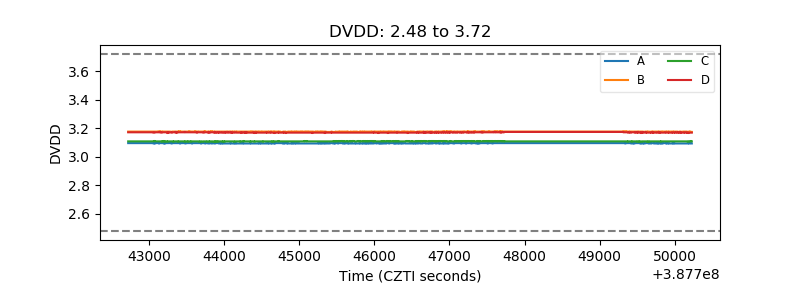 |
| Temperature 1 | 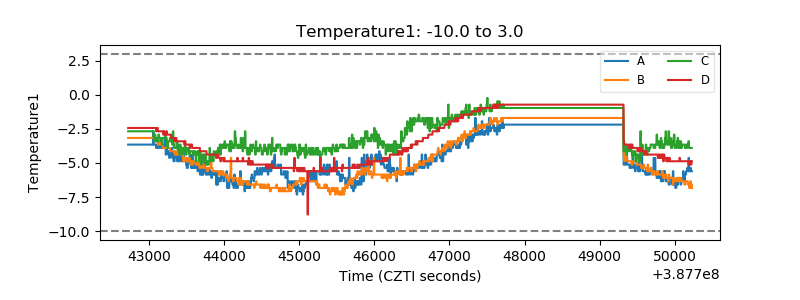 |
| Veto HV Monitor | 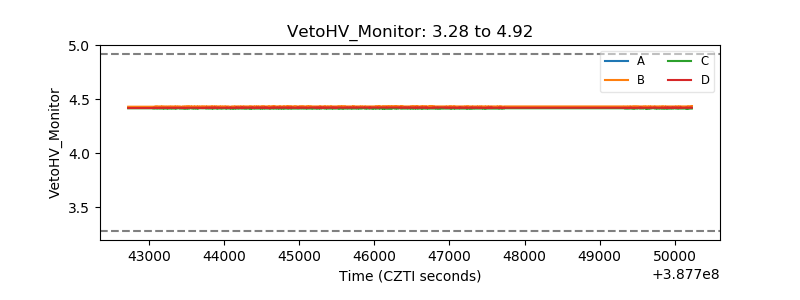 |
| Veto LLD | 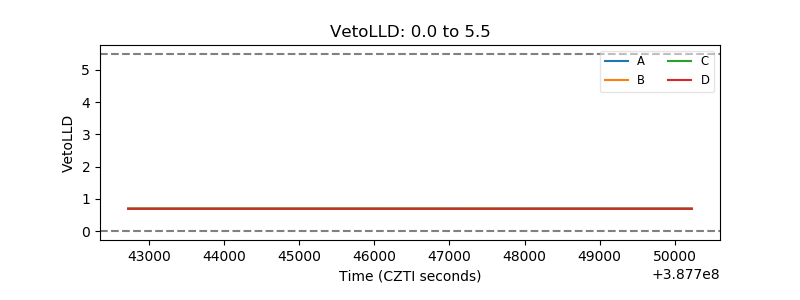 |
| Alpha Counter | 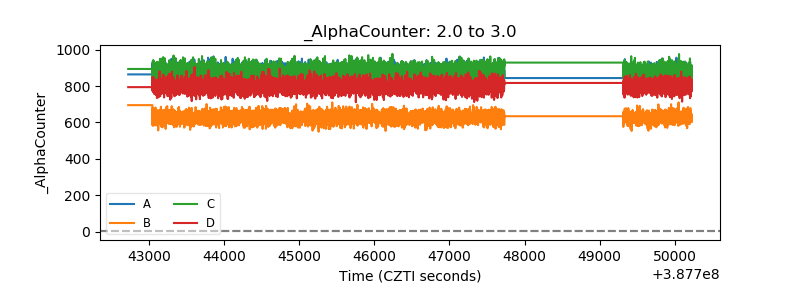 |
| _CPM_Rate | 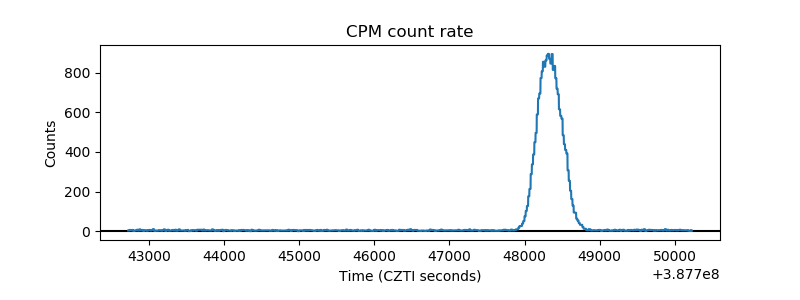 |
| CZT Counter | 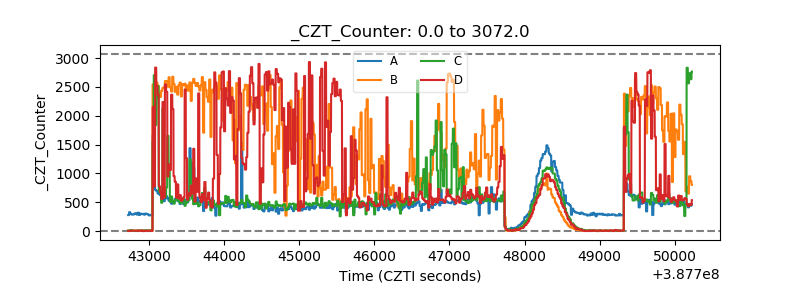 |
| +2.5 Volts monitor | 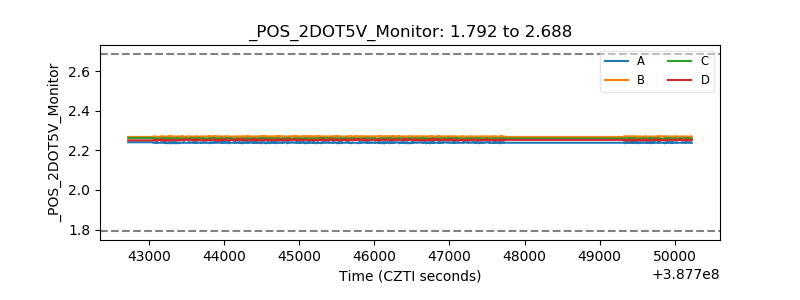 |
| +5 Volts monitor | 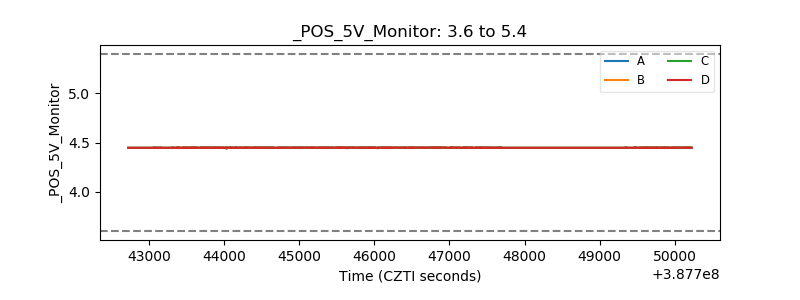 |
| _ROLL_ROT |  |
| _Roll_DEC | 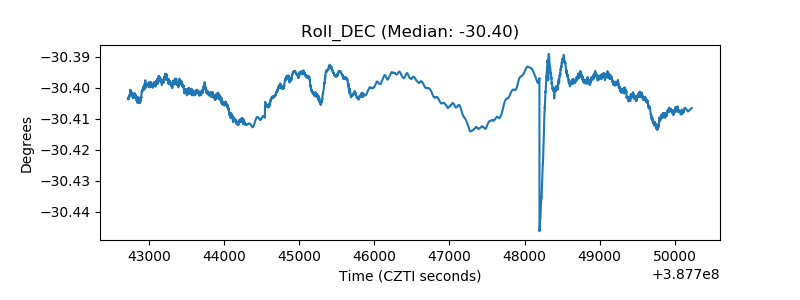 |
| _Roll_RA | 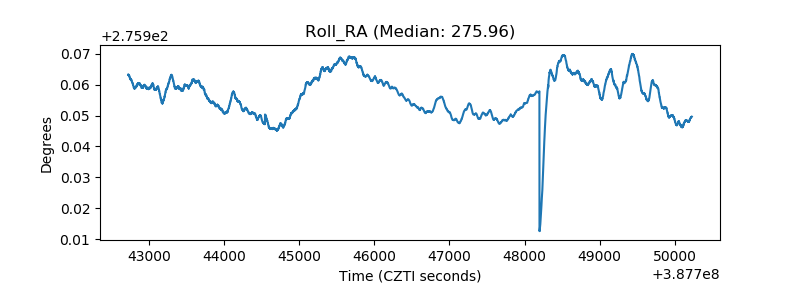 |
| Veto Counter | 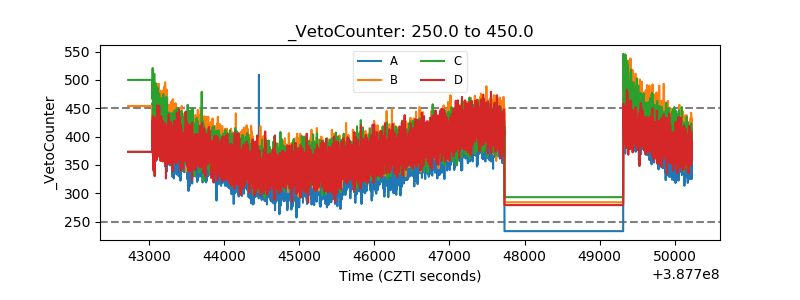 |