| Param | Original file | Final file |
|---|---|---|
| Filename | modeM0/AS1A11_099T01_9000005068_35397cztM0_level2.evt | modeM0/AS1A11_099T01_9000005068_35397cztM0_level2_quad_clean.evt |
| Size (bytes) | 955,255,680 | 70,680,960 |
| Size | 911.0 MB | 67.4 MB |
| Events in quadrant A | 2,916,125 | 551,327 |
| Events in quadrant B | 14,025,135 | 212,404 |
| Events in quadrant C | 3,530,416 | 533,514 |
| Events in quadrant D | 8,058,746 | 425,724 |
| Mode M9 | |||
|---|---|---|---|
| Quadrant | BADHDUFLAG | Total packets | Discarded packets |
| A | 0 | 21 | 0 |
| B | 0 | 21 | 0 |
| C | 0 | 21 | 0 |
| D | 0 | 22 | 0 |
| Mode M0 | |||
|---|---|---|---|
| Quadrant | BADHDUFLAG | Total packets | Discarded packets |
| A | 0 | 12393 | 3 |
| B | 0 | 45649 | 2 |
| C | 0 | 14002 | 2 |
| D | 0 | 27948 | 2 |
| Mode SS | |||
|---|---|---|---|
| Quadrant | BADHDUFLAG | Total packets | Discarded packets |
| A | 0 | 120 | 0 |
| B | 0 | 120 | 0 |
| C | 0 | 120 | 0 |
| D | 0 | 120 | 0 |
| Quadrant | Total seconds | Saturated seconds | Saturation percentage |
|---|---|---|---|
| A | 5931 | 17 | 0.286630% |
| B | 5931 | 5518 | 93.036587% |
| C | 5931 | 206 | 3.473276% |
| D | 5931 | 1786 | 30.112966% |
Noise dominated data is calculated using 1-second bins in cleaned event files. If a bin has >2000 counts, and if more than 50% of those come from <1% of pixels, then it is considered to be noise-dominated and hence unusable.
| Quadrant | # 1 sec bins | Bins with >0 counts | Bins with >2000 counts | High rate bins dominated by noise | Noise dominated (total time) | Noise dominated (detector-on time) | Marked lightcurve |
|---|---|---|---|---|---|---|---|
| A | 7274 | 5932 | 9 | 9 | 0.12% | 0.15% | 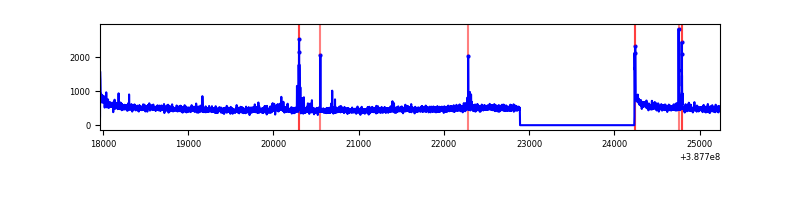 |
| B | 7274 | 5932 | 4907 | 4907 | 67.46% | 82.72% | 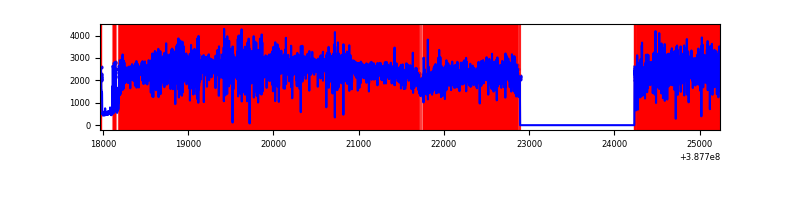 |
| C | 7274 | 5932 | 169 | 169 | 2.32% | 2.85% | 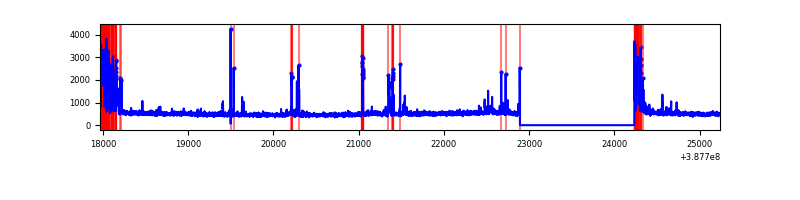 |
| D | 7274 | 5932 | 1581 | 1581 | 21.73% | 26.65% | 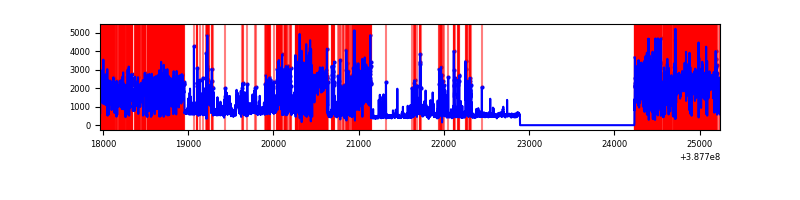 |
Top three noisy pixels from each quadrant. If the there are fewer than three noisy pixels in the level2.evt file, extra rows are filled as -1
| Pixel properties | Quadrant properties | ||||||
|---|---|---|---|---|---|---|---|
| Quadrant | DetID | PixID | Counts | Sigma | Mean | Median | Sigma |
| A | 10 | 83 | 131936 | 929.01 | 693 | 680 | 141.3 |
| A | 15 | 174 | 25715 | 177.19 | 693 | 680 | 141.3 |
| A | 13 | 6 | 19534 | 133.45 | 693 | 680 | 141.3 |
| B | 4 | 251 | 4316292 | 63825.31 | 339 | 330 | 67.6 |
| B | 5 | 14 | 2703699 | 39977.96 | 339 | 330 | 67.6 |
| B | 5 | 31 | 2596412 | 38391.38 | 339 | 330 | 67.6 |
| C | 0 | 207 | 376495 | 2435.76 | 662 | 667 | 154.3 |
| C | 0 | 10 | 296726 | 1918.77 | 662 | 667 | 154.3 |
| C | 15 | 214 | 243406 | 1573.2 | 662 | 667 | 154.3 |
| D | 7 | 80 | 2919795 | 19383.22 | 599 | 580 | 150.6 |
| D | 1 | 52 | 1356715 | 9004.56 | 599 | 580 | 150.6 |
| D | 13 | 249 | 339242 | 2248.67 | 599 | 580 | 150.6 |
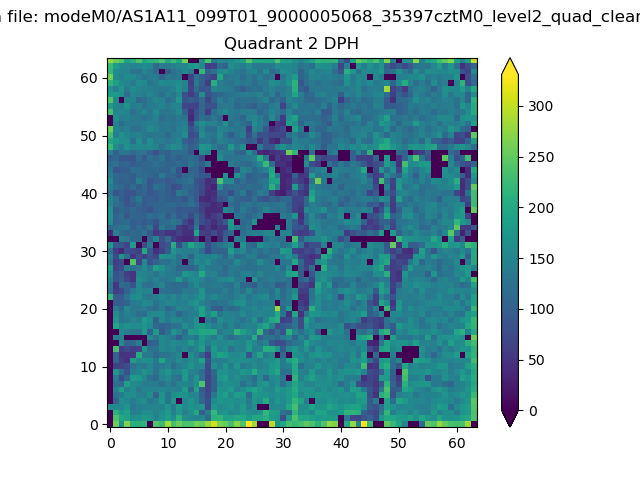
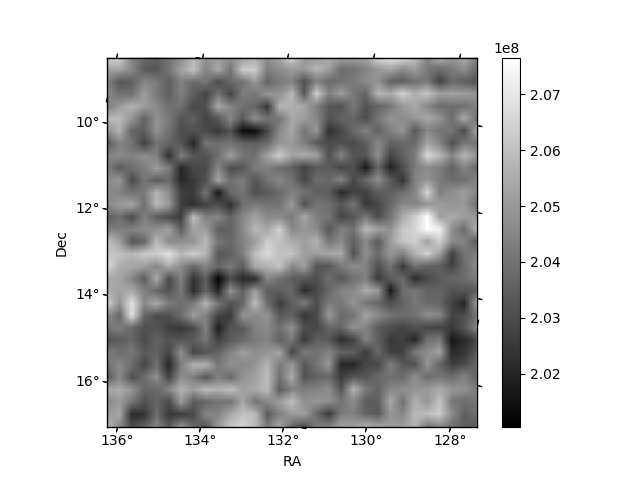
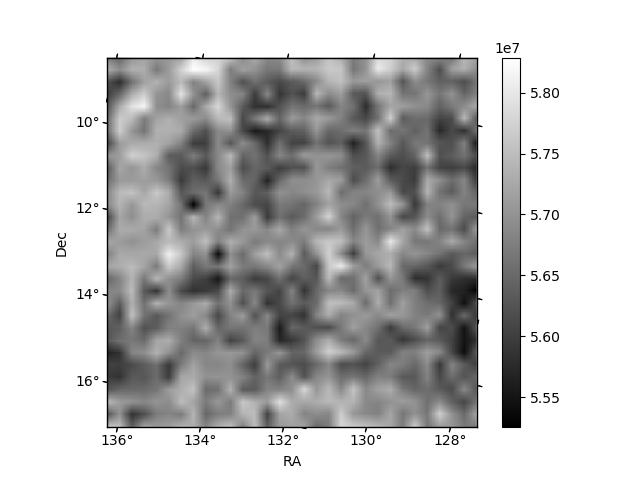
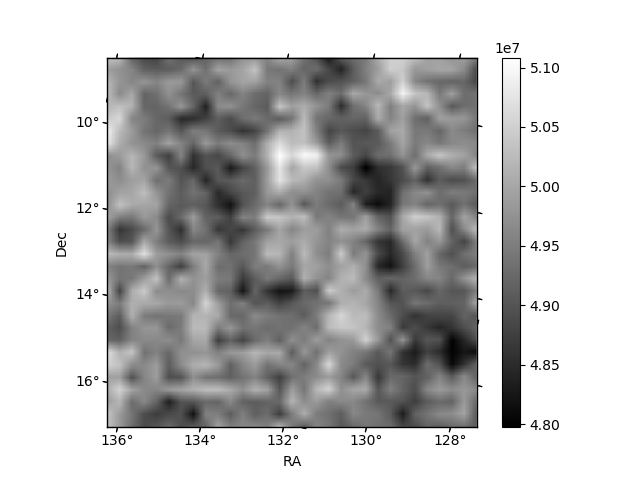
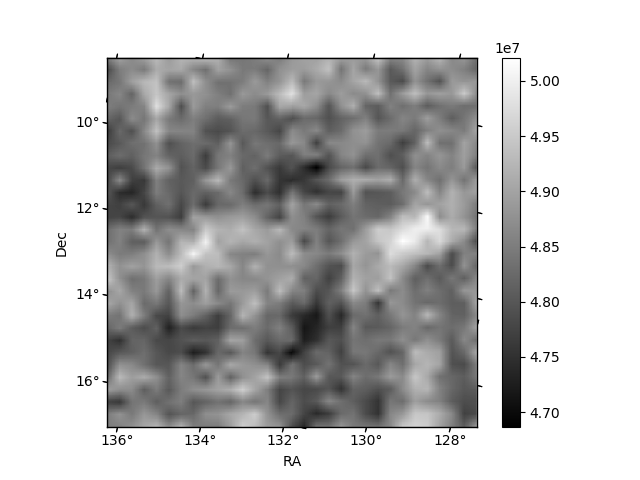
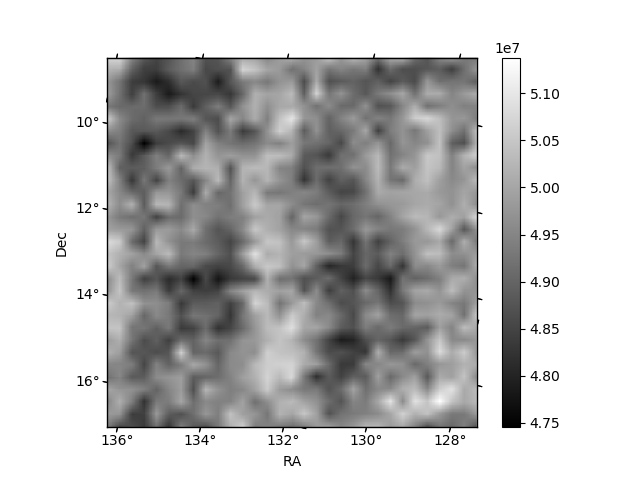
Histogram calculated using DETX and DETY for each event in the final _common_clean file
| Quadrant A | 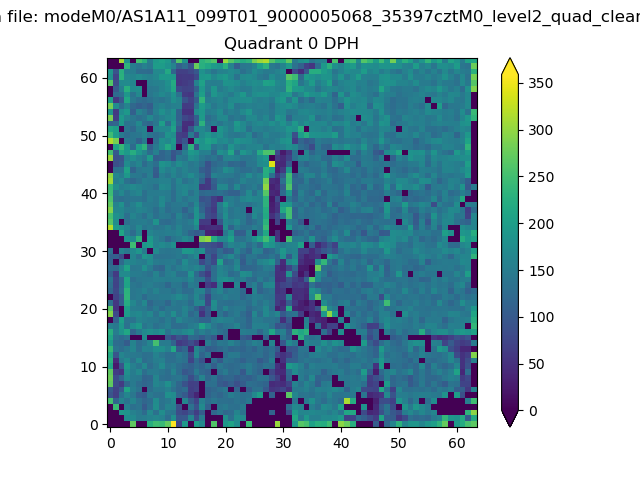 |
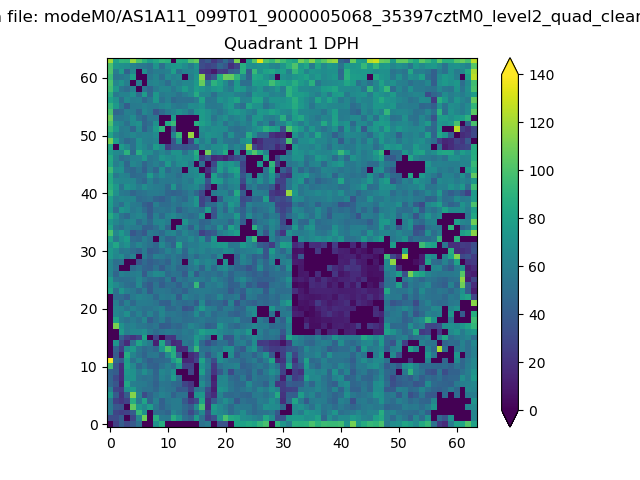 |
Quadrant B |
|---|---|---|---|
| Quadrant D | 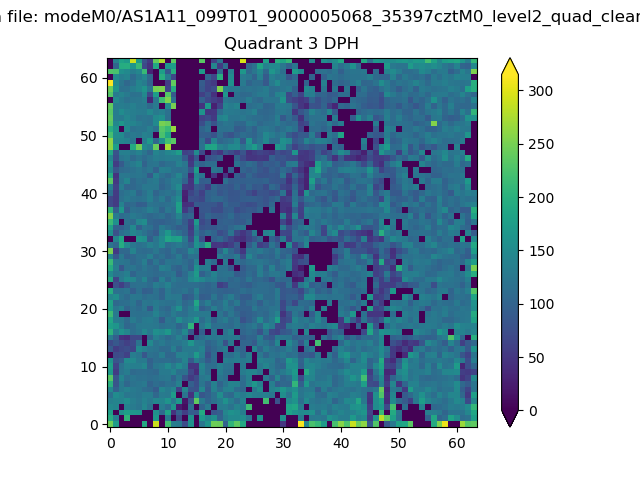 |
 |
Quadrant C |
| Plot type | Count rate plots | Images |
|---|---|---|
| Comparison with Poisson distribution Blue bars denote a histogram of data divided into 1 sec bins. Red curve is a Poisson curve with rate = median count rate of data. |
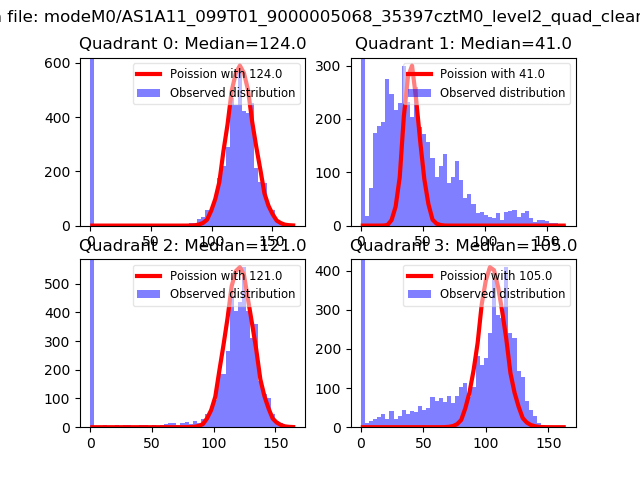 |
 |
| Quadrant-wise count rates Data is divided into 100 sec bins |
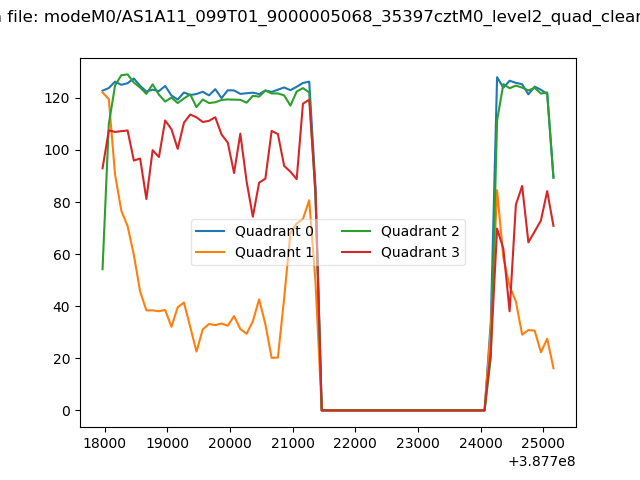 |
|
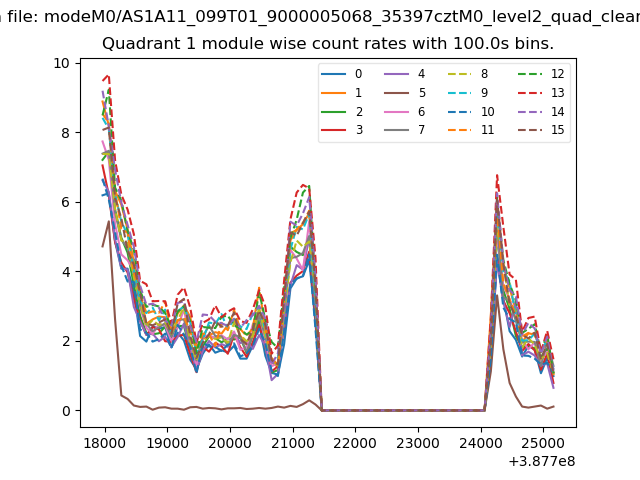
| Module-wise count rates for Quadrant A Data is divided into 100 sec bins |
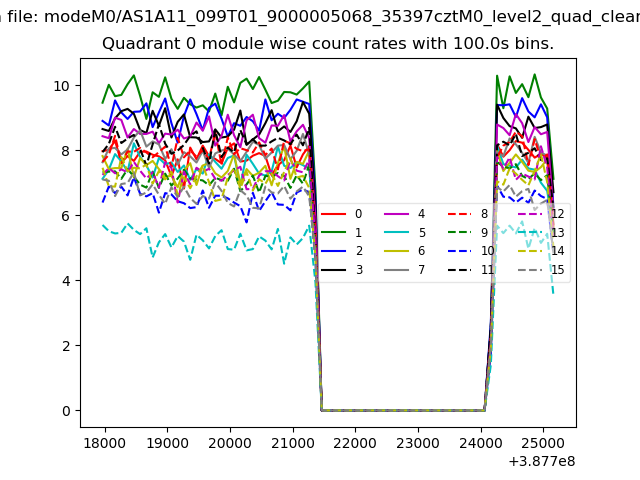 |
 |
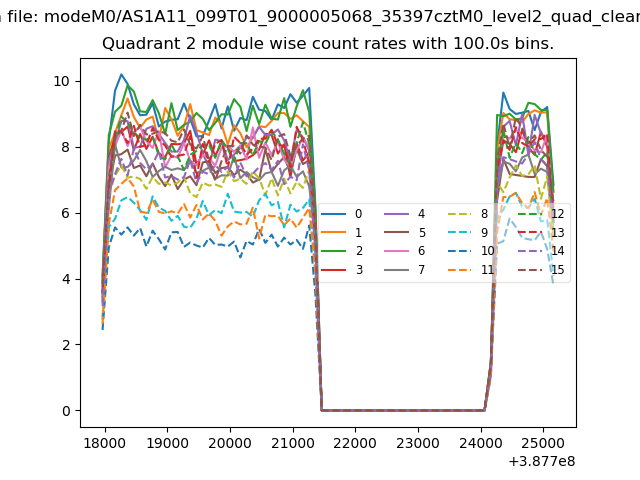
| Module-wise count rates for Quadrant B Data is divided into 100 sec bins |
 |
 |
| Module-wise count rates for Quadrant C Data is divided into 100 sec bins |
 |
 |
| Module-wise count rates for Quadrant D Data is divided into 100 sec bins |
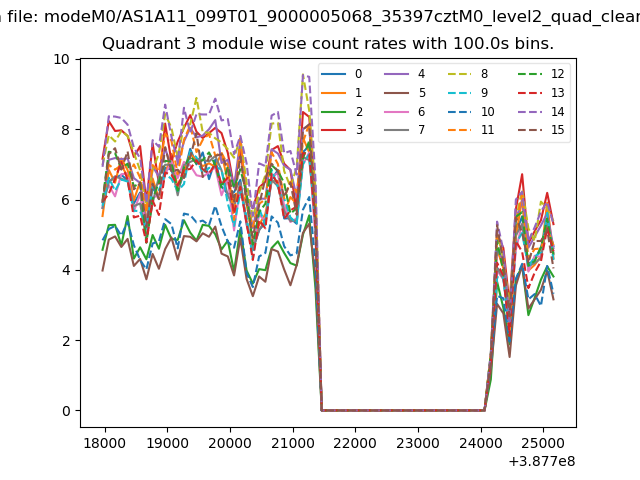 |
 |
| Parameter | Plot |
|---|---|
| CZT HV Monitor | 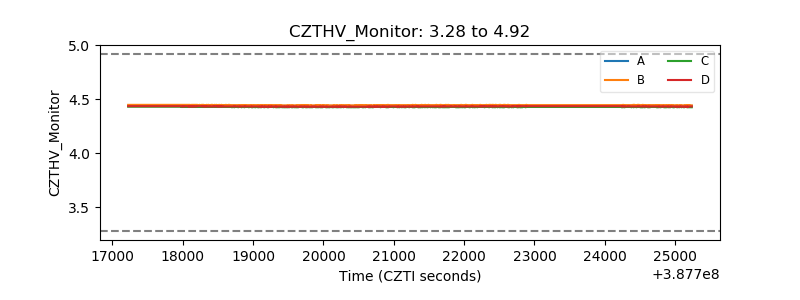 |
| D_VDD | 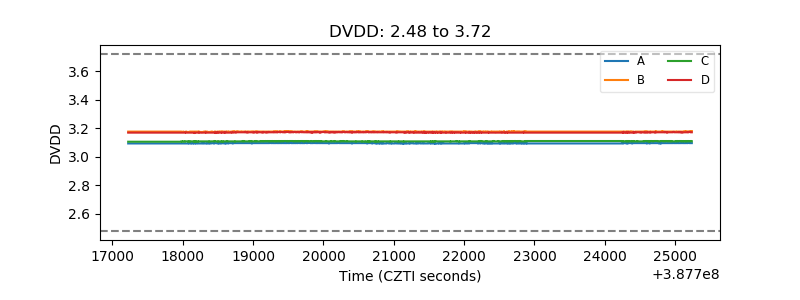 |
| Temperature 1 | 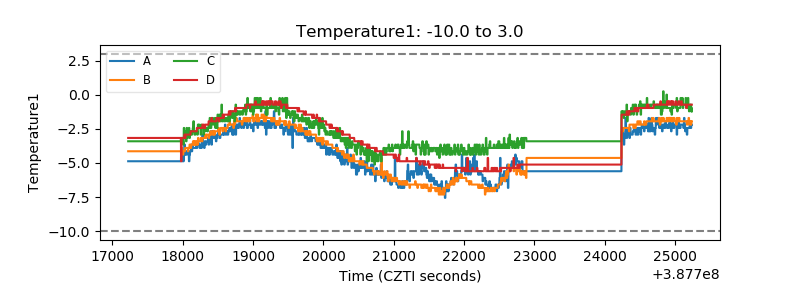 |
| Veto HV Monitor | 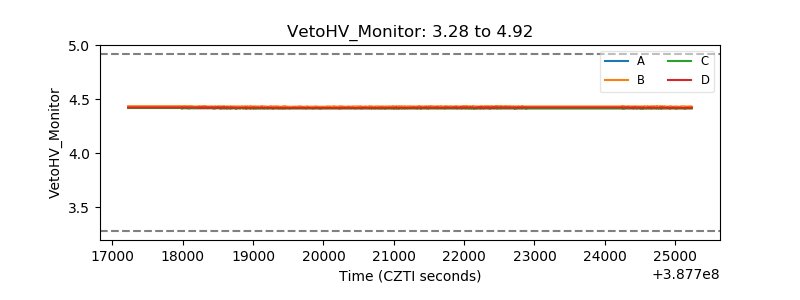 |
| Veto LLD | 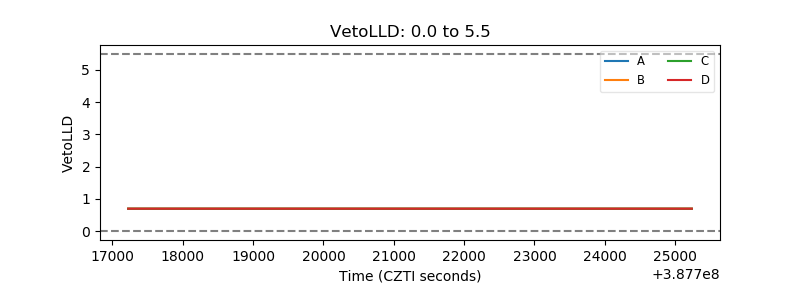 |
| Alpha Counter | 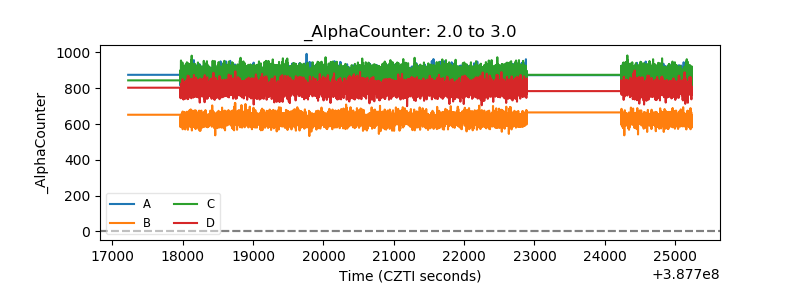 |
| _CPM_Rate |  |
| CZT Counter | 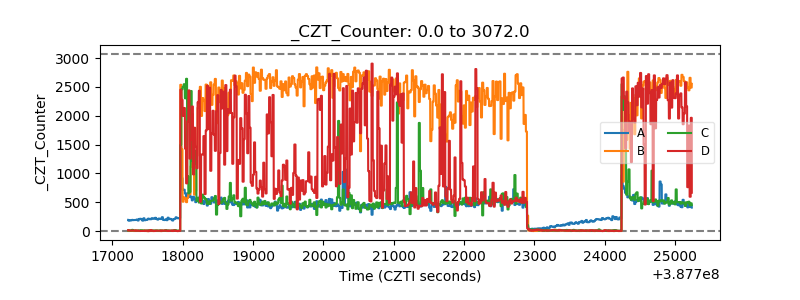 |
| +2.5 Volts monitor | 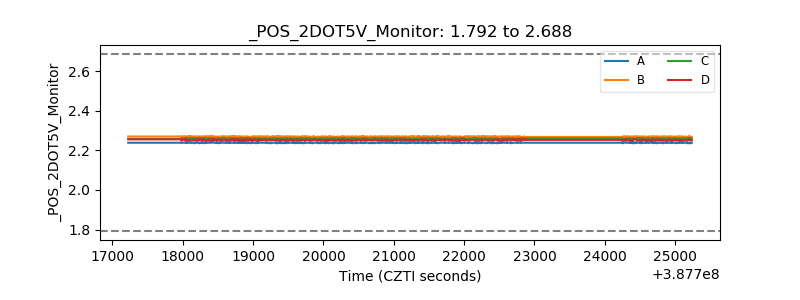 |
| +5 Volts monitor | 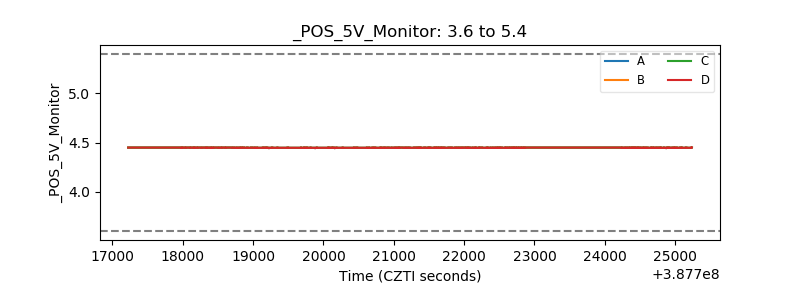 |
| _ROLL_ROT | 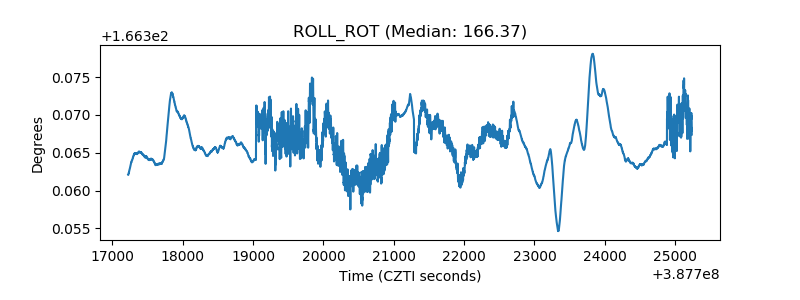 |
| _Roll_DEC | 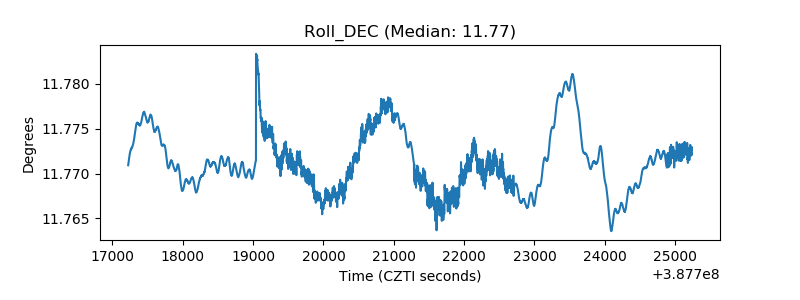 |
| _Roll_RA | 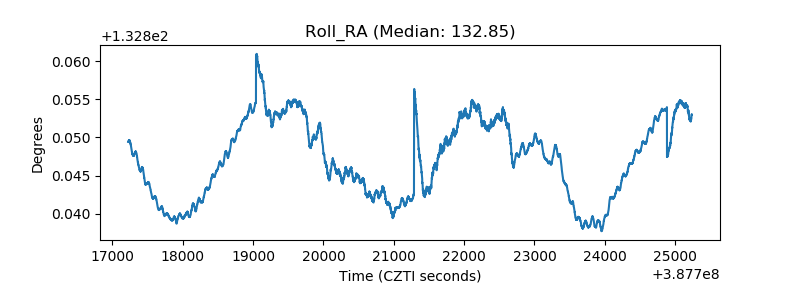 |
| Veto Counter | 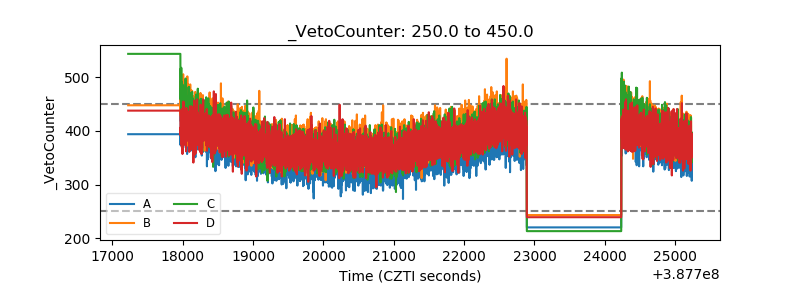 |