| Param | Original file | Final file |
|---|---|---|
| Filename | modeM0/AS1A11_099T01_9000005068_35394cztM0_level2.evt | modeM0/AS1A11_099T01_9000005068_35394cztM0_level2_quad_clean.evt |
| Size (bytes) | 768,219,840 | 53,415,360 |
| Size | 732.6 MB | 50.9 MB |
| Events in quadrant A | 2,571,224 | 420,303 |
| Events in quadrant B | 11,176,948 | 114,795 |
| Events in quadrant C | 3,234,902 | 407,667 |
| Events in quadrant D | 5,947,414 | 324,639 |
| Mode M9 | |||
|---|---|---|---|
| Quadrant | BADHDUFLAG | Total packets | Discarded packets |
| A | 0 | 24 | 0 |
| B | 0 | 24 | 0 |
| C | 0 | 24 | 0 |
| D | 0 | 25 | 0 |
| Mode M0 | |||
|---|---|---|---|
| Quadrant | BADHDUFLAG | Total packets | Discarded packets |
| A | 0 | 10400 | 3 |
| B | 0 | 36507 | 2 |
| C | 0 | 12444 | 2 |
| D | 0 | 21016 | 2 |
| Mode SS | |||
|---|---|---|---|
| Quadrant | BADHDUFLAG | Total packets | Discarded packets |
| A | 0 | 100 | 0 |
| B | 0 | 100 | 0 |
| C | 0 | 100 | 0 |
| D | 0 | 100 | 0 |
| Quadrant | Total seconds | Saturated seconds | Saturation percentage |
|---|---|---|---|
| A | 4964 | 8 | 0.161160% |
| B | 4964 | 4305 | 86.724416% |
| C | 4964 | 185 | 3.726833% |
| D | 4964 | 1348 | 27.155520% |
Noise dominated data is calculated using 1-second bins in cleaned event files. If a bin has >2000 counts, and if more than 50% of those come from <1% of pixels, then it is considered to be noise-dominated and hence unusable.
| Quadrant | # 1 sec bins | Bins with >0 counts | Bins with >2000 counts | High rate bins dominated by noise | Noise dominated (total time) | Noise dominated (detector-on time) | Marked lightcurve |
|---|---|---|---|---|---|---|---|
| A | 7058 | 4965 | 2 | 2 | 0.03% | 0.04% | 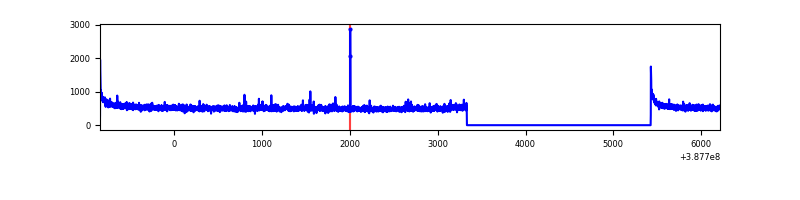 |
| B | 7058 | 4965 | 3619 | 3619 | 51.28% | 72.89% | 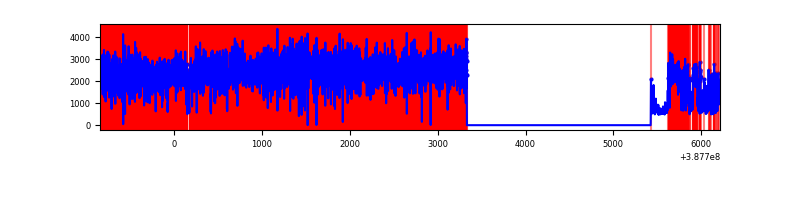 |
| C | 7058 | 4965 | 139 | 139 | 1.97% | 2.80% | 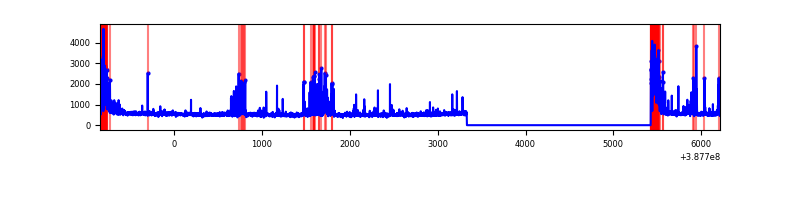 |
| D | 7058 | 4965 | 970 | 970 | 13.74% | 19.54% | 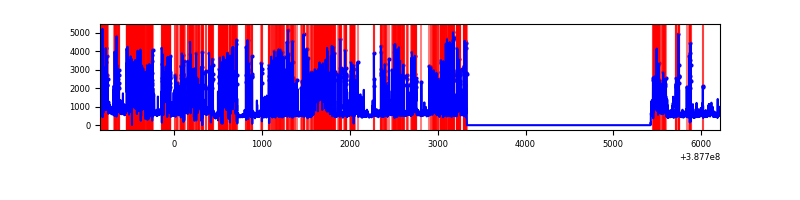 |
Top three noisy pixels from each quadrant. If the there are fewer than three noisy pixels in the level2.evt file, extra rows are filled as -1
| Pixel properties | Quadrant properties | ||||||
|---|---|---|---|---|---|---|---|
| Quadrant | DetID | PixID | Counts | Sigma | Mean | Median | Sigma |
| A | 10 | 83 | 123215 | 964.52 | 623 | 611 | 127.1 |
| A | 10 | 255 | 18822 | 143.27 | 623 | 611 | 127.1 |
| A | 13 | 6 | 16334 | 123.69 | 623 | 611 | 127.1 |
| B | 4 | 251 | 8165337 | 145290.85 | 289 | 283 | 56.2 |
| B | 5 | 14 | 458014 | 8144.97 | 289 | 283 | 56.2 |
| B | 5 | 31 | 415191 | 7382.97 | 289 | 283 | 56.2 |
| C | 0 | 10 | 608330 | 4492.14 | 584 | 589 | 135.3 |
| C | 15 | 214 | 206972 | 1525.49 | 584 | 589 | 135.3 |
| C | 0 | 207 | 75582 | 554.31 | 584 | 589 | 135.3 |
| D | 7 | 80 | 2811548 | 22522.26 | 505 | 491 | 124.8 |
| D | 12 | 233 | 282698 | 2261.05 | 505 | 491 | 124.8 |
| D | 10 | 118 | 158593 | 1266.72 | 505 | 491 | 124.8 |
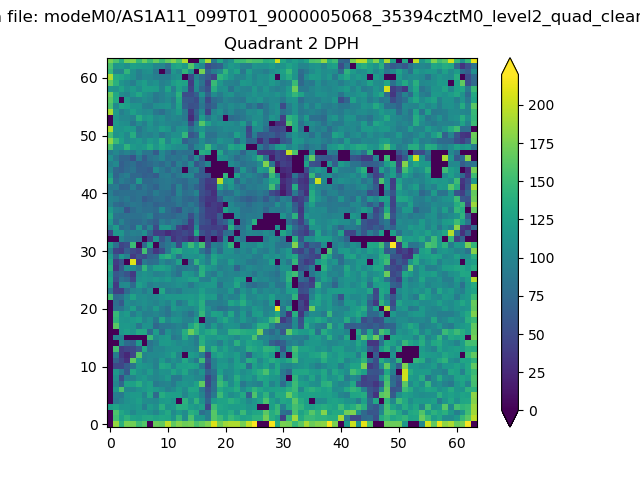
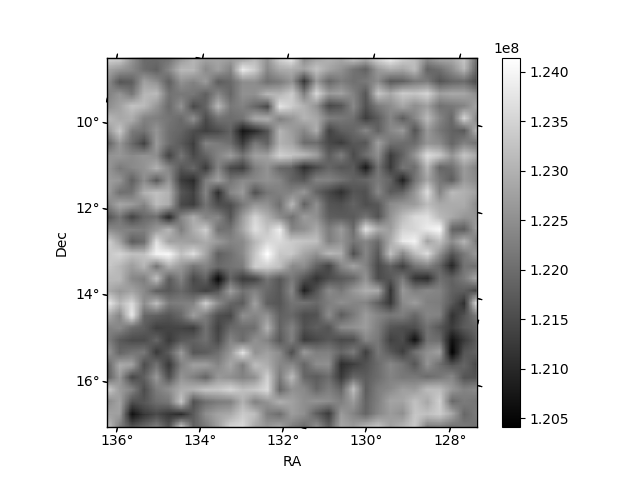
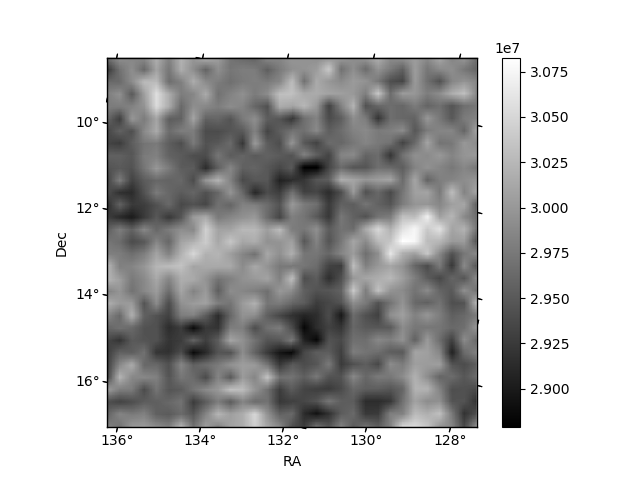
Histogram calculated using DETX and DETY for each event in the final _common_clean file
| Quadrant A | 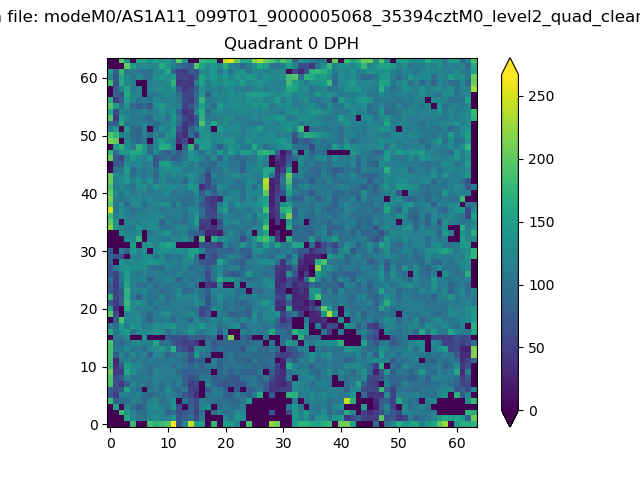 |
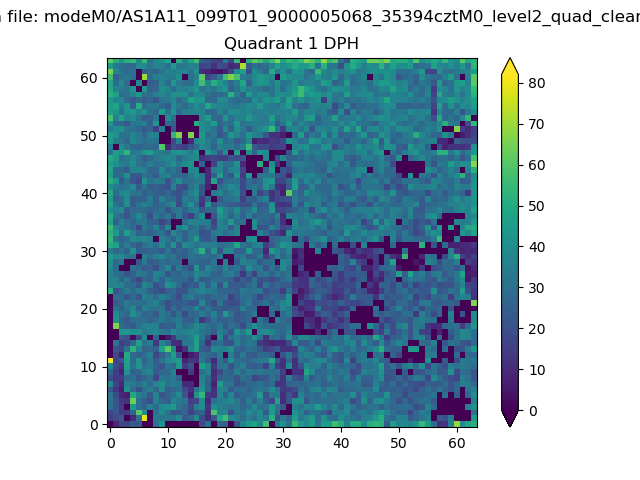 |
Quadrant B |
|---|---|---|---|
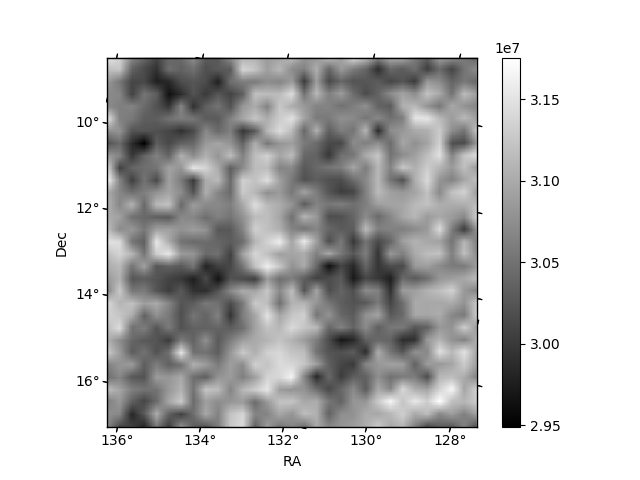
| Quadrant D | 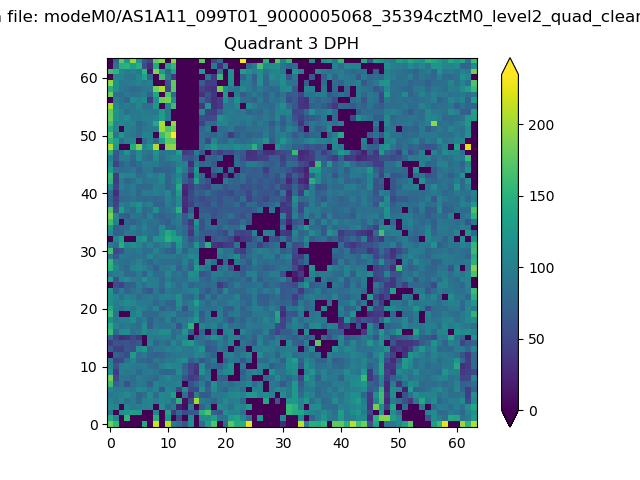 |
 |
Quadrant C |
| Plot type | Count rate plots | Images |
|---|---|---|
| Comparison with Poisson distribution Blue bars denote a histogram of data divided into 1 sec bins. Red curve is a Poisson curve with rate = median count rate of data. |
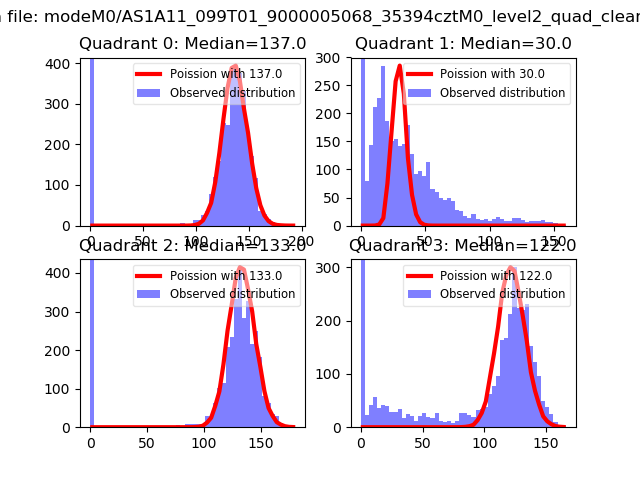 |
 |
| Quadrant-wise count rates Data is divided into 100 sec bins |
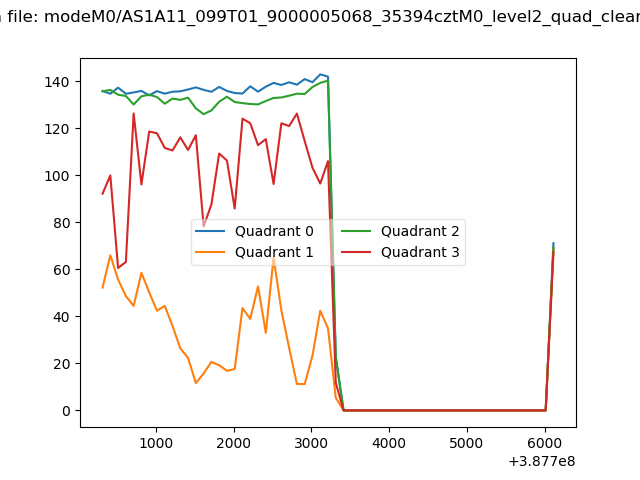 |
|
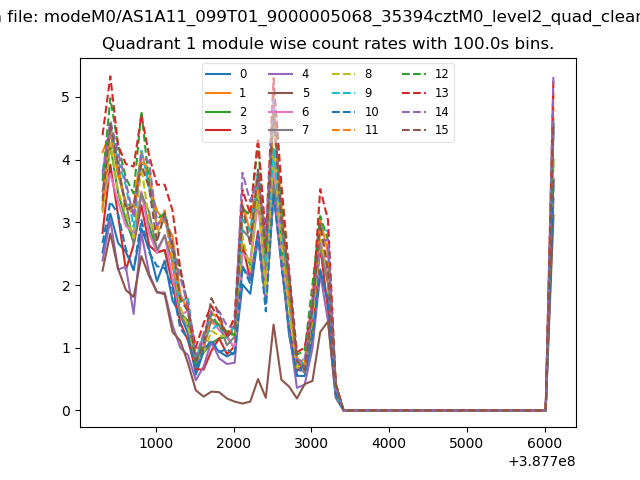
| Module-wise count rates for Quadrant A Data is divided into 100 sec bins |
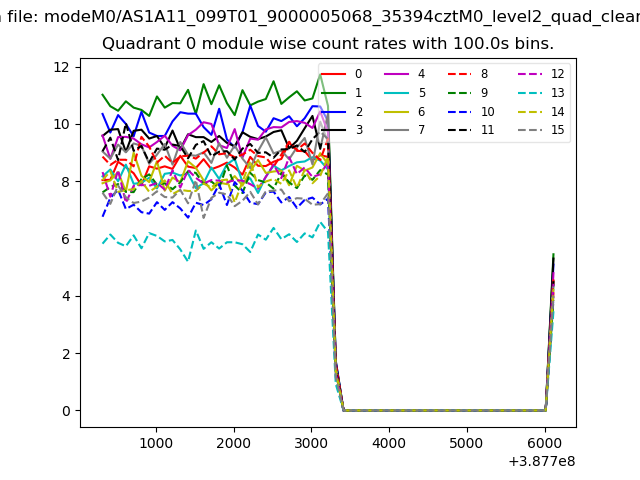 |
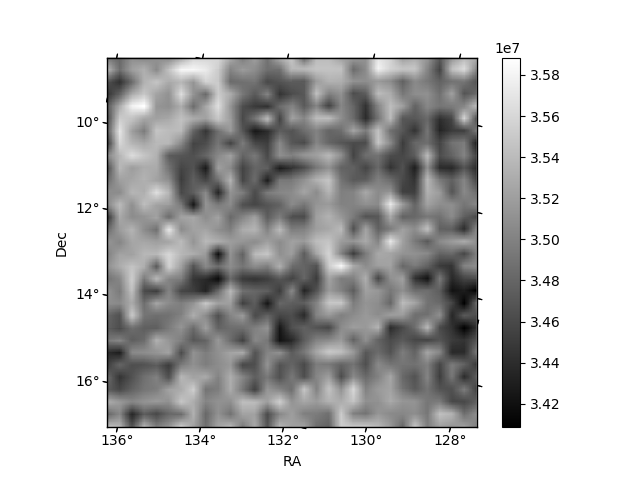 |
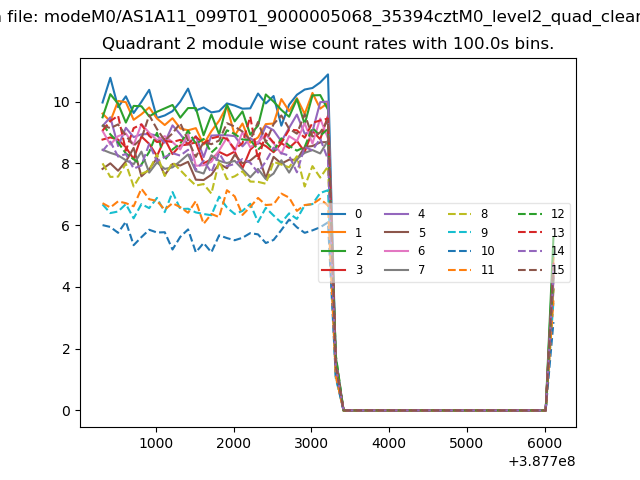
| Module-wise count rates for Quadrant B Data is divided into 100 sec bins |
 |
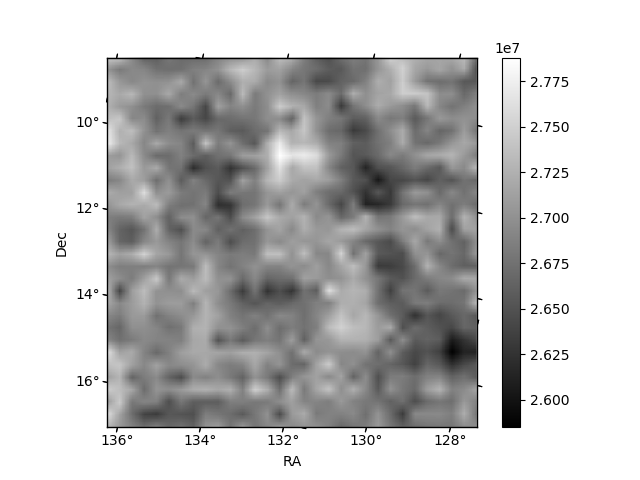 |
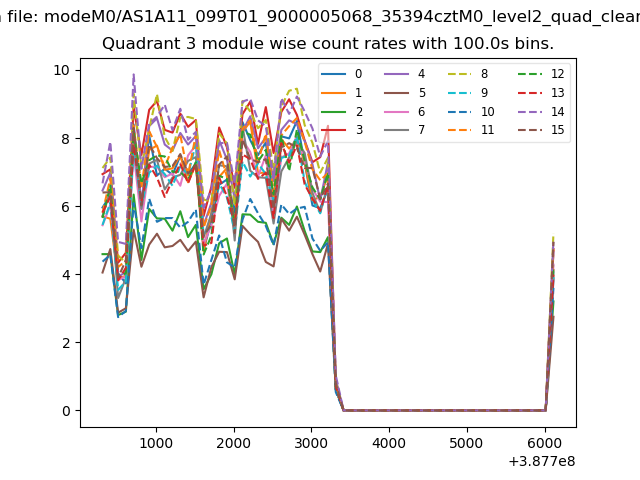
| Module-wise count rates for Quadrant C Data is divided into 100 sec bins |
 |
 |
| Module-wise count rates for Quadrant D Data is divided into 100 sec bins |
 |
 |
| Parameter | Plot |
|---|---|
| CZT HV Monitor | 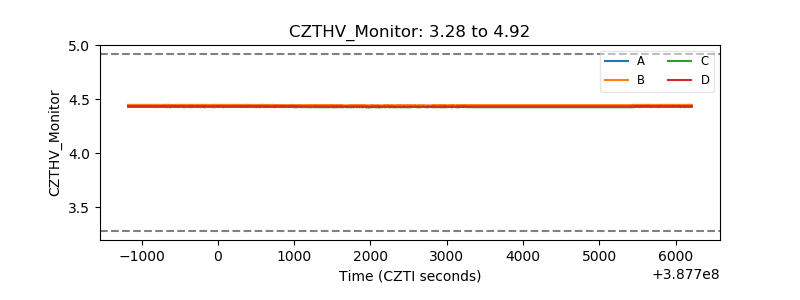 |
| D_VDD | 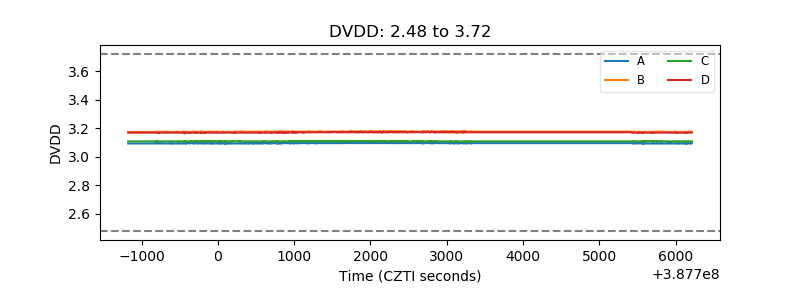 |
| Temperature 1 | 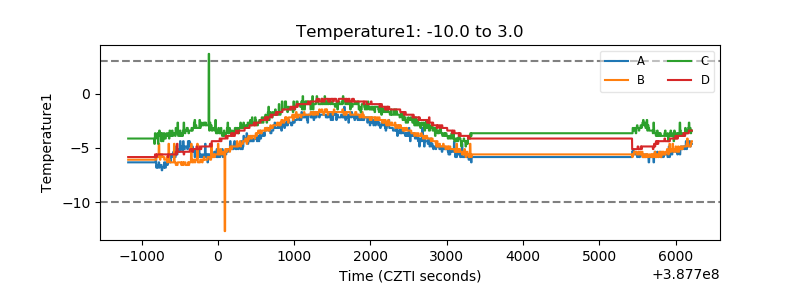 |
| Veto HV Monitor | 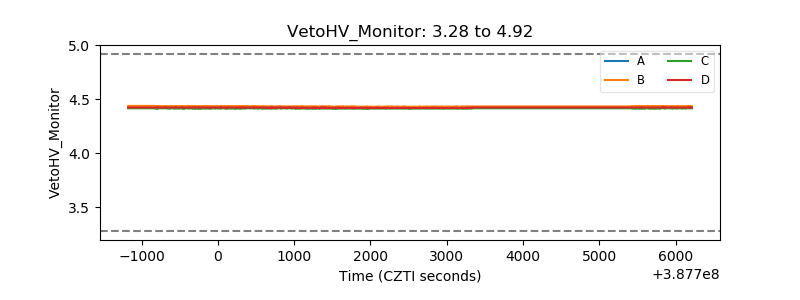 |
| Veto LLD | 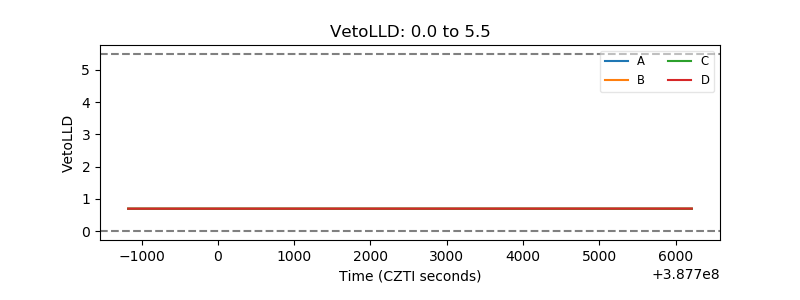 |
| Alpha Counter | 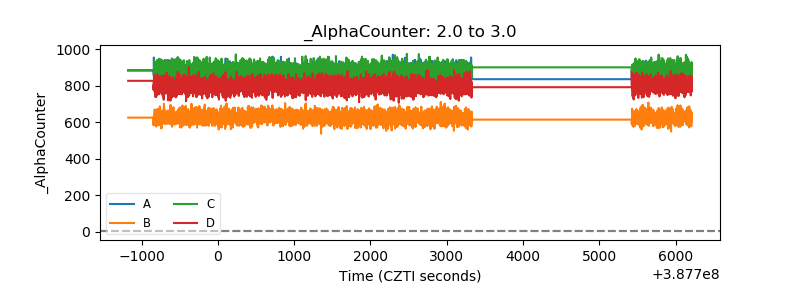 |
| _CPM_Rate | 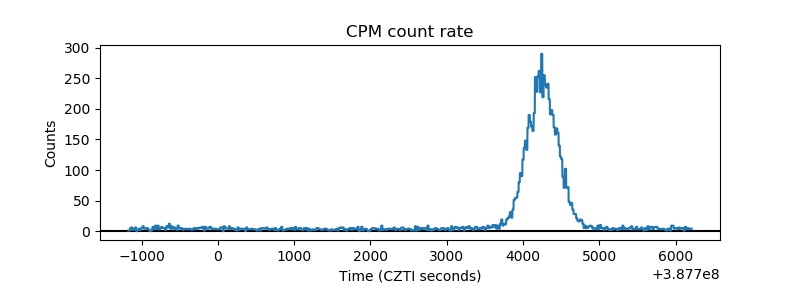 |
| CZT Counter | 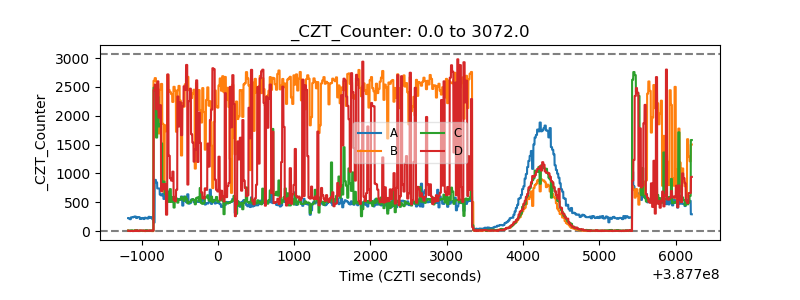 |
| +2.5 Volts monitor | 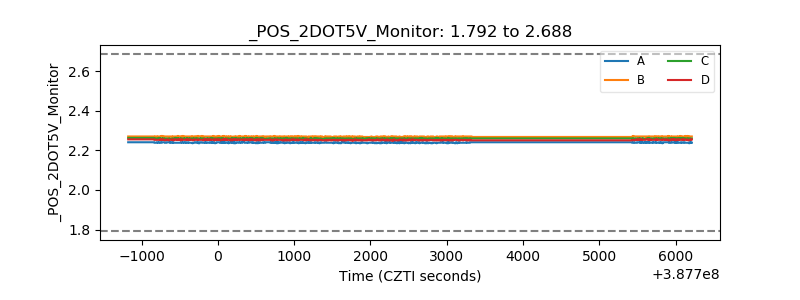 |
| +5 Volts monitor | 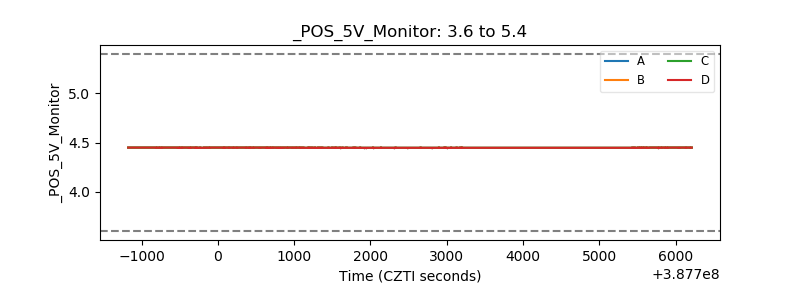 |
| _ROLL_ROT | 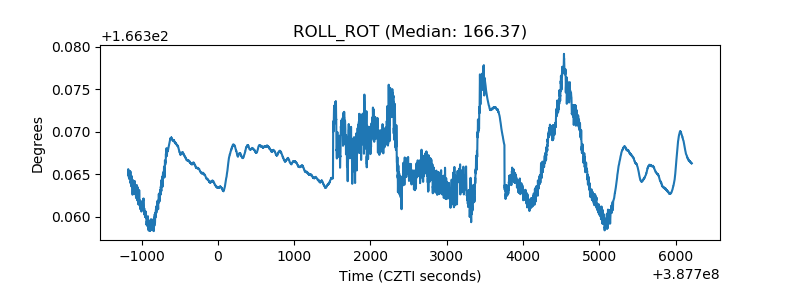 |
| _Roll_DEC | 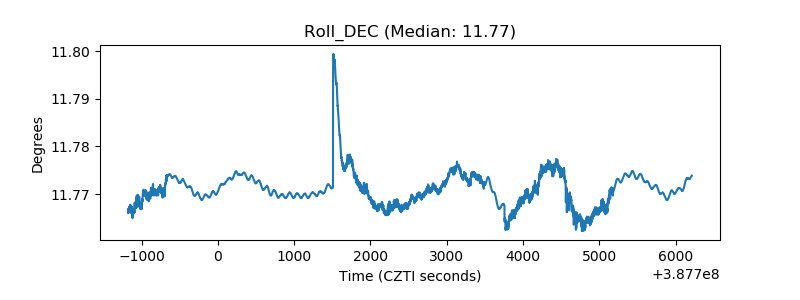 |
| _Roll_RA | 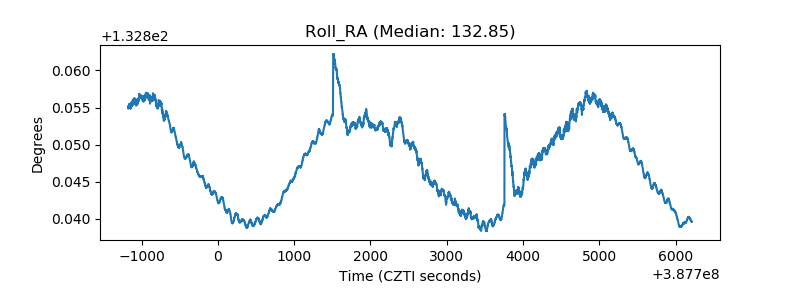 |
| Veto Counter | 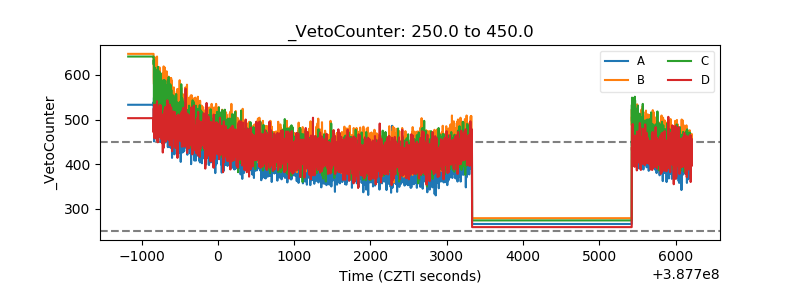 |