| Param | Original file | Final file |
|---|---|---|
| Filename | modeM0/AS1A11_099T01_9000005068_35393cztM0_level2.evt | modeM0/AS1A11_099T01_9000005068_35393cztM0_level2_quad_clean.evt |
| Size (bytes) | 764,732,160 | 47,695,680 |
| Size | 729.3 MB | 45.5 MB |
| Events in quadrant A | 2,690,951 | 357,555 |
| Events in quadrant B | 9,101,571 | 184,945 |
| Events in quadrant C | 3,276,220 | 346,089 |
| Events in quadrant D | 7,756,068 | 204,739 |
| Mode M9 | |||
|---|---|---|---|
| Quadrant | BADHDUFLAG | Total packets | Discarded packets |
| A | 0 | 26 | 0 |
| B | 0 | 26 | 0 |
| C | 0 | 26 | 0 |
| D | 0 | 27 | 0 |
| Mode M0 | |||
|---|---|---|---|
| Quadrant | BADHDUFLAG | Total packets | Discarded packets |
| A | 0 | 10690 | 3 |
| B | 0 | 30447 | 2 |
| C | 0 | 12686 | 2 |
| D | 0 | 26497 | 2 |
| Mode SS | |||
|---|---|---|---|
| Quadrant | BADHDUFLAG | Total packets | Discarded packets |
| A | 0 | 100 | 0 |
| B | 0 | 100 | 0 |
| C | 0 | 100 | 0 |
| D | 0 | 100 | 0 |
| Quadrant | Total seconds | Saturated seconds | Saturation percentage |
|---|---|---|---|
| A | 4979 | 16 | 0.321350% |
| B | 4979 | 2862 | 57.481422% |
| C | 4979 | 156 | 3.133159% |
| D | 4979 | 2061 | 41.393854% |
Noise dominated data is calculated using 1-second bins in cleaned event files. If a bin has >2000 counts, and if more than 50% of those come from <1% of pixels, then it is considered to be noise-dominated and hence unusable.
| Quadrant | # 1 sec bins | Bins with >0 counts | Bins with >2000 counts | High rate bins dominated by noise | Noise dominated (total time) | Noise dominated (detector-on time) | Marked lightcurve |
|---|---|---|---|---|---|---|---|
| A | 7134 | 4980 | 8 | 8 | 0.11% | 0.16% | 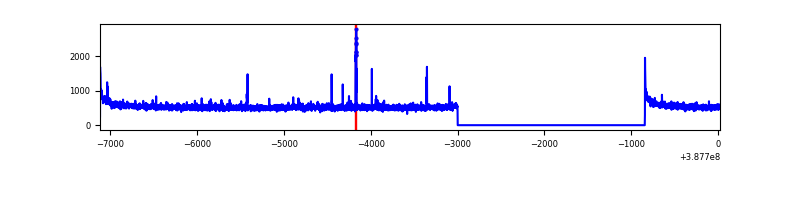 |
| B | 7134 | 4980 | 2388 | 2388 | 33.47% | 47.95% | 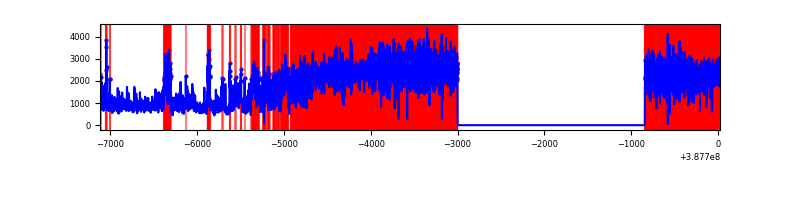 |
| C | 7134 | 4980 | 118 | 118 | 1.65% | 2.37% | 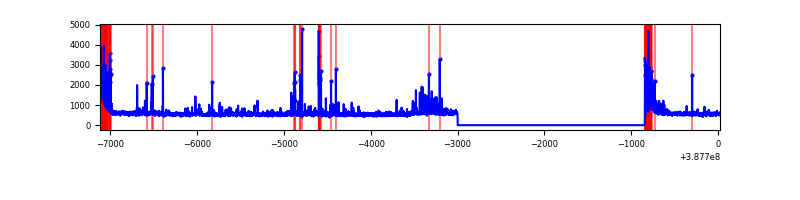 |
| D | 7134 | 4980 | 1715 | 1715 | 24.04% | 34.44% | 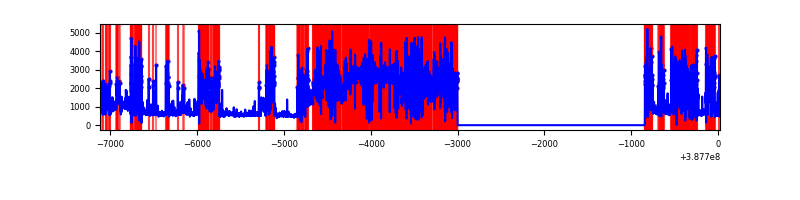 |
Top three noisy pixels from each quadrant. If the there are fewer than three noisy pixels in the level2.evt file, extra rows are filled as -1
| Pixel properties | Quadrant properties | ||||||
|---|---|---|---|---|---|---|---|
| Quadrant | DetID | PixID | Counts | Sigma | Mean | Median | Sigma |
| A | 10 | 83 | 124076 | 943.4 | 647 | 636 | 130.8 |
| A | 9 | 143 | 38736 | 291.18 | 647 | 636 | 130.8 |
| A | 10 | 255 | 15399 | 112.83 | 647 | 636 | 130.8 |
| B | 4 | 251 | 5392746 | 63601.2 | 447 | 437 | 84.8 |
| B | 5 | 14 | 410649 | 4838.37 | 447 | 437 | 84.8 |
| B | 5 | 236 | 408096 | 4808.26 | 447 | 437 | 84.8 |
| C | 0 | 10 | 457923 | 3270.6 | 607 | 614 | 139.8 |
| C | 15 | 214 | 206613 | 1473.27 | 607 | 614 | 139.8 |
| C | 0 | 207 | 173041 | 1233.17 | 607 | 614 | 139.8 |
| D | 7 | 80 | 4969667 | 42369.71 | 474 | 461 | 117.3 |
| D | 8 | 195 | 217616 | 1851.56 | 474 | 461 | 117.3 |
| D | 1 | 47 | 200358 | 1704.41 | 474 | 461 | 117.3 |
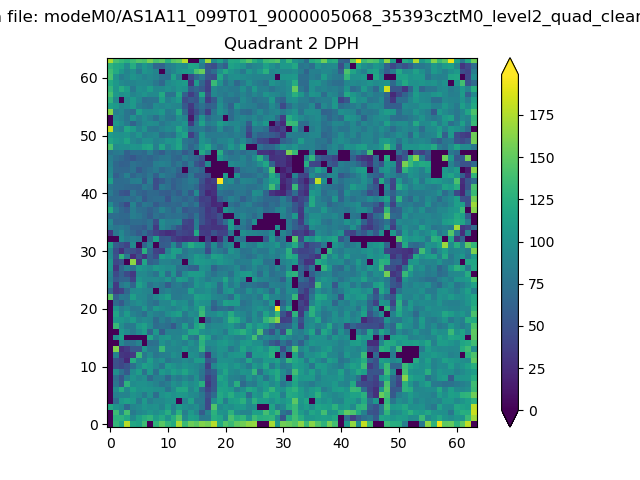
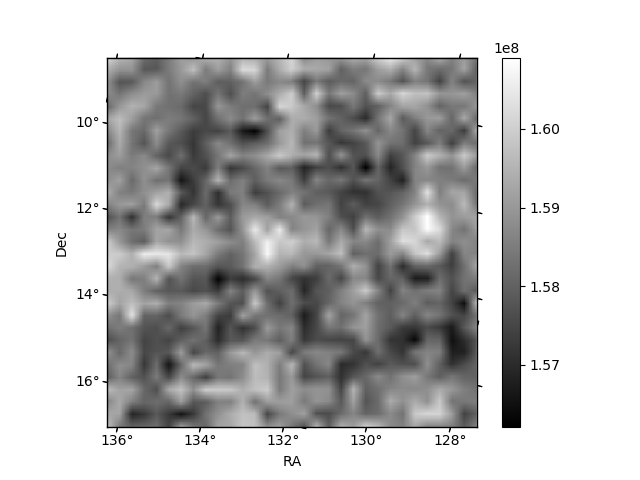
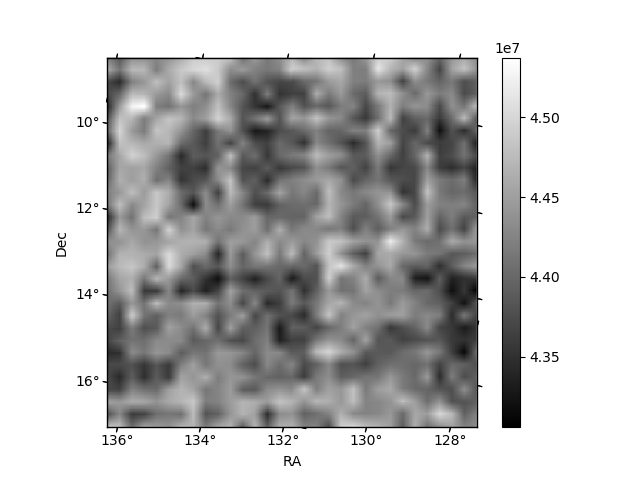
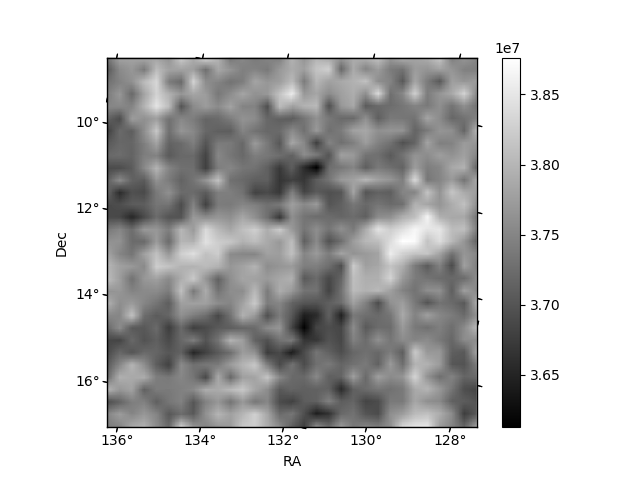
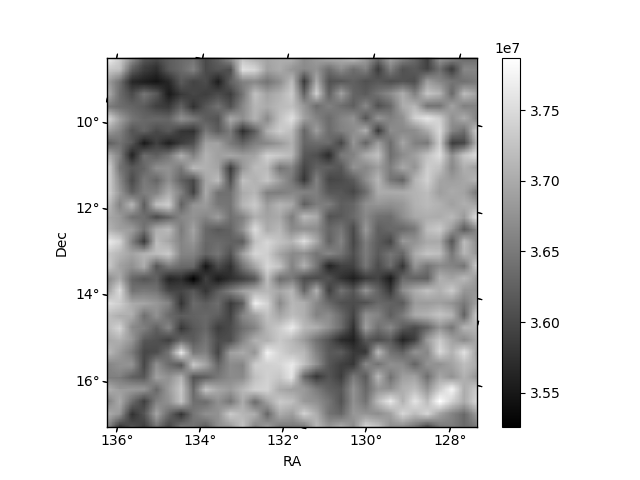
Histogram calculated using DETX and DETY for each event in the final _common_clean file
| Quadrant A | 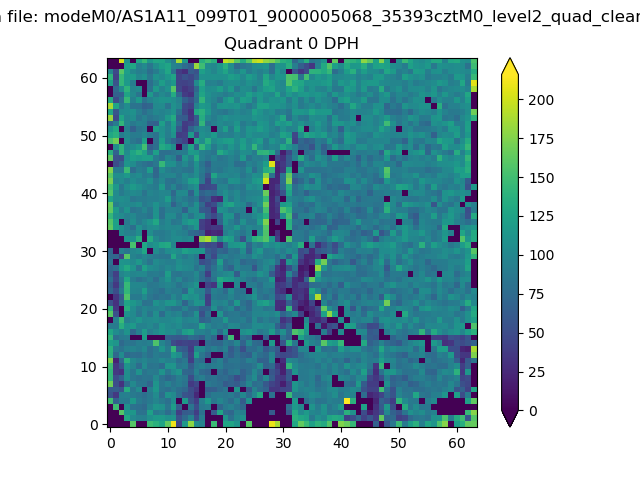 |
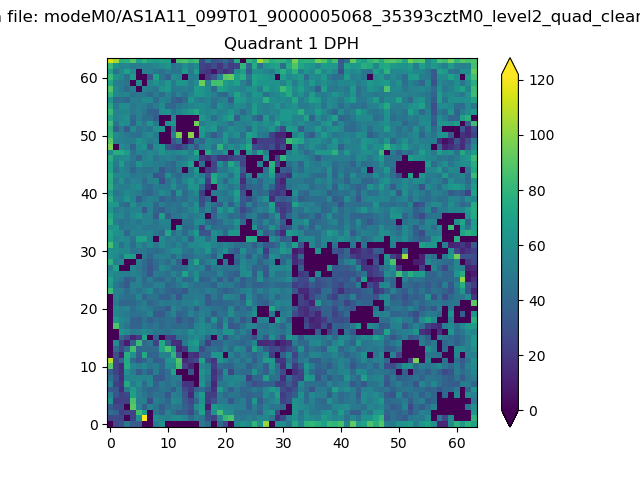 |
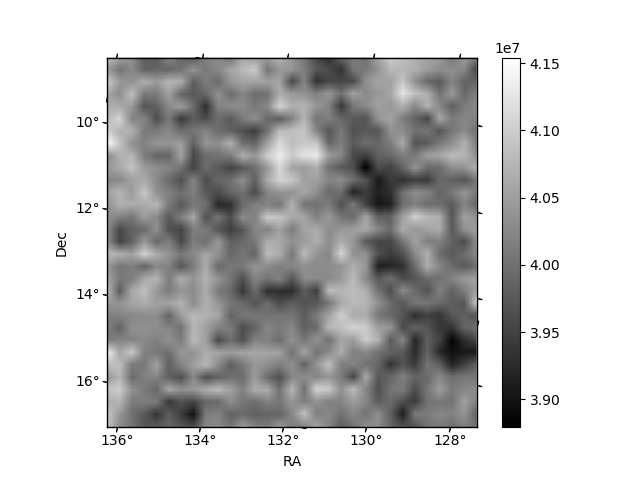
Quadrant B |
|---|---|---|---|
| Quadrant D | 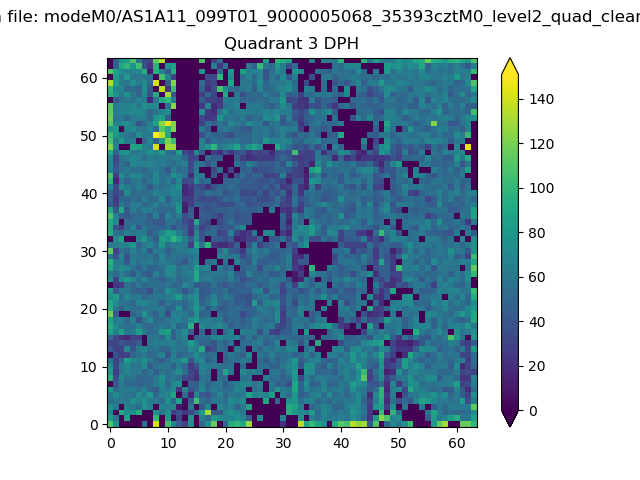 |
 |
Quadrant C |
| Plot type | Count rate plots | Images |
|---|---|---|
| Comparison with Poisson distribution Blue bars denote a histogram of data divided into 1 sec bins. Red curve is a Poisson curve with rate = median count rate of data. |
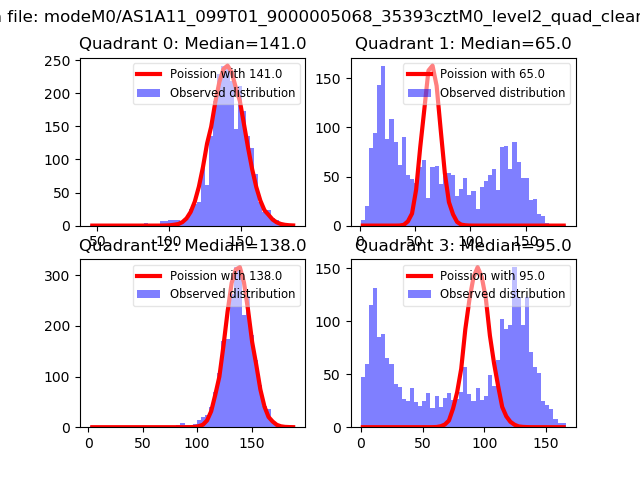 |
 |
| Quadrant-wise count rates Data is divided into 100 sec bins |
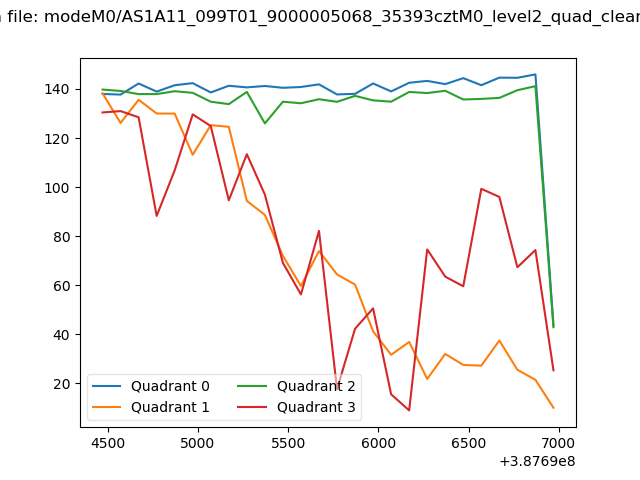 |
|
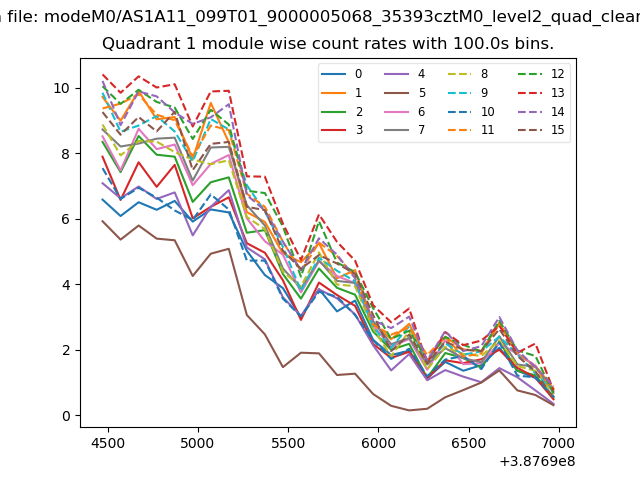
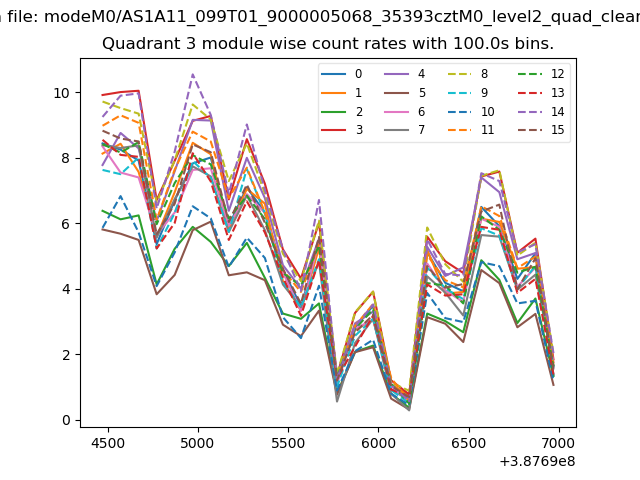
| Module-wise count rates for Quadrant A Data is divided into 100 sec bins |
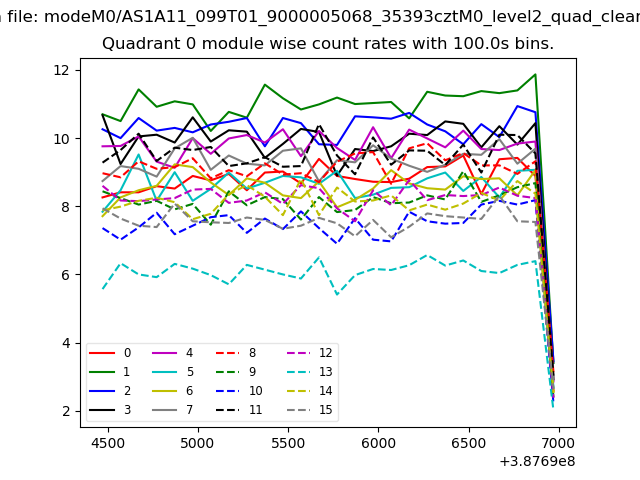 |
 |
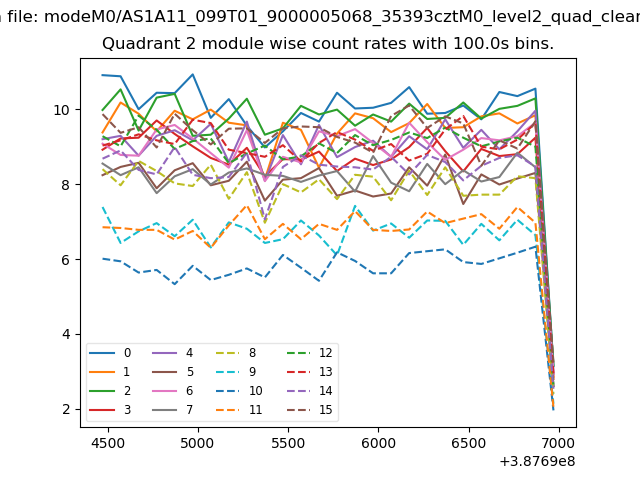
| Module-wise count rates for Quadrant B Data is divided into 100 sec bins |
 |
 |
| Module-wise count rates for Quadrant C Data is divided into 100 sec bins |
 |
 |
| Module-wise count rates for Quadrant D Data is divided into 100 sec bins |
 |
 |
| Parameter | Plot |
|---|---|
| CZT HV Monitor | 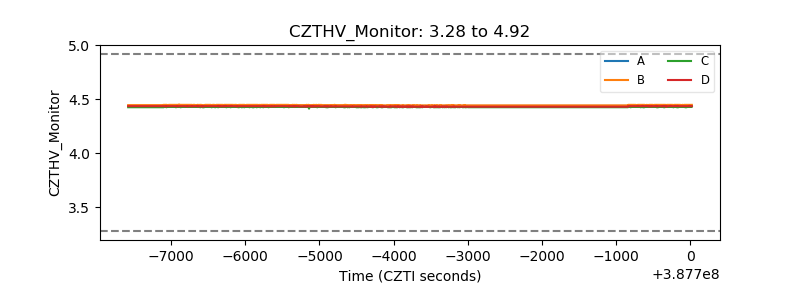 |
| D_VDD | 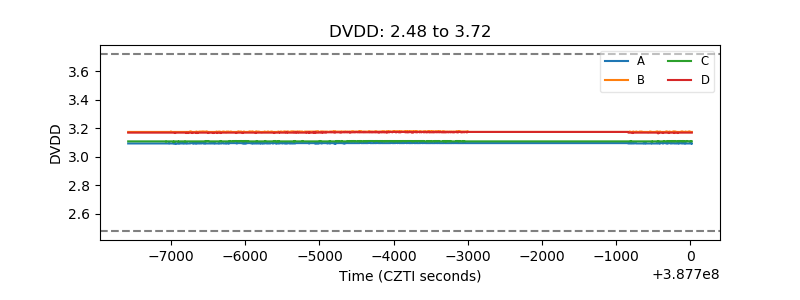 |
| Temperature 1 | 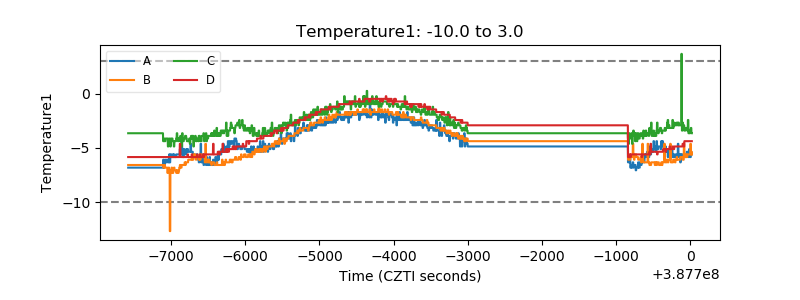 |
| Veto HV Monitor | 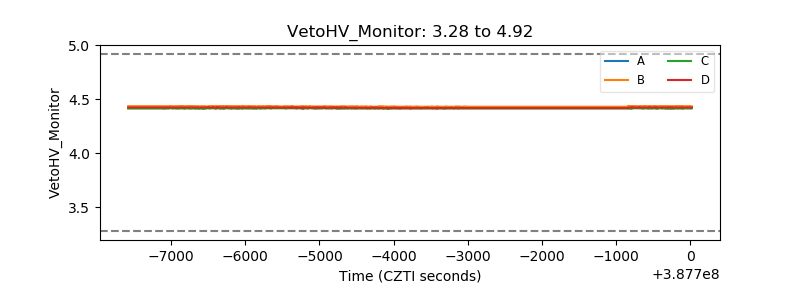 |
| Veto LLD | 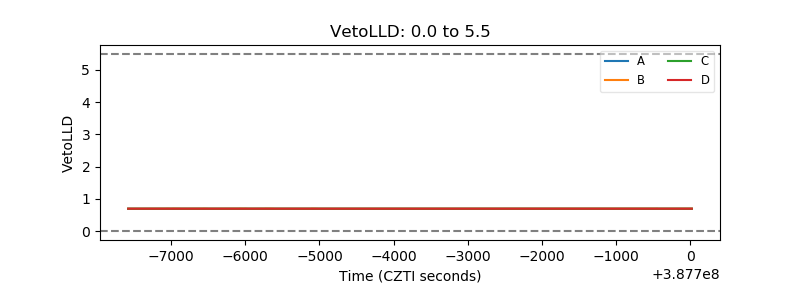 |
| Alpha Counter | 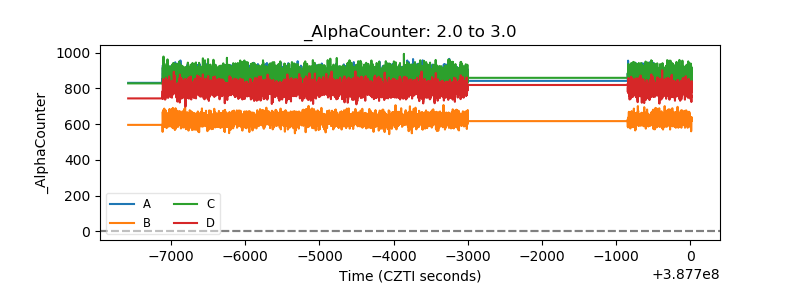 |
| _CPM_Rate | 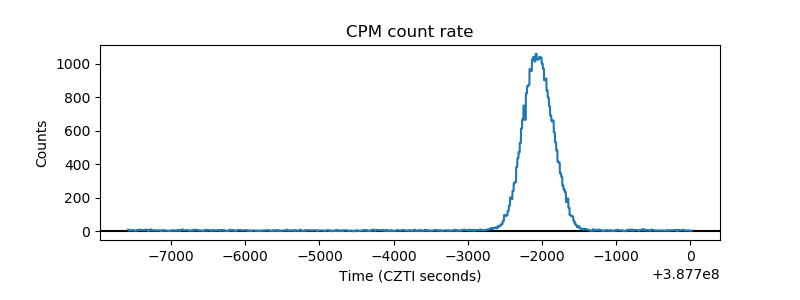 |
| CZT Counter | 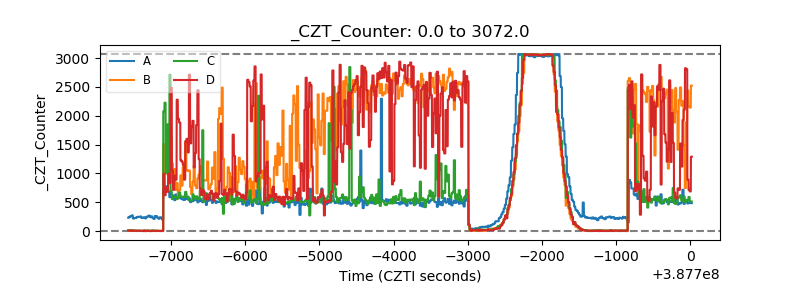 |
| +2.5 Volts monitor | 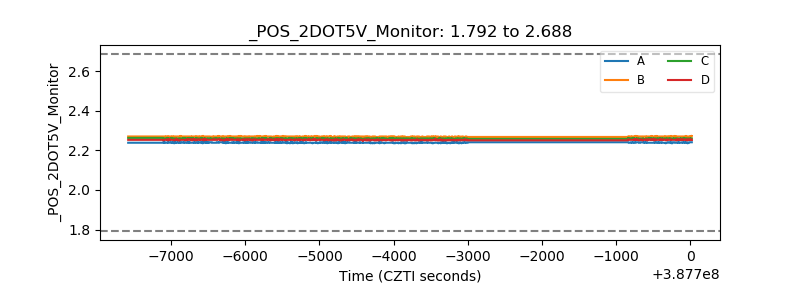 |
| +5 Volts monitor | 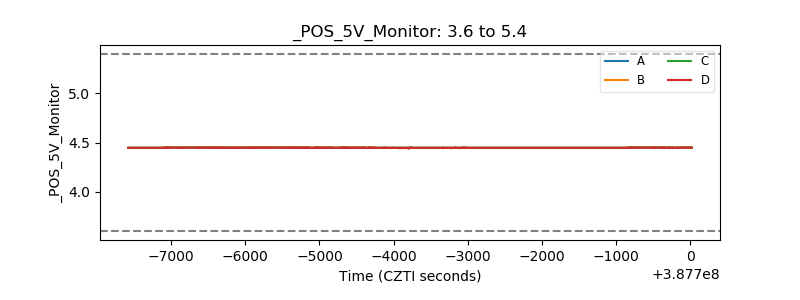 |
| _ROLL_ROT | 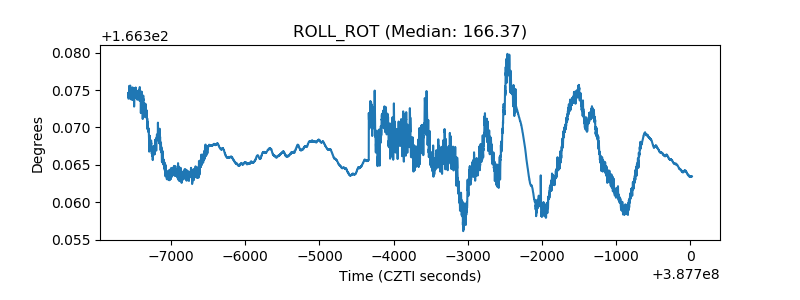 |
| _Roll_DEC | 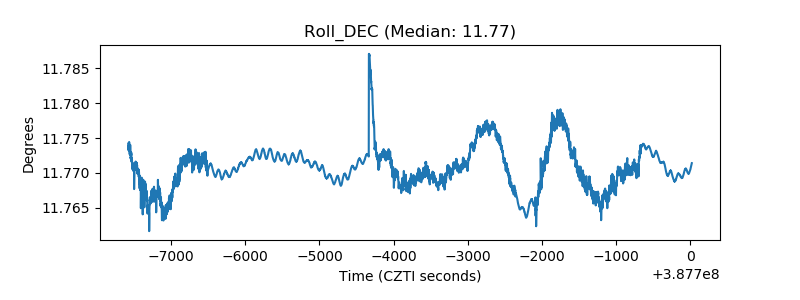 |
| _Roll_RA | 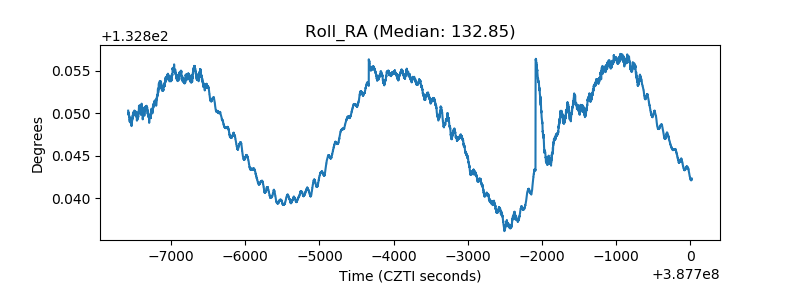 |
| Veto Counter | 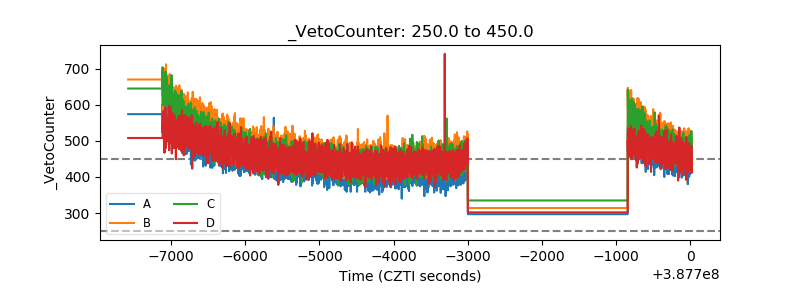 |