| Param | Original file | Final file |
|---|---|---|
| Filename | modeM0/AS1A11_099T01_9000005068_35392cztM0_level2.evt | modeM0/AS1A11_099T01_9000005068_35392cztM0_level2_quad_clean.evt |
| Size (bytes) | 750,902,400 | 42,816,960 |
| Size | 716.1 MB | 40.8 MB |
| Events in quadrant A | 2,816,171 | 307,142 |
| Events in quadrant B | 9,241,409 | 171,129 |
| Events in quadrant C | 5,974,829 | 190,536 |
| Events in quadrant D | 4,354,868 | 258,276 |
| Mode M9 | |||
|---|---|---|---|
| Quadrant | BADHDUFLAG | Total packets | Discarded packets |
| A | 0 | 21 | 0 |
| B | 0 | 21 | 0 |
| C | 0 | 21 | 0 |
| D | 0 | 21 | 0 |
| Mode M0 | |||
|---|---|---|---|
| Quadrant | BADHDUFLAG | Total packets | Discarded packets |
| A | 0 | 11204 | 3 |
| B | 0 | 31059 | 2 |
| C | 0 | 20840 | 2 |
| D | 0 | 16438 | 2 |
| Mode SS | |||
|---|---|---|---|
| Quadrant | BADHDUFLAG | Total packets | Discarded packets |
| A | 0 | 108 | 0 |
| B | 0 | 108 | 0 |
| C | 0 | 108 | 0 |
| D | 0 | 108 | 0 |
| Quadrant | Total seconds | Saturated seconds | Saturation percentage |
|---|---|---|---|
| A | 5242 | 6 | 0.114460% |
| B | 5242 | 2847 | 54.311332% |
| C | 5242 | 1383 | 26.383060% |
| D | 5243 | 448 | 8.544726% |
Noise dominated data is calculated using 1-second bins in cleaned event files. If a bin has >2000 counts, and if more than 50% of those come from <1% of pixels, then it is considered to be noise-dominated and hence unusable.
| Quadrant | # 1 sec bins | Bins with >0 counts | Bins with >2000 counts | High rate bins dominated by noise | Noise dominated (total time) | Noise dominated (detector-on time) | Marked lightcurve |
|---|---|---|---|---|---|---|---|
| A | 7335 | 5243 | 1 | 1 | 0.01% | 0.02% | 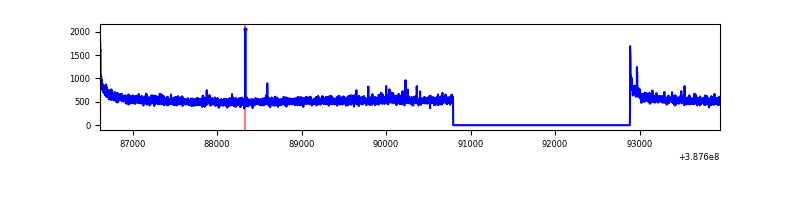 |
| B | 7335 | 5242 | 2428 | 2428 | 33.10% | 46.32% | 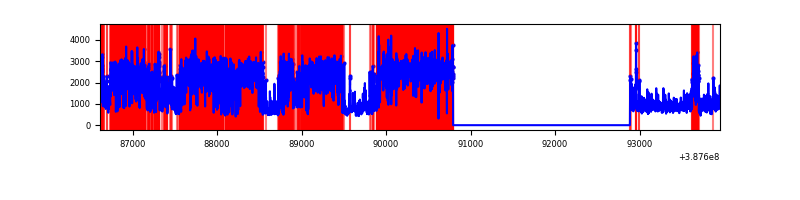 |
| C | 7335 | 5243 | 1311 | 1311 | 17.87% | 25.00% | 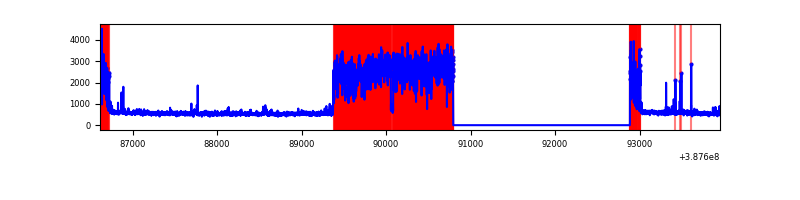 |
| D | 7336 | 5244 | 373 | 373 | 5.08% | 7.11% | 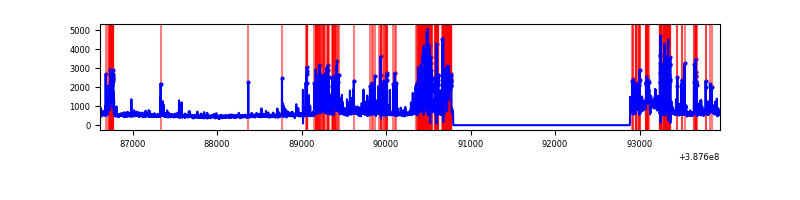 |
Top three noisy pixels from each quadrant. If the there are fewer than three noisy pixels in the level2.evt file, extra rows are filled as -1
| Pixel properties | Quadrant properties | ||||||
|---|---|---|---|---|---|---|---|
| Quadrant | DetID | PixID | Counts | Sigma | Mean | Median | Sigma |
| A | 10 | 83 | 124246 | 907.77 | 688 | 678 | 136.1 |
| A | 13 | 6 | 20078 | 142.52 | 688 | 678 | 136.1 |
| A | 13 | 254 | 9660 | 65.98 | 688 | 678 | 136.1 |
| B | 4 | 251 | 4717406 | 51016.15 | 493 | 482 | 92.5 |
| B | 5 | 236 | 1089783 | 11781.39 | 493 | 482 | 92.5 |
| B | 5 | 14 | 405212 | 4377.38 | 493 | 482 | 92.5 |
| C | 4 | 254 | 3066358 | 23383.16 | 567 | 573 | 131.1 |
| C | 0 | 10 | 367882 | 2801.52 | 567 | 573 | 131.1 |
| C | 15 | 214 | 193582 | 1472.11 | 567 | 573 | 131.1 |
| D | 7 | 80 | 1333474 | 8717.39 | 627 | 610 | 152.9 |
| D | 8 | 195 | 297734 | 1943.29 | 627 | 610 | 152.9 |
| D | 2 | 152 | 71169 | 461.48 | 627 | 610 | 152.9 |
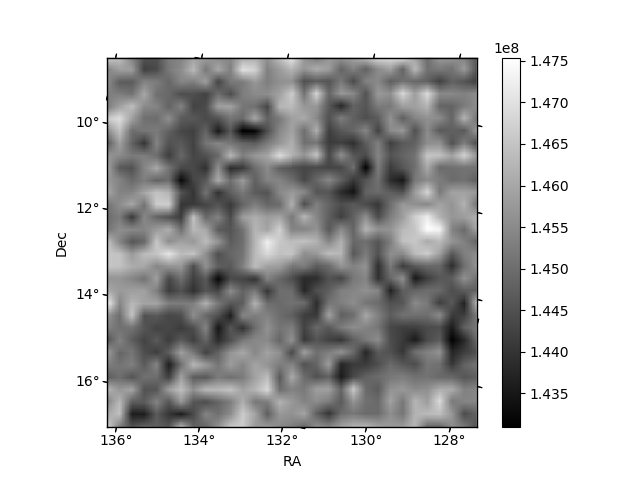
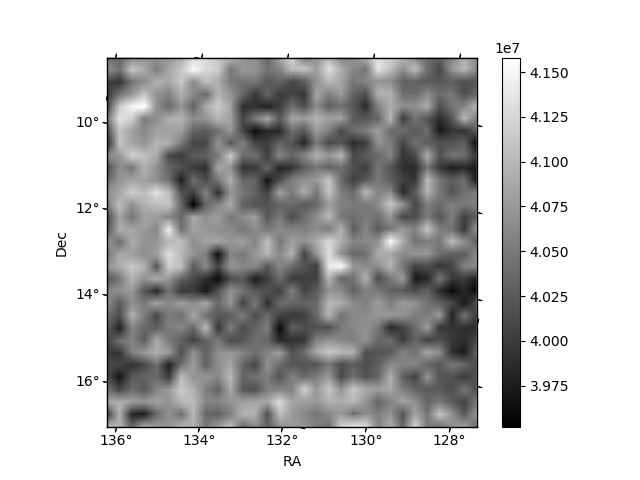
Histogram calculated using DETX and DETY for each event in the final _common_clean file
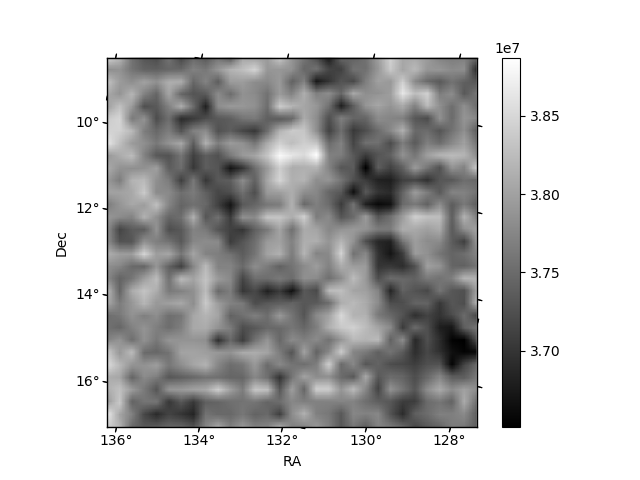
| Quadrant A | 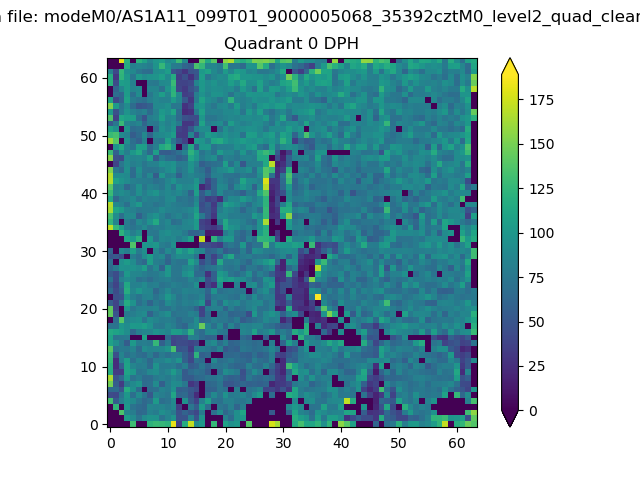 |
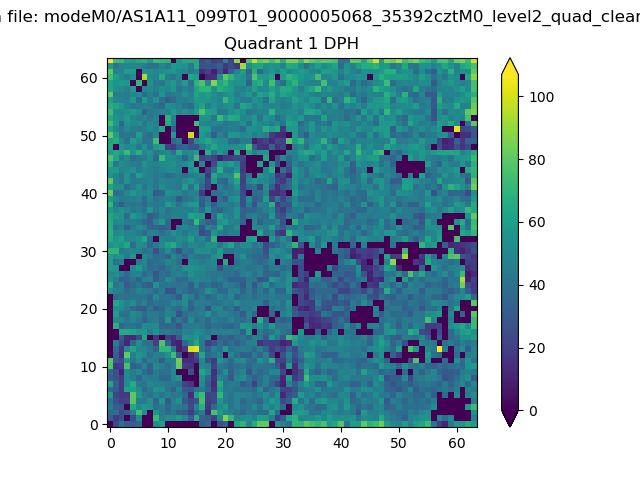 |
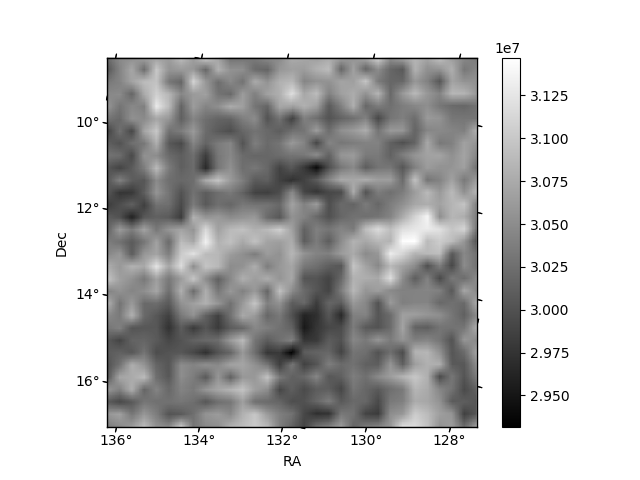
Quadrant B |
|---|---|---|---|
| Quadrant D | 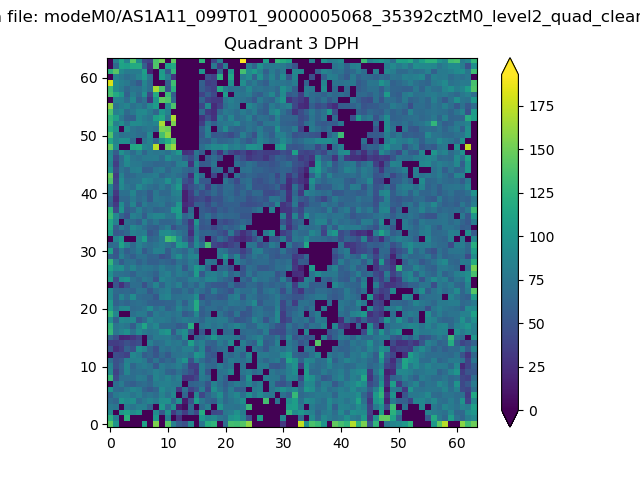 |
 |
Quadrant C |
| Plot type | Count rate plots | Images |
|---|---|---|
| Comparison with Poisson distribution Blue bars denote a histogram of data divided into 1 sec bins. Red curve is a Poisson curve with rate = median count rate of data. |
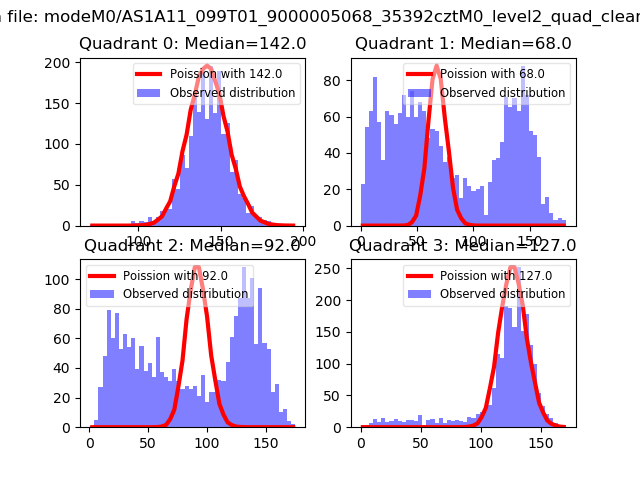 |
 |
| Quadrant-wise count rates Data is divided into 100 sec bins |
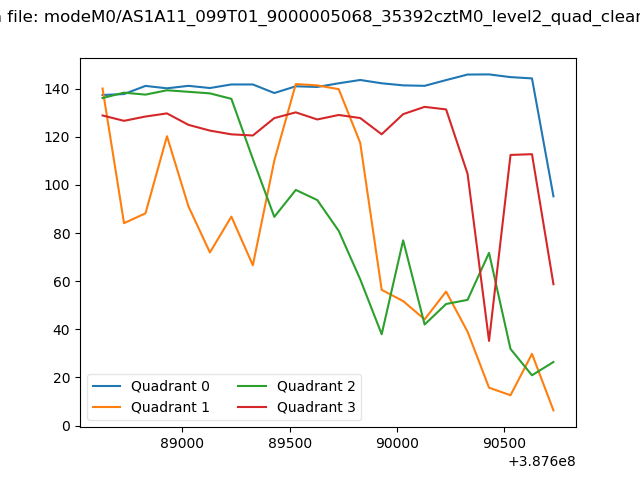 |
|
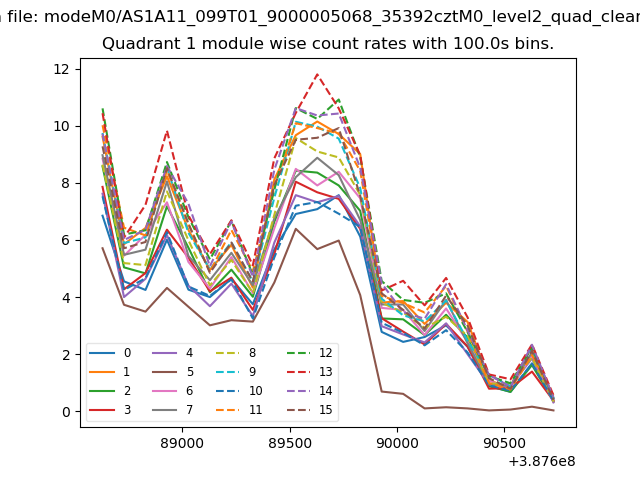
| Module-wise count rates for Quadrant A Data is divided into 100 sec bins |
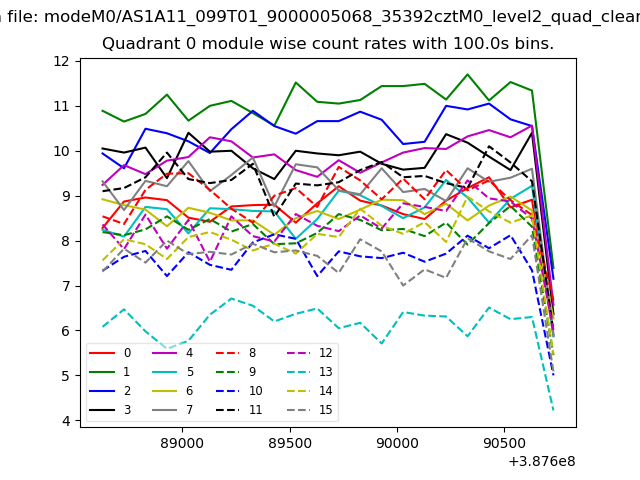 |
 |
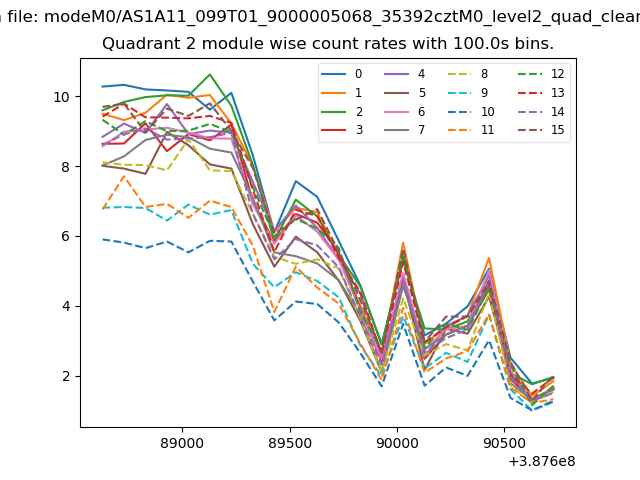
| Module-wise count rates for Quadrant B Data is divided into 100 sec bins |
 |
 |
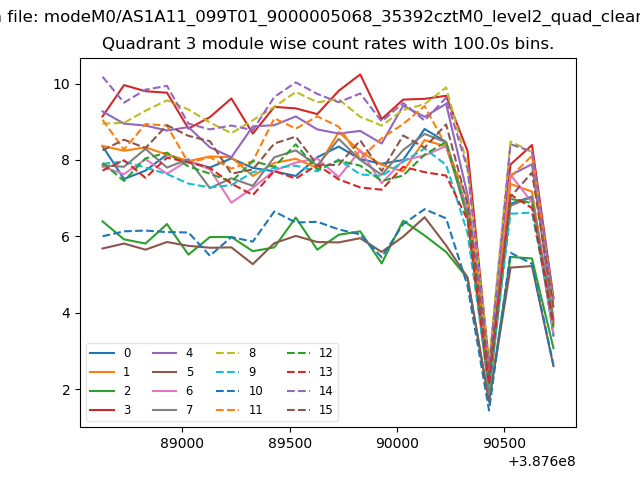
| Module-wise count rates for Quadrant C Data is divided into 100 sec bins |
 |
 |
| Module-wise count rates for Quadrant D Data is divided into 100 sec bins |
 |
 |
| Parameter | Plot |
|---|---|
| CZT HV Monitor | 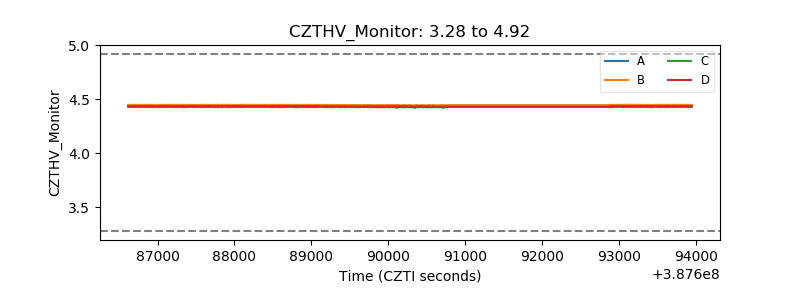 |
| D_VDD | 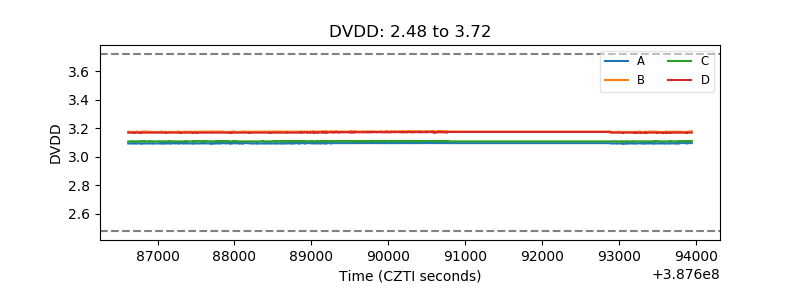 |
| Temperature 1 | 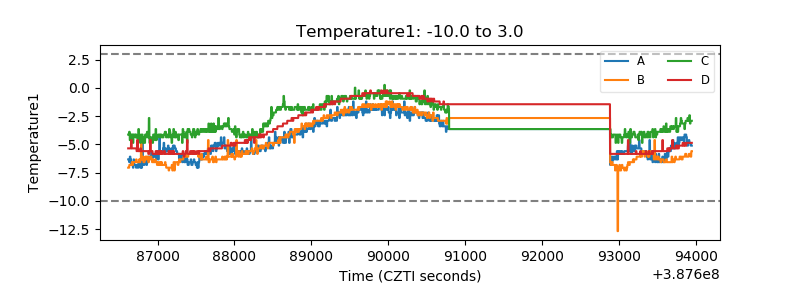 |
| Veto HV Monitor | 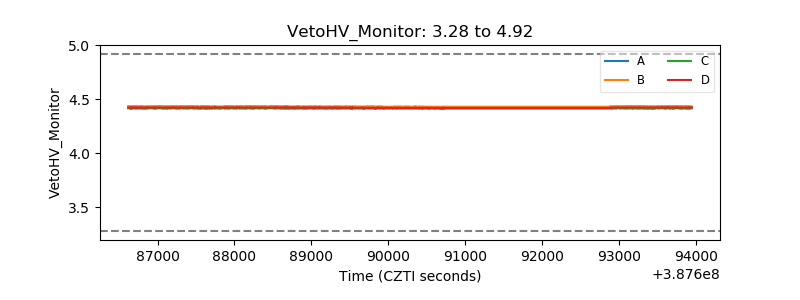 |
| Veto LLD | 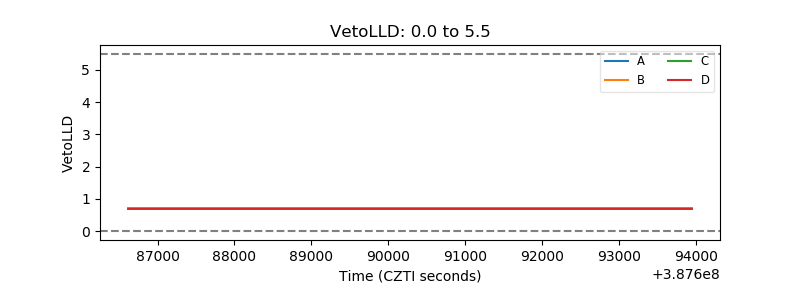 |
| Alpha Counter | 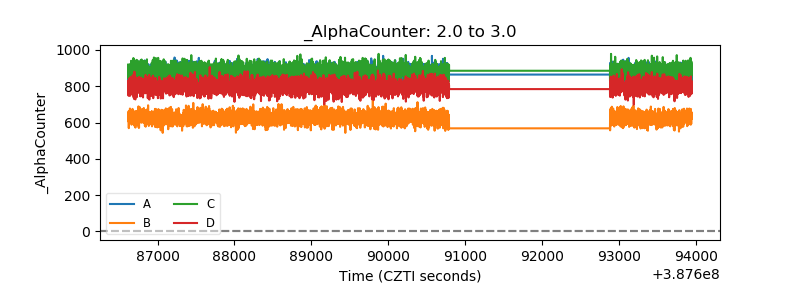 |
| _CPM_Rate | 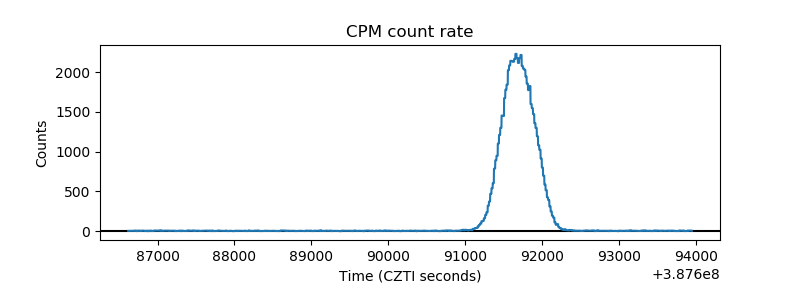 |
| CZT Counter | 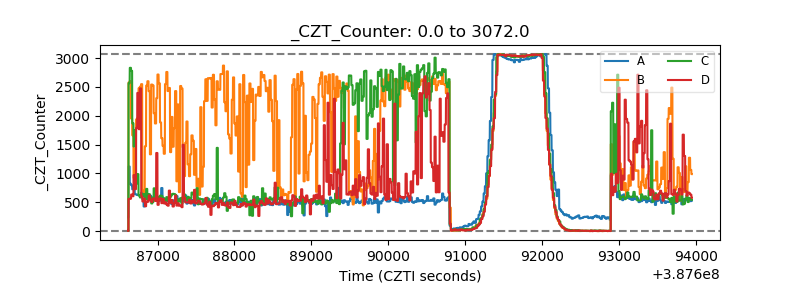 |
| +2.5 Volts monitor | 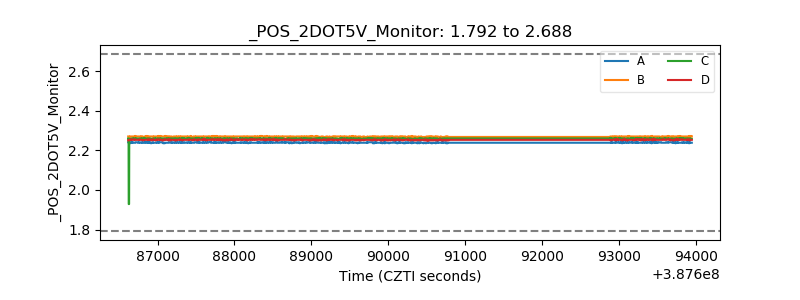 |
| +5 Volts monitor | 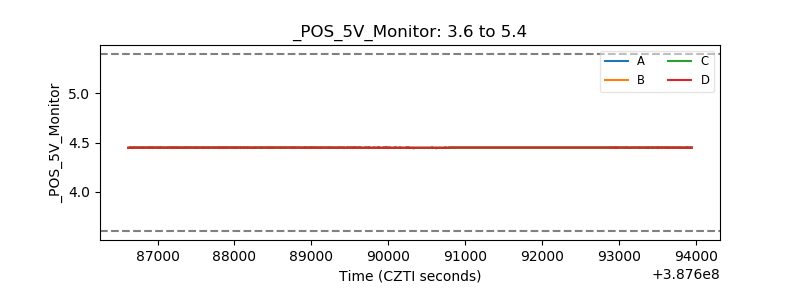 |
| _ROLL_ROT | 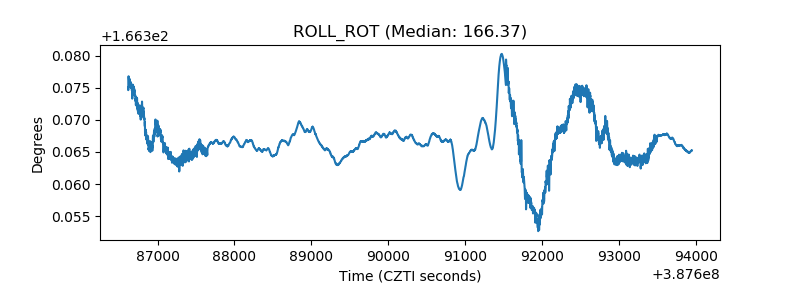 |
| _Roll_DEC | 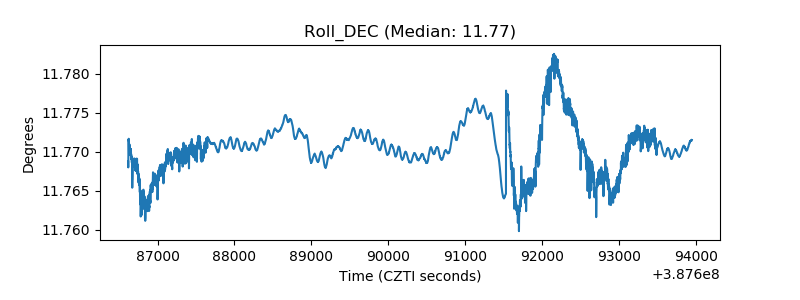 |
| _Roll_RA | 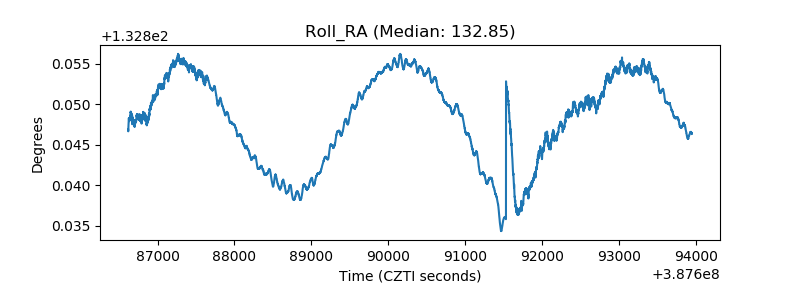 |
| Veto Counter | 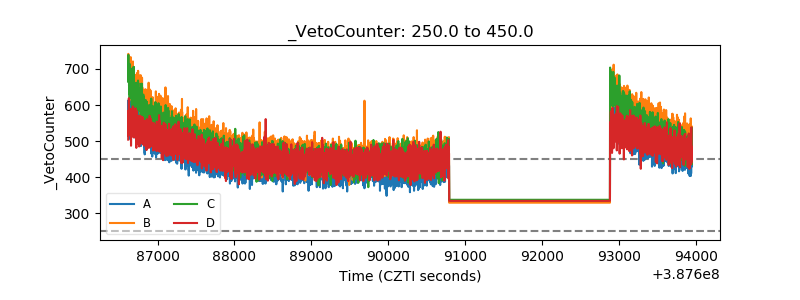 |