| Param | Original file | Final file |
|---|---|---|
| Filename | modeM0/AS1A11_099T01_9000005068_35391cztM0_level2.evt | modeM0/AS1A11_099T01_9000005068_35391cztM0_level2_quad_clean.evt |
| Size (bytes) | 704,079,360 | 42,672,960 |
| Size | 671.5 MB | 40.7 MB |
| Events in quadrant A | 2,772,873 | 281,787 |
| Events in quadrant B | 11,088,154 | 111,508 |
| Events in quadrant C | 3,310,967 | 270,721 |
| Events in quadrant D | 3,795,628 | 258,825 |
| Mode M9 | |||
|---|---|---|---|
| Quadrant | BADHDUFLAG | Total packets | Discarded packets |
| A | 0 | 35 | 0 |
| B | 0 | 35 | 0 |
| C | 0 | 35 | 0 |
| D | 0 | 36 | 0 |
| Mode M0 | |||
|---|---|---|---|
| Quadrant | BADHDUFLAG | Total packets | Discarded packets |
| A | 0 | 11157 | 3 |
| B | 0 | 36481 | 2 |
| C | 0 | 12816 | 2 |
| D | 0 | 14644 | 2 |
| Mode SS | |||
|---|---|---|---|
| Quadrant | BADHDUFLAG | Total packets | Discarded packets |
| A | 0 | 106 | 0 |
| B | 0 | 106 | 0 |
| C | 0 | 106 | 0 |
| D | 0 | 106 | 0 |
| Quadrant | Total seconds | Saturated seconds | Saturation percentage |
|---|---|---|---|
| A | 5255 | 7 | 0.133206% |
| B | 5255 | 4052 | 77.107517% |
| C | 5255 | 167 | 3.177926% |
| D | 5255 | 241 | 4.586108% |
Noise dominated data is calculated using 1-second bins in cleaned event files. If a bin has >2000 counts, and if more than 50% of those come from <1% of pixels, then it is considered to be noise-dominated and hence unusable.
| Quadrant | # 1 sec bins | Bins with >0 counts | Bins with >2000 counts | High rate bins dominated by noise | Noise dominated (total time) | Noise dominated (detector-on time) | Marked lightcurve |
|---|---|---|---|---|---|---|---|
| A | 7257 | 5256 | 0 | 0 | 0.00% | 0.00% | 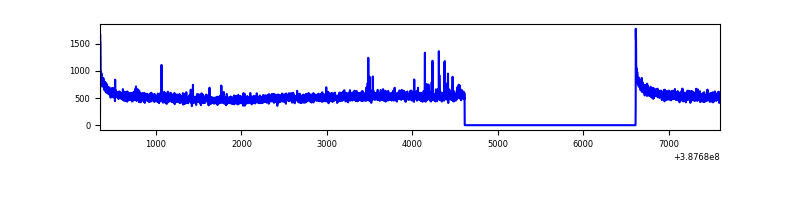 |
| B | 7257 | 5256 | 3385 | 3385 | 46.64% | 64.40% | 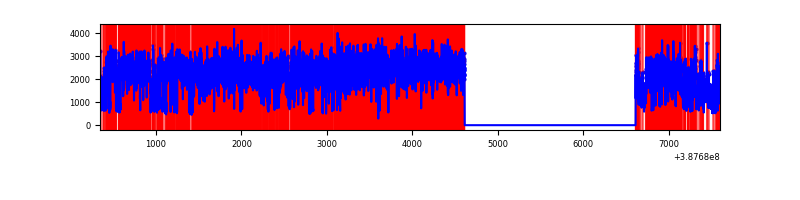 |
| C | 7257 | 5256 | 131 | 131 | 1.81% | 2.49% | 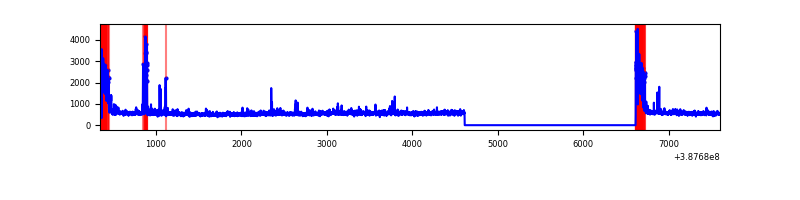 |
| D | 7257 | 5256 | 203 | 203 | 2.80% | 3.86% |  |
Top three noisy pixels from each quadrant. If the there are fewer than three noisy pixels in the level2.evt file, extra rows are filled as -1
| Pixel properties | Quadrant properties | ||||||
|---|---|---|---|---|---|---|---|
| Quadrant | DetID | PixID | Counts | Sigma | Mean | Median | Sigma |
| A | 10 | 83 | 123487 | 900.74 | 677 | 665 | 136.4 |
| A | 9 | 143 | 14172 | 99.06 | 677 | 665 | 136.4 |
| A | 13 | 6 | 14046 | 98.13 | 677 | 665 | 136.4 |
| B | 4 | 251 | 7915860 | 103252.12 | 407 | 399 | 76.7 |
| B | 5 | 14 | 327062 | 4261.11 | 407 | 399 | 76.7 |
| B | 5 | 31 | 304212 | 3963.05 | 407 | 399 | 76.7 |
| C | 0 | 10 | 380572 | 2559.62 | 641 | 647 | 148.4 |
| C | 15 | 214 | 216962 | 1457.35 | 641 | 647 | 148.4 |
| C | 0 | 207 | 129939 | 871.06 | 641 | 647 | 148.4 |
| D | 7 | 80 | 809575 | 5199.95 | 634 | 618 | 155.6 |
| D | 2 | 152 | 96312 | 615.12 | 634 | 618 | 155.6 |
| D | 8 | 195 | 94996 | 606.66 | 634 | 618 | 155.6 |
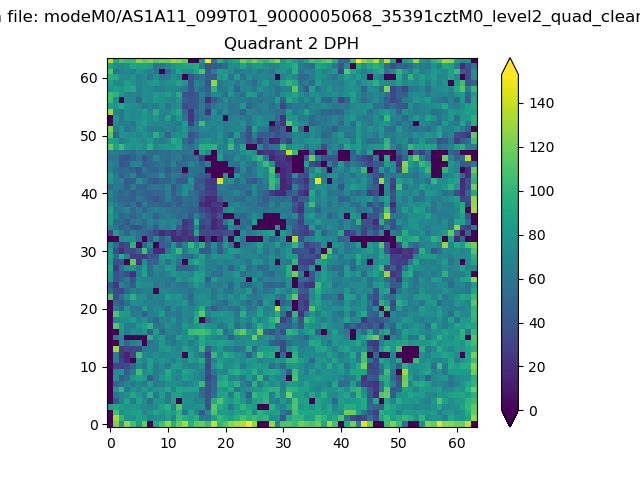
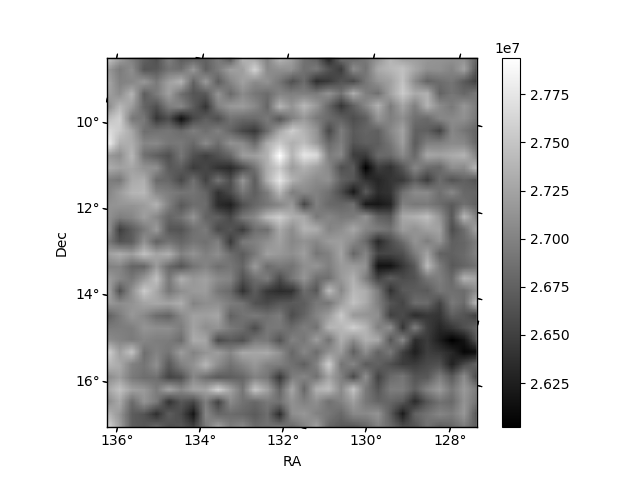
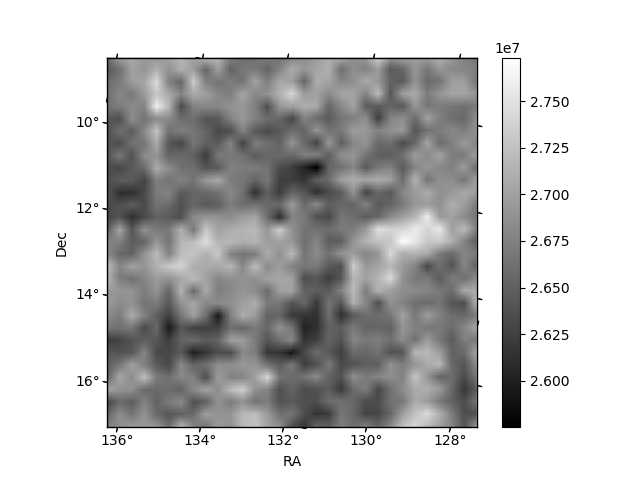
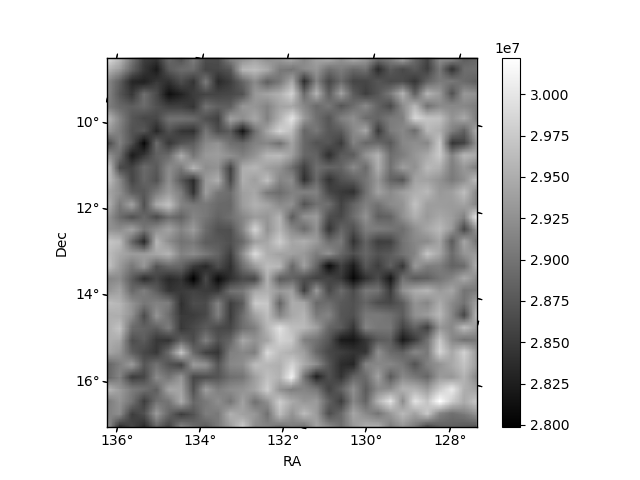
Histogram calculated using DETX and DETY for each event in the final _common_clean file
| Quadrant A | 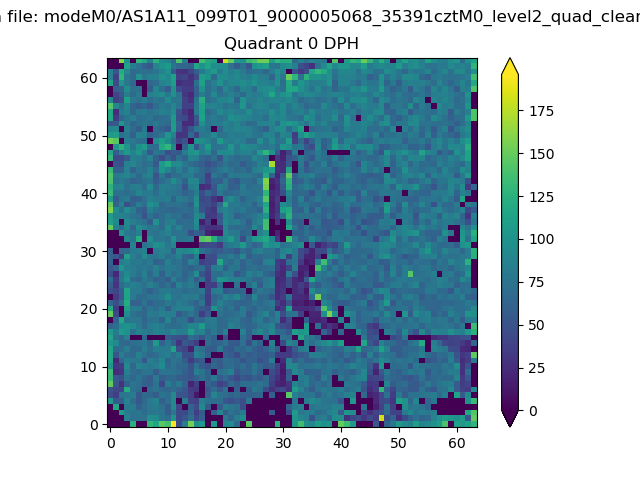 |
 |
Quadrant B |
|---|---|---|---|
| Quadrant D | 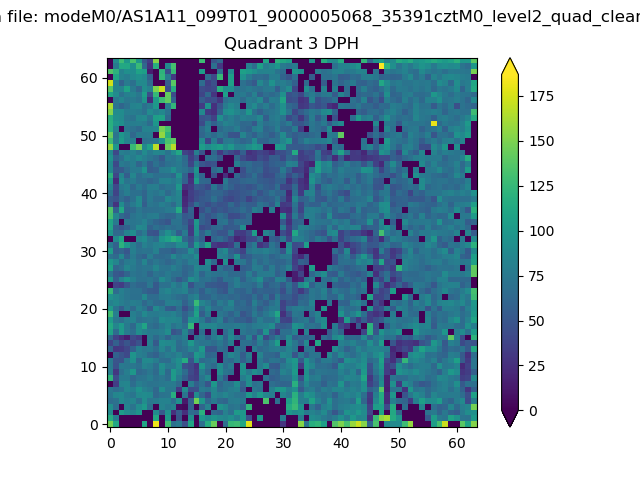 |
 |
Quadrant C |
| Plot type | Count rate plots | Images |
|---|---|---|
| Comparison with Poisson distribution Blue bars denote a histogram of data divided into 1 sec bins. Red curve is a Poisson curve with rate = median count rate of data. |
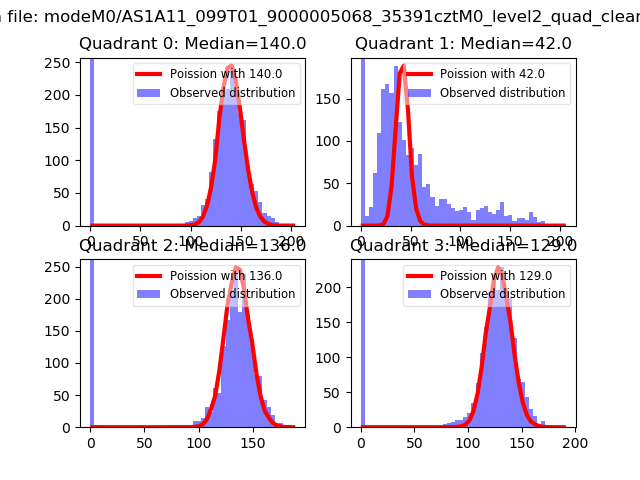 |
 |
| Quadrant-wise count rates Data is divided into 100 sec bins |
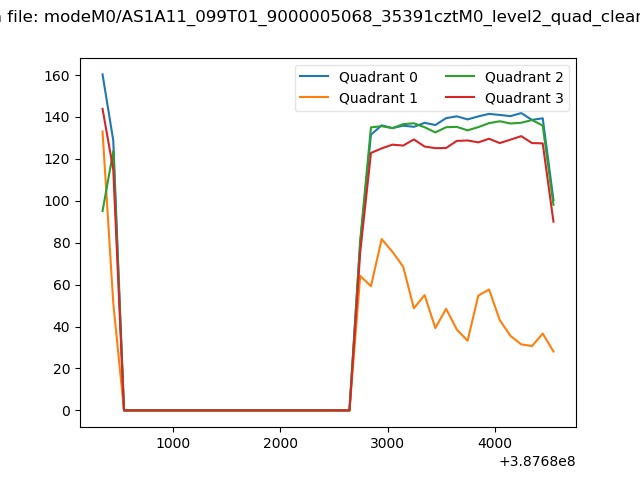 |
|
| Module-wise count rates for Quadrant A Data is divided into 100 sec bins |
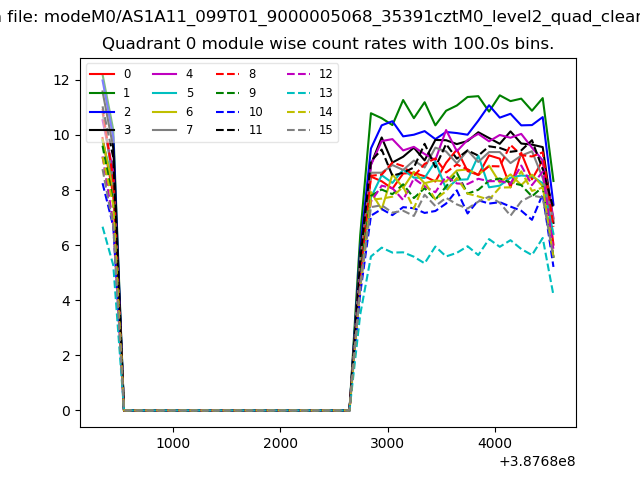 |
 |
| Module-wise count rates for Quadrant B Data is divided into 100 sec bins |
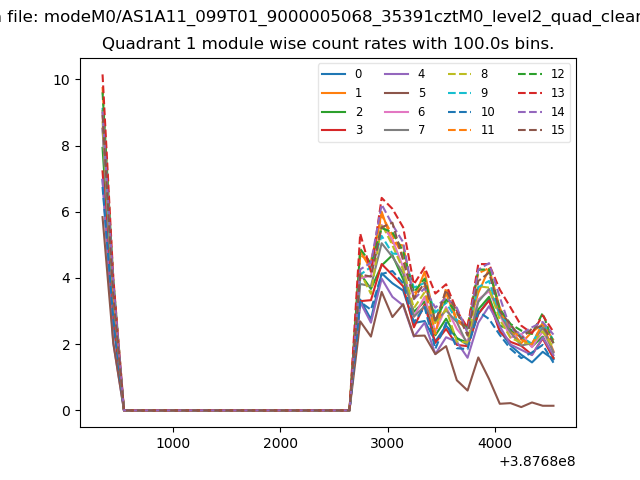 |
 |
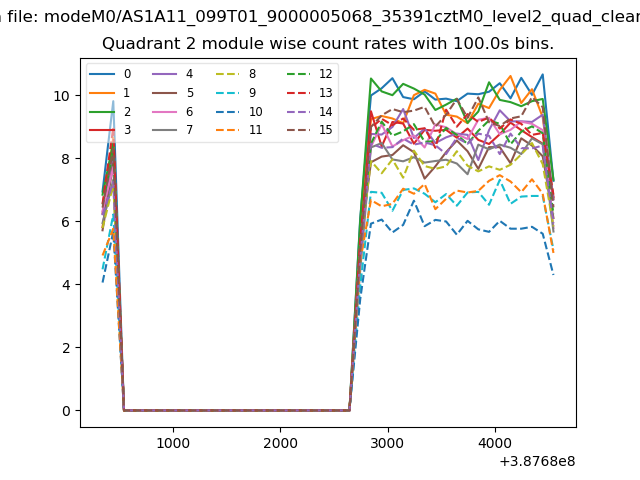
| Module-wise count rates for Quadrant C Data is divided into 100 sec bins |
 |
 |
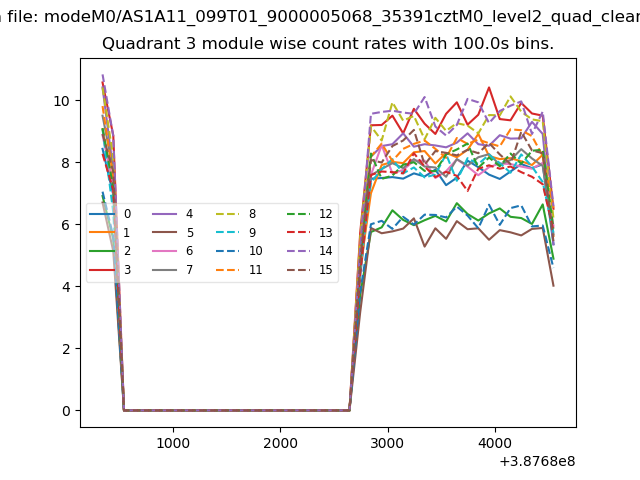
| Module-wise count rates for Quadrant D Data is divided into 100 sec bins |
 |
 |
| Parameter | Plot |
|---|---|
| CZT HV Monitor | 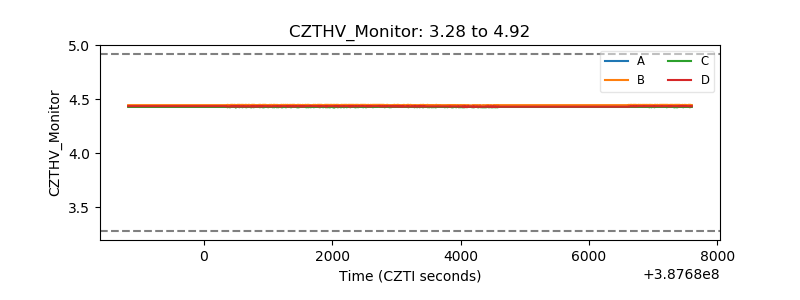 |
| D_VDD | 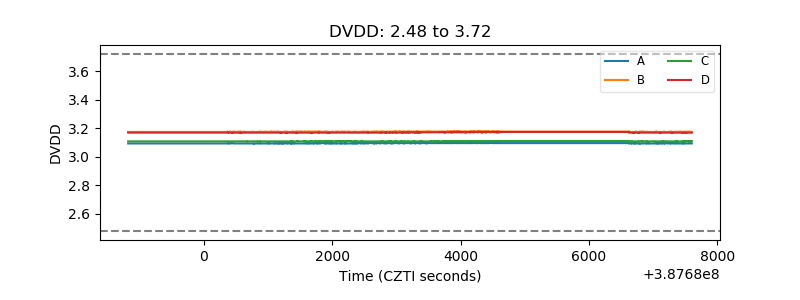 |
| Temperature 1 | 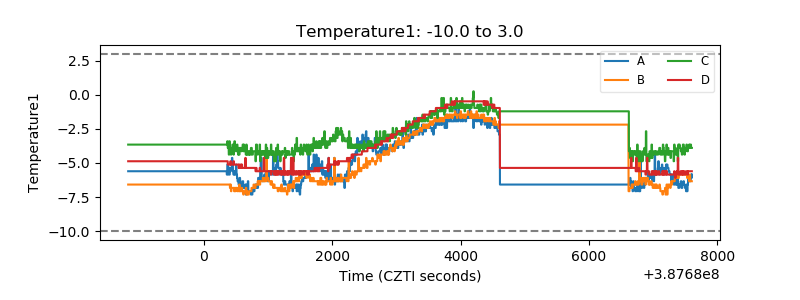 |
| Veto HV Monitor | 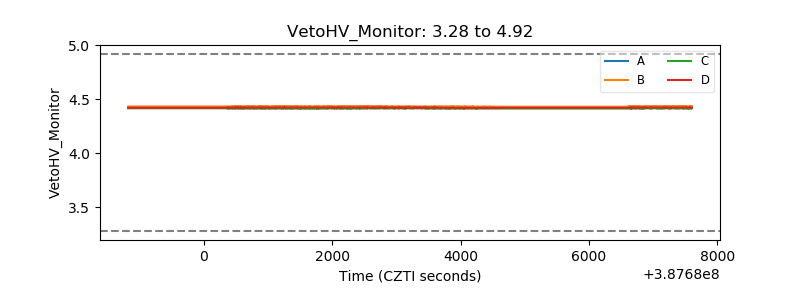 |
| Veto LLD | 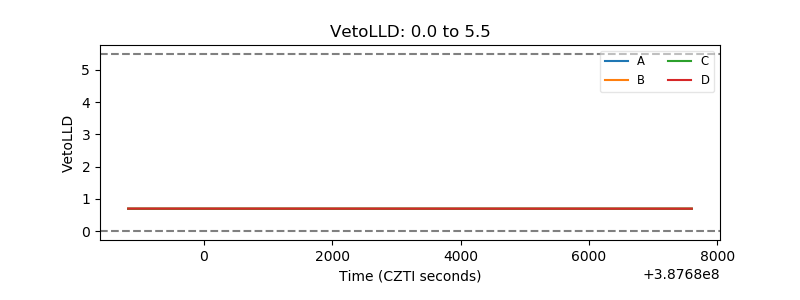 |
| Alpha Counter | 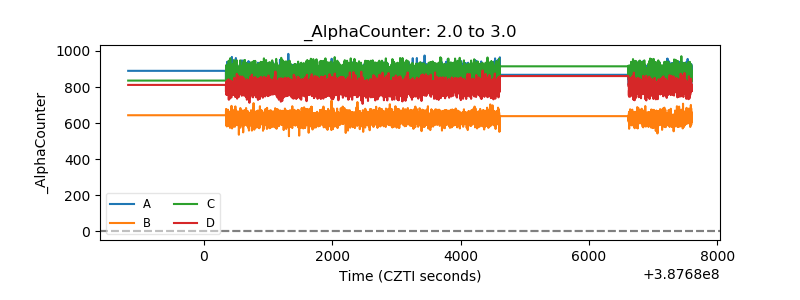 |
| _CPM_Rate | 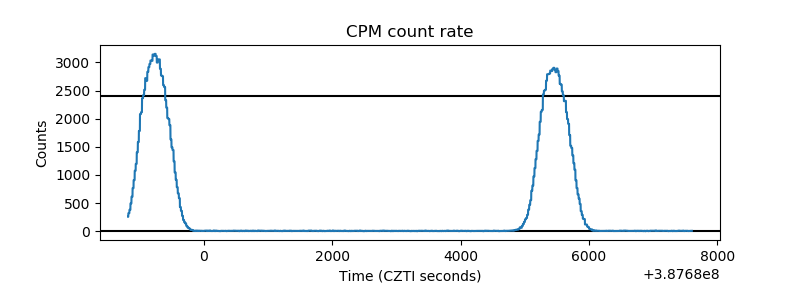 |
| CZT Counter | 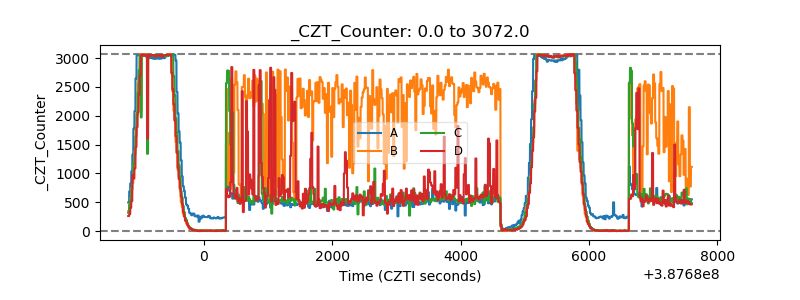 |
| +2.5 Volts monitor | 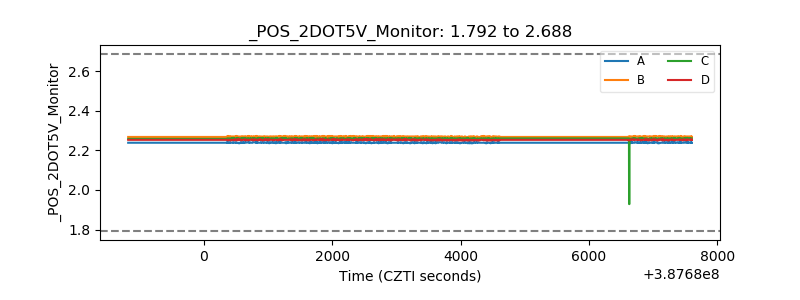 |
| +5 Volts monitor | 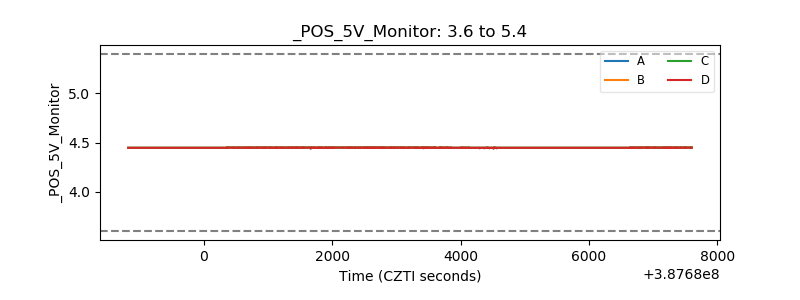 |
| _ROLL_ROT | 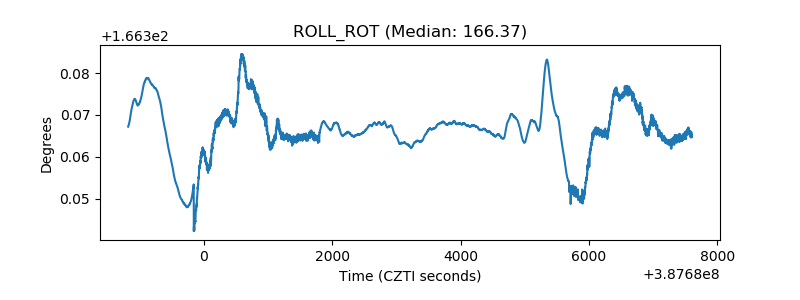 |
| _Roll_DEC | 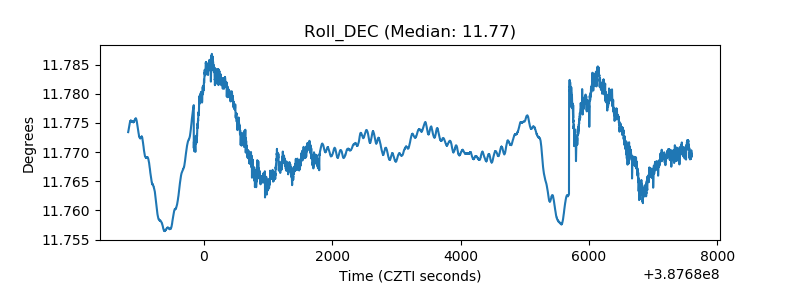 |
| _Roll_RA | 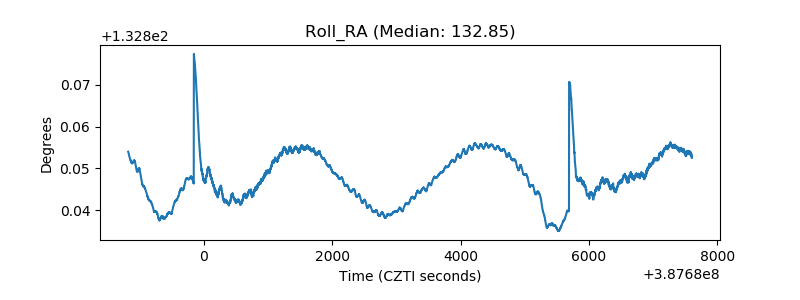 |
| Veto Counter | 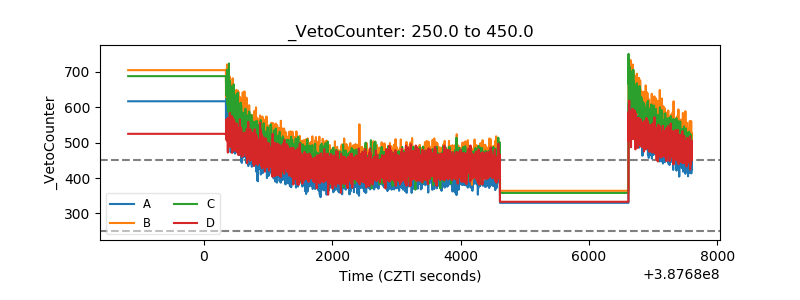 |