| Param | Original file | Final file |
|---|---|---|
| Filename | modeM0/AS1A11_099T01_9000005068_35390cztM0_level2.evt | modeM0/AS1A11_099T01_9000005068_35390cztM0_level2_quad_clean.evt |
| Size (bytes) | 701,317,440 | 46,618,560 |
| Size | 668.8 MB | 44.5 MB |
| Events in quadrant A | 2,645,205 | 320,520 |
| Events in quadrant B | 10,892,104 | 128,520 |
| Events in quadrant C | 3,181,613 | 302,258 |
| Events in quadrant D | 4,168,808 | 294,654 |
| Mode M9 | |||
|---|---|---|---|
| Quadrant | BADHDUFLAG | Total packets | Discarded packets |
| A | 0 | 22 | 0 |
| B | 0 | 22 | 0 |
| C | 0 | 22 | 0 |
| D | 0 | 23 | 0 |
| Mode M0 | |||
|---|---|---|---|
| Quadrant | BADHDUFLAG | Total packets | Discarded packets |
| A | 0 | 10965 | 3 |
| B | 0 | 35880 | 2 |
| C | 0 | 12431 | 2 |
| D | 0 | 16007 | 2 |
| Mode SS | |||
|---|---|---|---|
| Quadrant | BADHDUFLAG | Total packets | Discarded packets |
| A | 0 | 106 | 0 |
| B | 0 | 106 | 0 |
| C | 0 | 106 | 0 |
| D | 0 | 106 | 0 |
| Quadrant | Total seconds | Saturated seconds | Saturation percentage |
|---|---|---|---|
| A | 5197 | 6 | 0.115451% |
| B | 5197 | 3989 | 76.755821% |
| C | 5197 | 181 | 3.482779% |
| D | 5197 | 243 | 4.675774% |
Noise dominated data is calculated using 1-second bins in cleaned event files. If a bin has >2000 counts, and if more than 50% of those come from <1% of pixels, then it is considered to be noise-dominated and hence unusable.
| Quadrant | # 1 sec bins | Bins with >0 counts | Bins with >2000 counts | High rate bins dominated by noise | Noise dominated (total time) | Noise dominated (detector-on time) | Marked lightcurve |
|---|---|---|---|---|---|---|---|
| A | 7079 | 5198 | 1 | 1 | 0.01% | 0.02% | 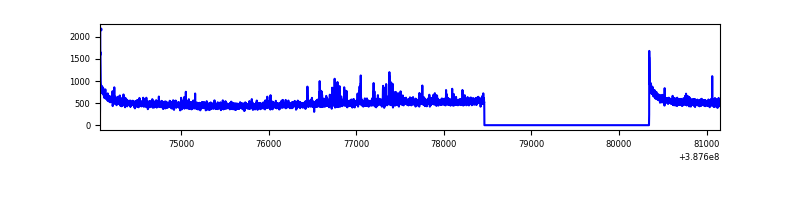 |
| B | 7079 | 5198 | 3429 | 3429 | 48.44% | 65.97% | 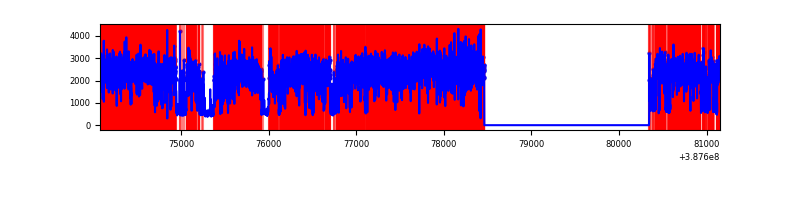 |
| C | 7079 | 5198 | 126 | 126 | 1.78% | 2.42% | 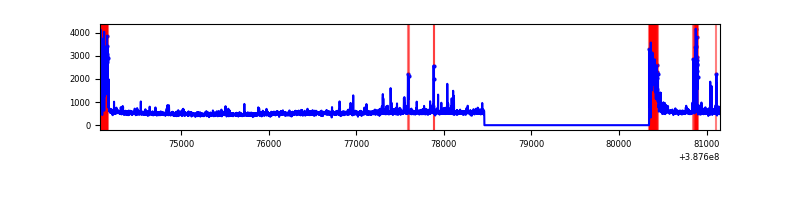 |
| D | 7079 | 5198 | 217 | 217 | 3.07% | 4.17% | 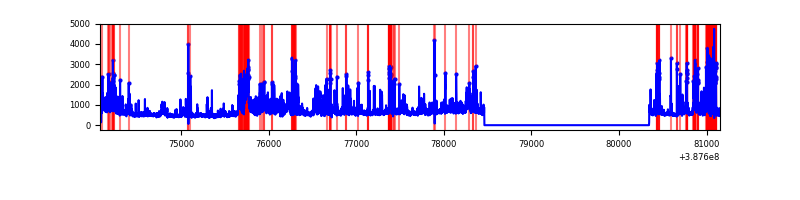 |
Top three noisy pixels from each quadrant. If the there are fewer than three noisy pixels in the level2.evt file, extra rows are filled as -1
| Pixel properties | Quadrant properties | ||||||
|---|---|---|---|---|---|---|---|
| Quadrant | DetID | PixID | Counts | Sigma | Mean | Median | Sigma |
| A | 10 | 83 | 120253 | 921.01 | 641 | 629 | 129.9 |
| A | 7 | 48 | 38641 | 292.66 | 641 | 629 | 129.9 |
| A | 13 | 254 | 8797 | 62.89 | 641 | 629 | 129.9 |
| B | 4 | 251 | 8678541 | 119170.02 | 381 | 371 | 72.8 |
| B | 5 | 236 | 258545 | 3545.29 | 381 | 371 | 72.8 |
| B | 5 | 172 | 256517 | 3517.44 | 381 | 371 | 72.8 |
| C | 0 | 10 | 382961 | 2685.57 | 610 | 615 | 142.4 |
| C | 15 | 214 | 212403 | 1487.58 | 610 | 615 | 142.4 |
| C | 0 | 207 | 151298 | 1058.39 | 610 | 615 | 142.4 |
| D | 7 | 80 | 1034177 | 6937.72 | 605 | 588 | 149.0 |
| D | 8 | 195 | 354440 | 2375.14 | 605 | 588 | 149.0 |
| D | 13 | 249 | 124242 | 829.99 | 605 | 588 | 149.0 |
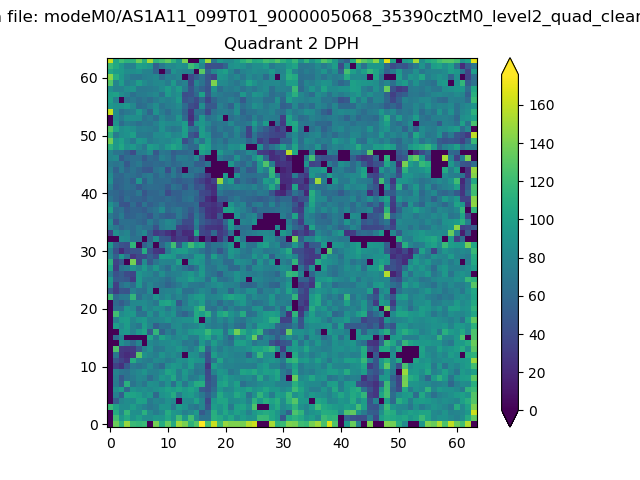
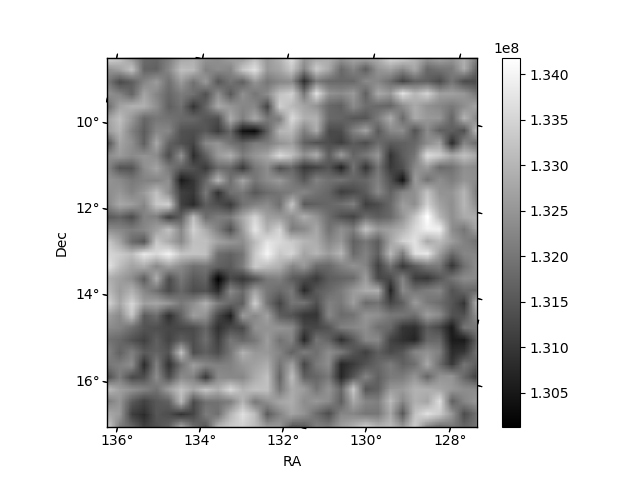
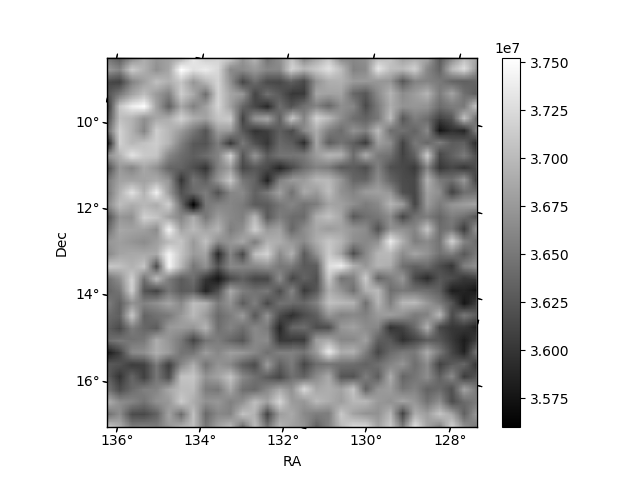
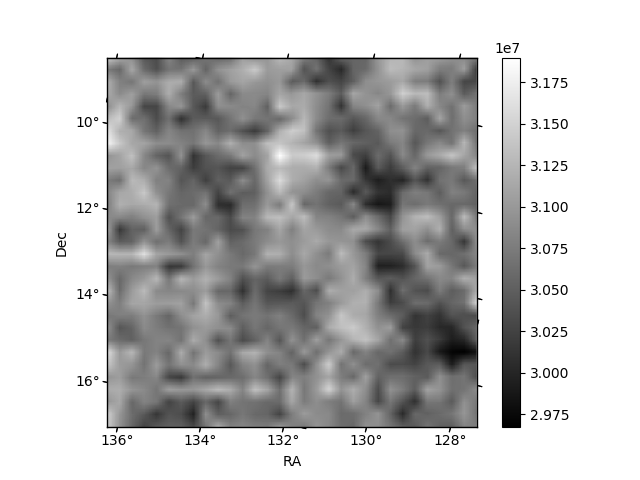
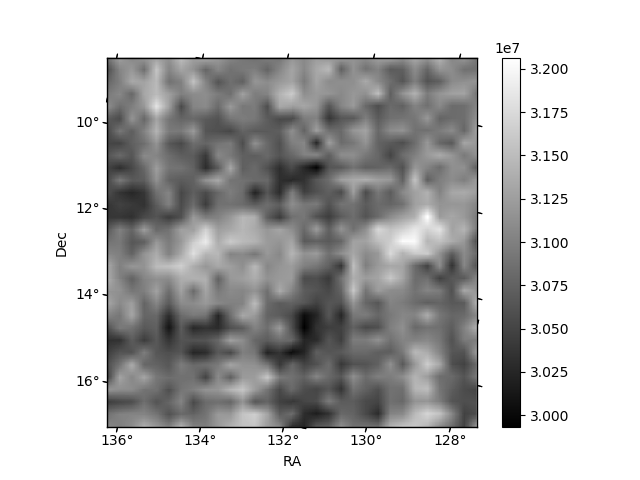
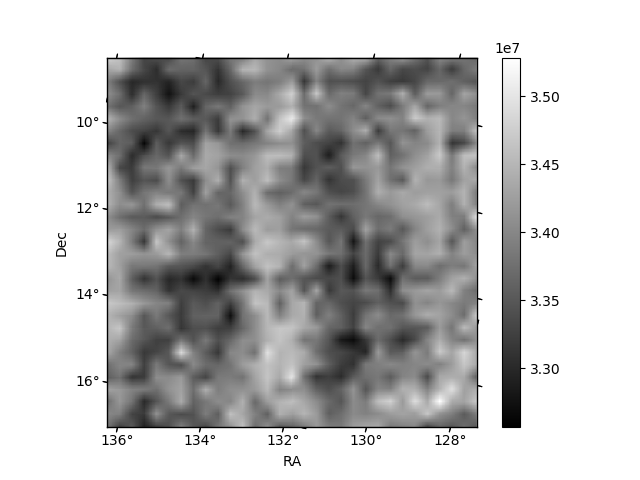
Histogram calculated using DETX and DETY for each event in the final _common_clean file
| Quadrant A | 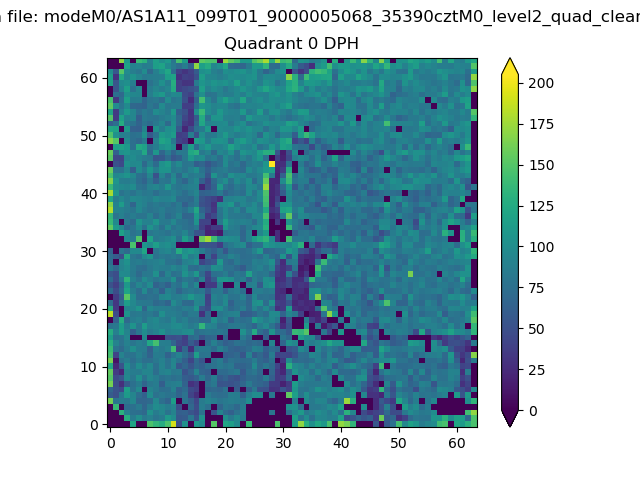 |
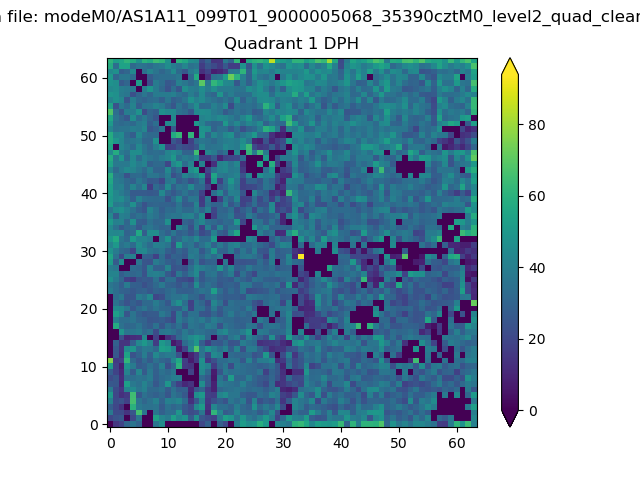 |
Quadrant B |
|---|---|---|---|
| Quadrant D | 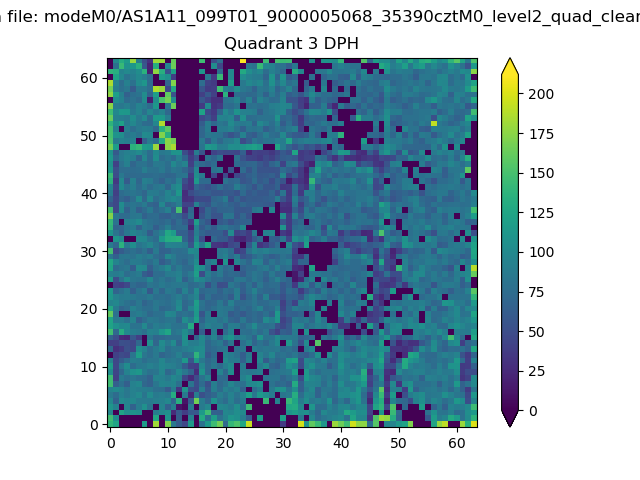 |
 |
Quadrant C |
| Plot type | Count rate plots | Images |
|---|---|---|
| Comparison with Poisson distribution Blue bars denote a histogram of data divided into 1 sec bins. Red curve is a Poisson curve with rate = median count rate of data. |
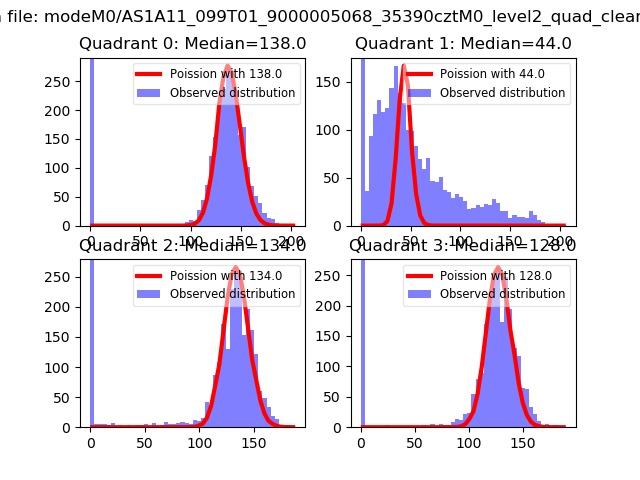 |
 |
| Quadrant-wise count rates Data is divided into 100 sec bins |
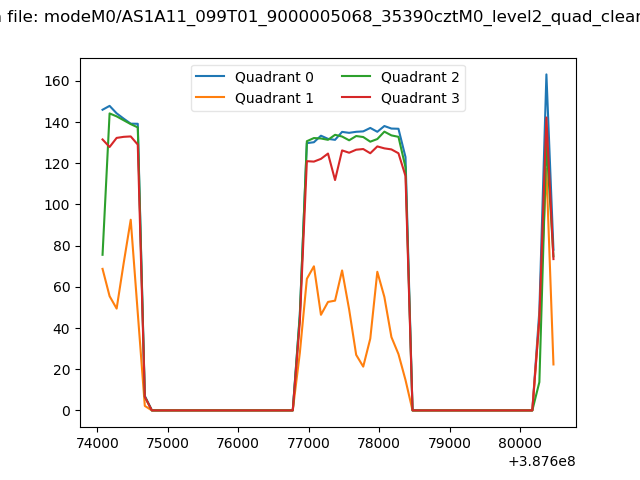 |
|
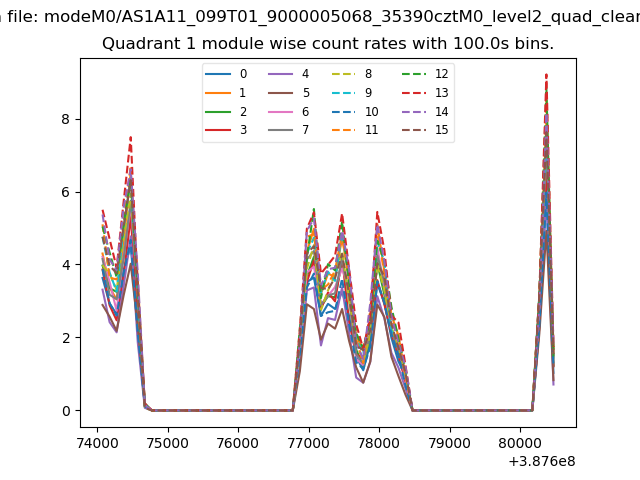
| Module-wise count rates for Quadrant A Data is divided into 100 sec bins |
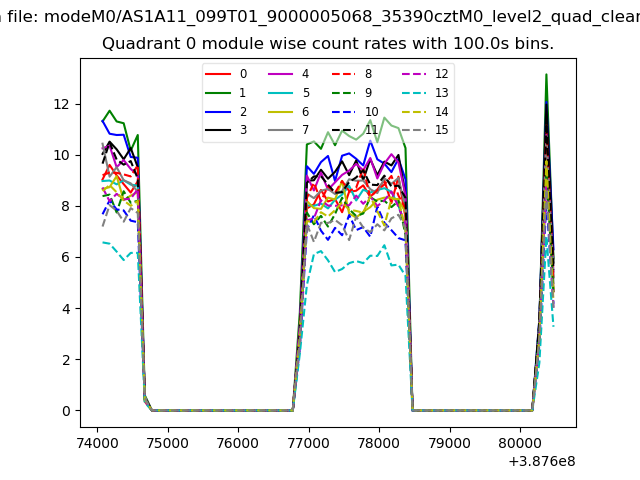 |
 |
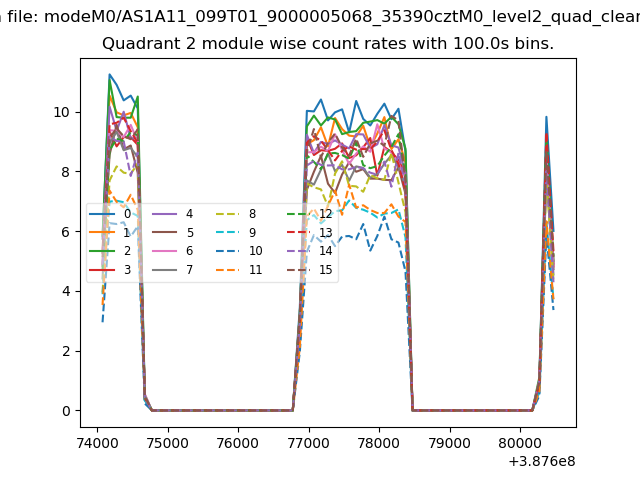
| Module-wise count rates for Quadrant B Data is divided into 100 sec bins |
 |
 |
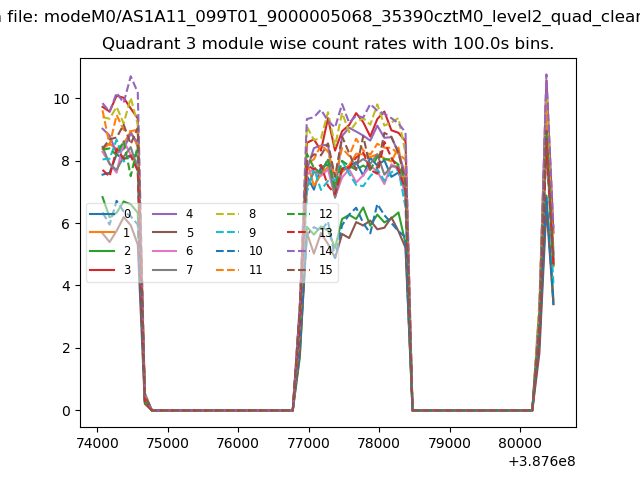
| Module-wise count rates for Quadrant C Data is divided into 100 sec bins |
 |
 |
| Module-wise count rates for Quadrant D Data is divided into 100 sec bins |
 |
 |
| Parameter | Plot |
|---|---|
| CZT HV Monitor | 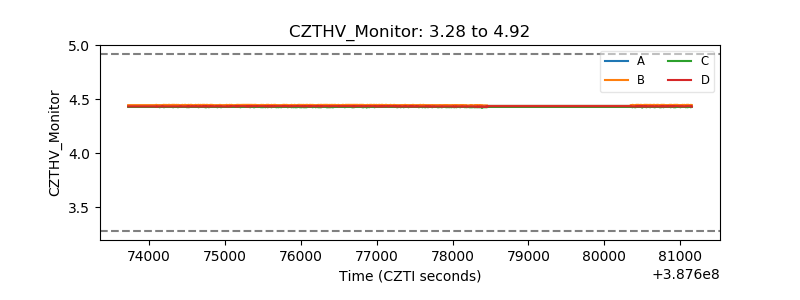 |
| D_VDD | 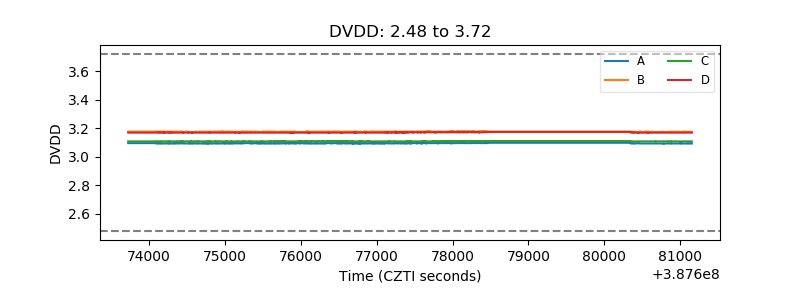 |
| Temperature 1 | 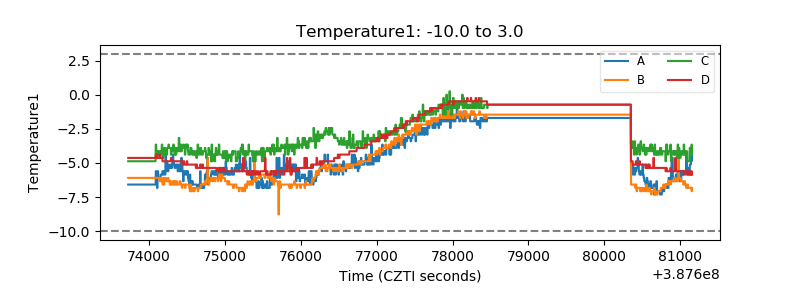 |
| Veto HV Monitor | 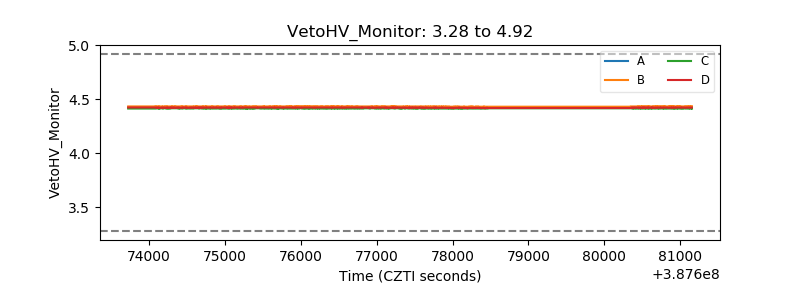 |
| Veto LLD | 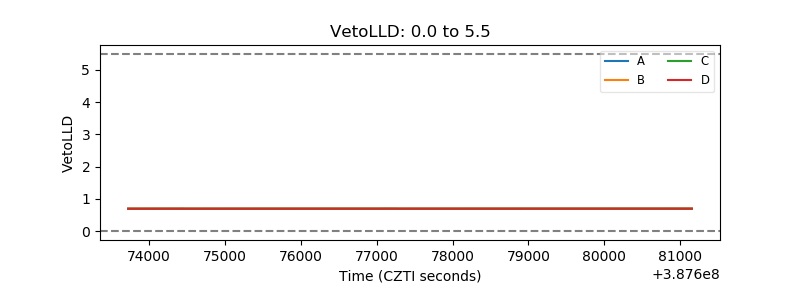 |
| Alpha Counter | 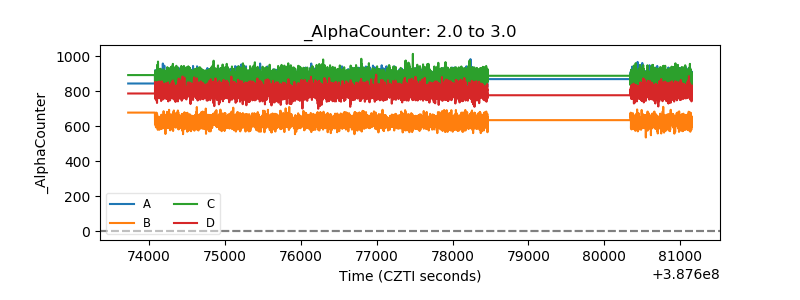 |
| _CPM_Rate | 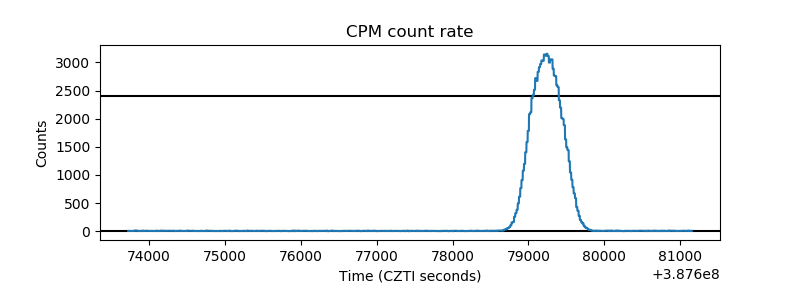 |
| CZT Counter | 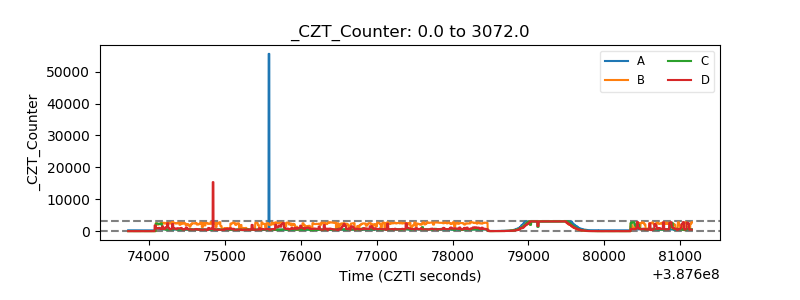 |
| +2.5 Volts monitor | 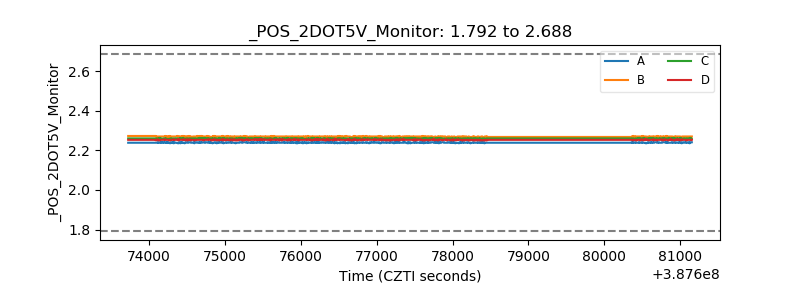 |
| +5 Volts monitor | 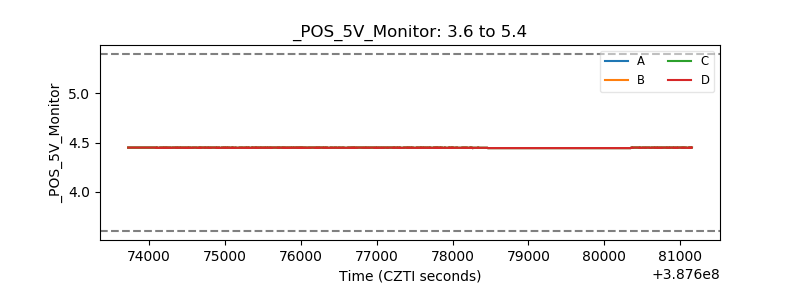 |
| _ROLL_ROT | 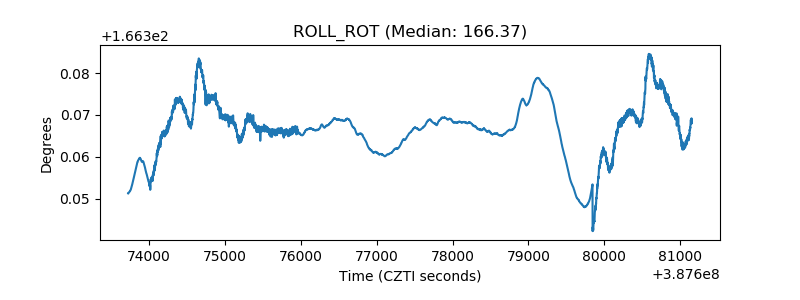 |
| _Roll_DEC | 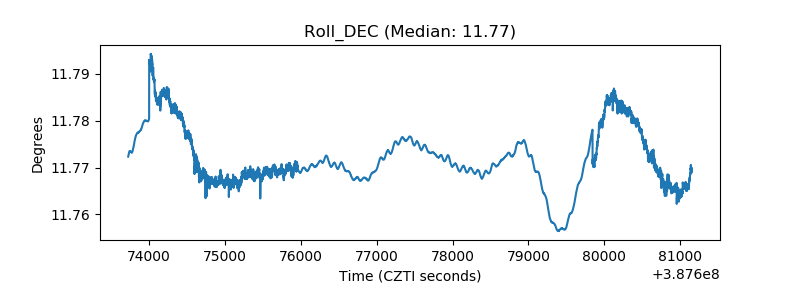 |
| _Roll_RA | 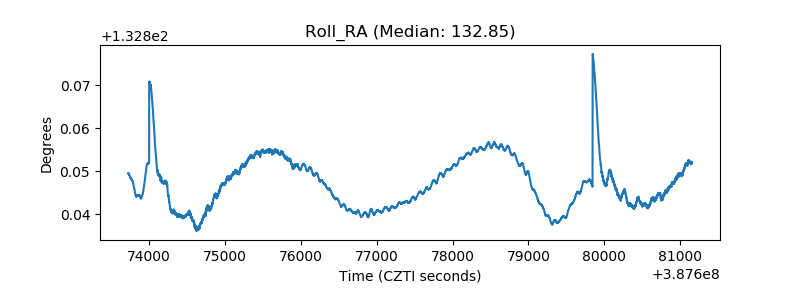 |
| Veto Counter | 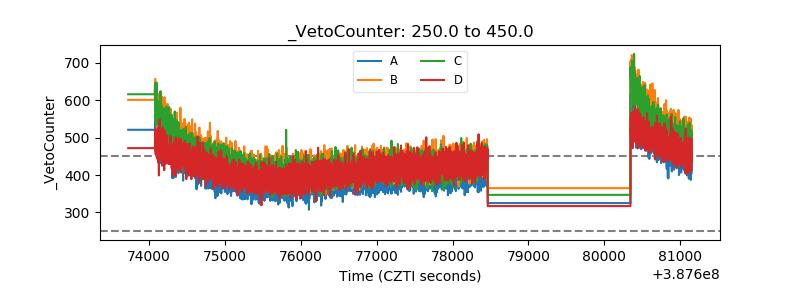 |