| Param | Original file | Final file |
|---|---|---|
| Filename | modeM0/AS1A11_099T01_9000005068_35389cztM0_level2.evt | modeM0/AS1A11_099T01_9000005068_35389cztM0_level2_quad_clean.evt |
| Size (bytes) | 629,856,000 | 58,472,640 |
| Size | 600.7 MB | 55.8 MB |
| Events in quadrant A | 2,631,895 | 389,074 |
| Events in quadrant B | 8,765,577 | 284,721 |
| Events in quadrant C | 3,261,309 | 367,827 |
| Events in quadrant D | 4,053,517 | 352,549 |
| Mode M9 | |||
|---|---|---|---|
| Quadrant | BADHDUFLAG | Total packets | Discarded packets |
| A | 0 | 26 | 0 |
| B | 0 | 26 | 0 |
| C | 0 | 26 | 0 |
| D | 0 | 27 | 0 |
| Mode M0 | |||
|---|---|---|---|
| Quadrant | BADHDUFLAG | Total packets | Discarded packets |
| A | 0 | 11229 | 3 |
| B | 0 | 29715 | 2 |
| C | 0 | 12808 | 2 |
| D | 0 | 15603 | 2 |
| Mode SS | |||
|---|---|---|---|
| Quadrant | BADHDUFLAG | Total packets | Discarded packets |
| A | 0 | 110 | 0 |
| B | 0 | 110 | 0 |
| C | 0 | 110 | 0 |
| D | 0 | 110 | 0 |
| Quadrant | Total seconds | Saturated seconds | Saturation percentage |
|---|---|---|---|
| A | 5357 | 11 | 0.205339% |
| B | 5357 | 2614 | 48.795968% |
| C | 5357 | 184 | 3.434758% |
| D | 5357 | 251 | 4.685458% |
Noise dominated data is calculated using 1-second bins in cleaned event files. If a bin has >2000 counts, and if more than 50% of those come from <1% of pixels, then it is considered to be noise-dominated and hence unusable.
| Quadrant | # 1 sec bins | Bins with >0 counts | Bins with >2000 counts | High rate bins dominated by noise | Noise dominated (total time) | Noise dominated (detector-on time) | Marked lightcurve |
|---|---|---|---|---|---|---|---|
| A | 7120 | 5358 | 2 | 2 | 0.03% | 0.04% | 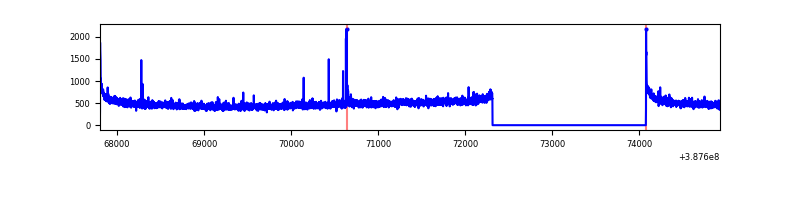 |
| B | 7120 | 5358 | 2140 | 2140 | 30.06% | 39.94% | 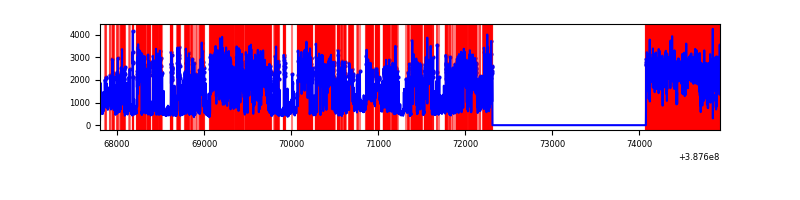 |
| C | 7120 | 5358 | 126 | 126 | 1.77% | 2.35% | 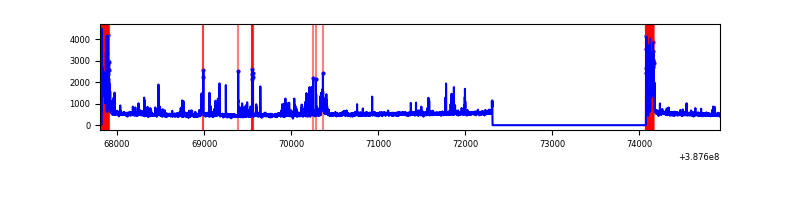 |
| D | 7120 | 5358 | 216 | 216 | 3.03% | 4.03% | 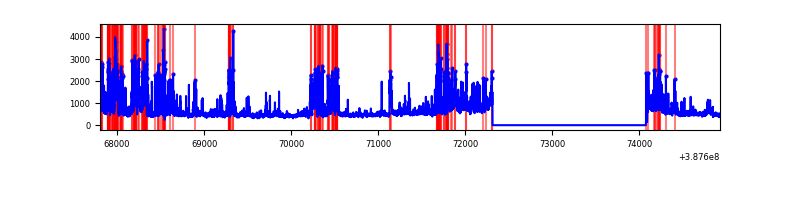 |
Top three noisy pixels from each quadrant. If the there are fewer than three noisy pixels in the level2.evt file, extra rows are filled as -1
| Pixel properties | Quadrant properties | ||||||
|---|---|---|---|---|---|---|---|
| Quadrant | DetID | PixID | Counts | Sigma | Mean | Median | Sigma |
| A | 10 | 83 | 121445 | 933.01 | 639 | 626 | 129.5 |
| A | 9 | 143 | 16034 | 118.99 | 639 | 626 | 129.5 |
| A | 13 | 6 | 13484 | 99.29 | 639 | 626 | 129.5 |
| B | 4 | 251 | 5654799 | 58582.52 | 497 | 485 | 96.5 |
| B | 5 | 236 | 675307 | 6991.61 | 497 | 485 | 96.5 |
| B | 5 | 172 | 373801 | 3867.81 | 497 | 485 | 96.5 |
| C | 0 | 10 | 564200 | 3922.97 | 610 | 614 | 143.7 |
| C | 15 | 214 | 219185 | 1521.42 | 610 | 614 | 143.7 |
| C | 0 | 207 | 46689 | 320.72 | 610 | 614 | 143.7 |
| D | 7 | 80 | 838100 | 5604.02 | 608 | 592 | 149.4 |
| D | 8 | 195 | 157478 | 1049.77 | 608 | 592 | 149.4 |
| D | 13 | 249 | 150504 | 1003.11 | 608 | 592 | 149.4 |
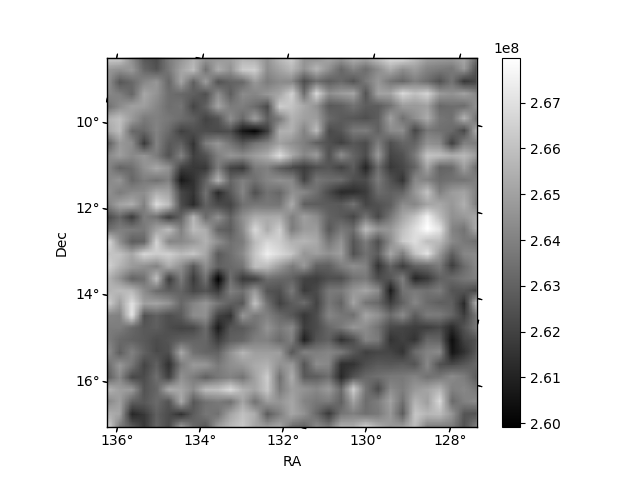
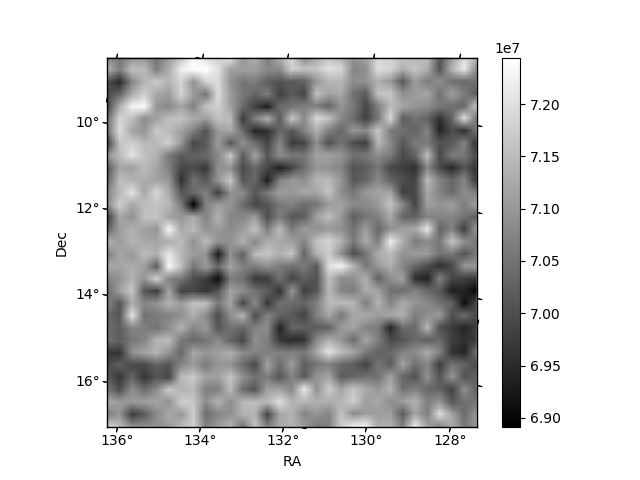
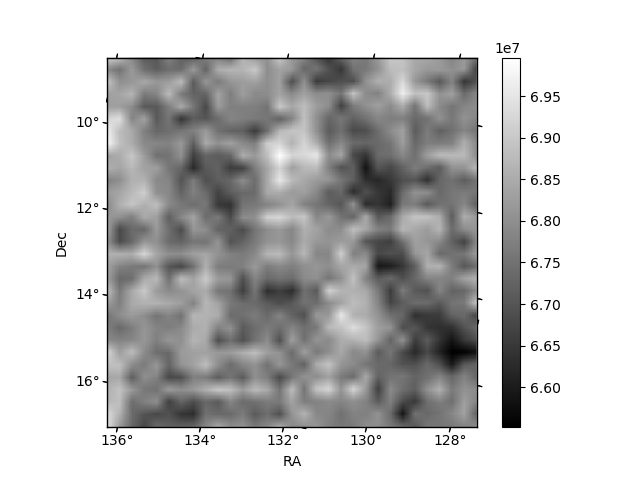
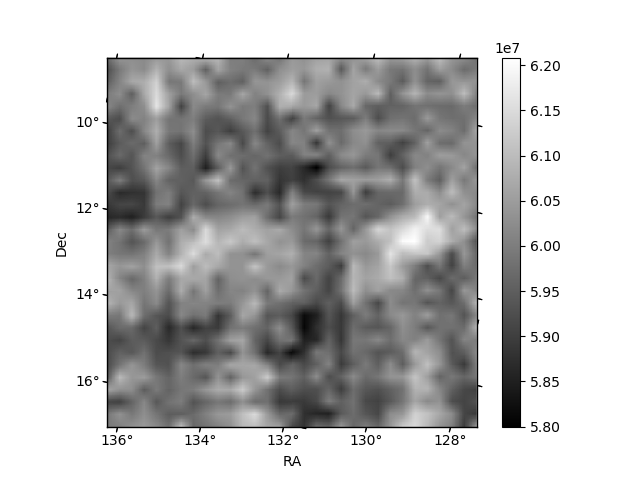
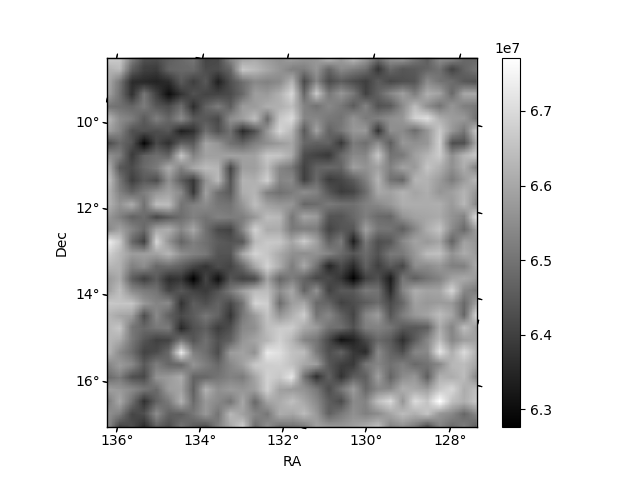
Histogram calculated using DETX and DETY for each event in the final _common_clean file
| Quadrant A | 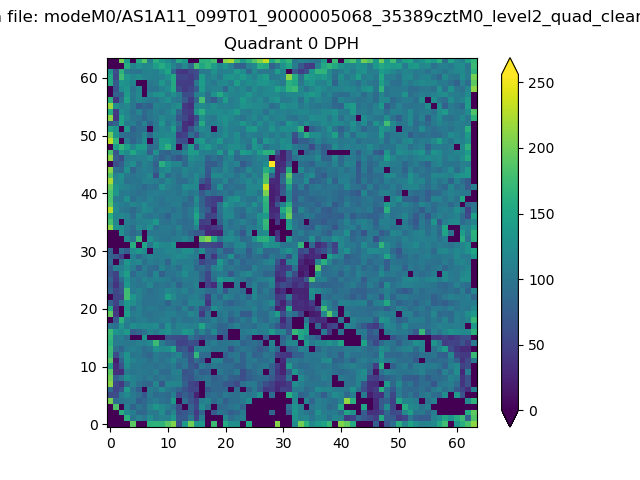 |
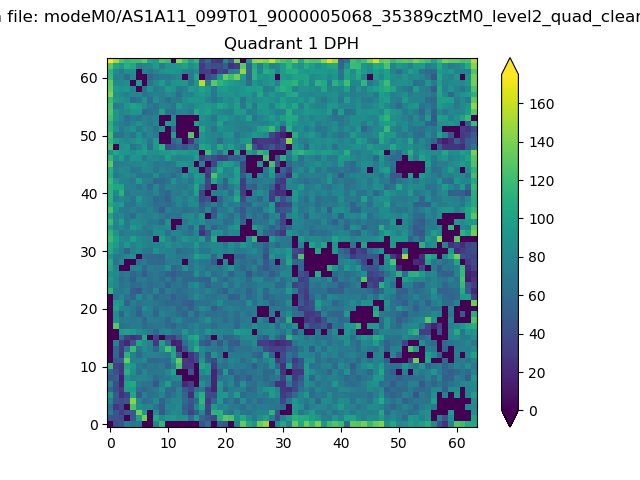 |
Quadrant B |
|---|---|---|---|
| Quadrant D | 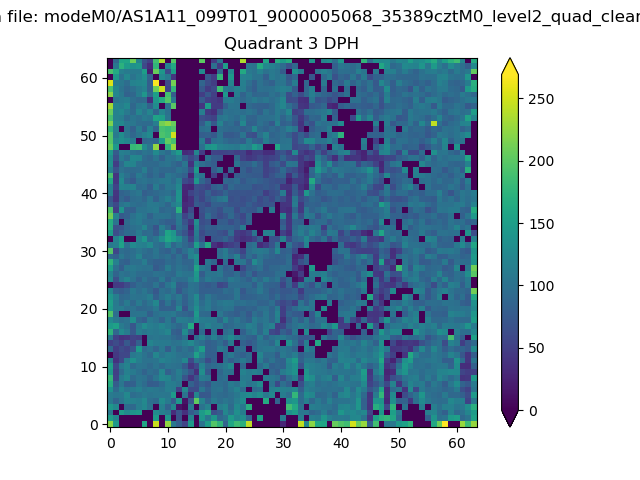 |
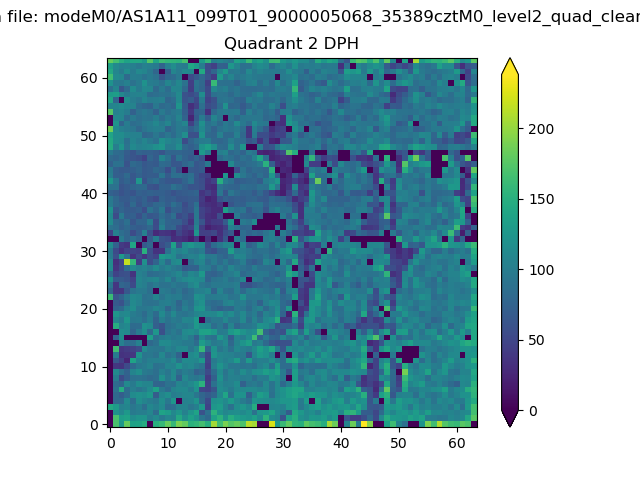 |
Quadrant C |
| Plot type | Count rate plots | Images |
|---|---|---|
| Comparison with Poisson distribution Blue bars denote a histogram of data divided into 1 sec bins. Red curve is a Poisson curve with rate = median count rate of data. |
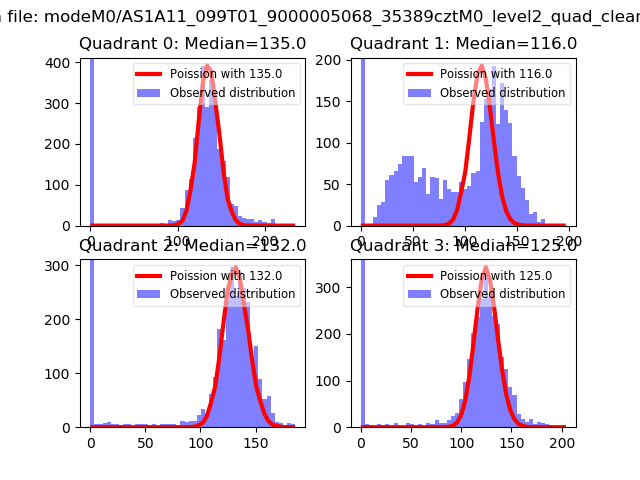 |
 |
| Quadrant-wise count rates Data is divided into 100 sec bins |
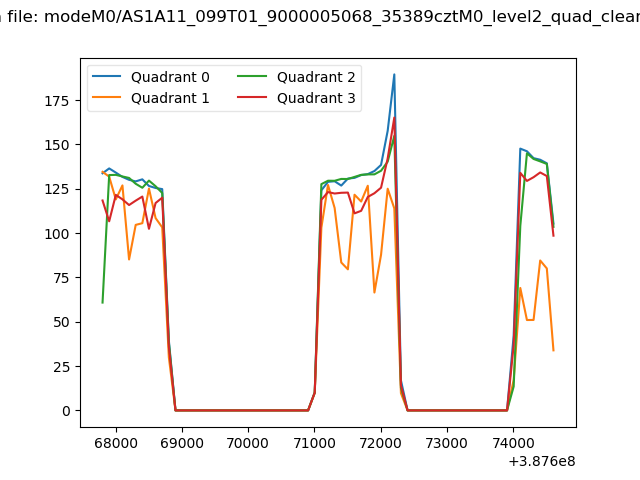 |
|
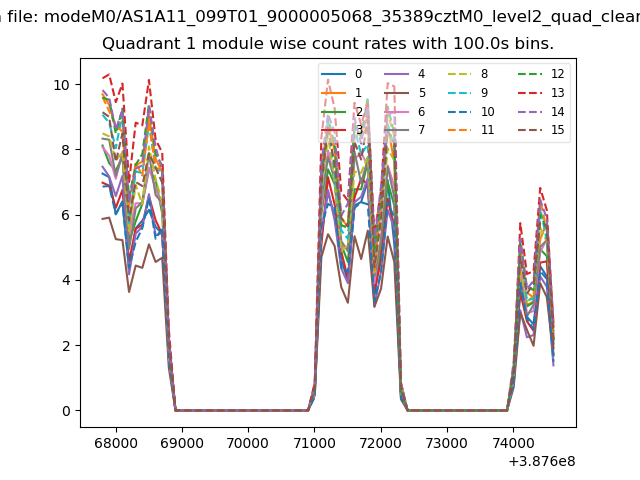
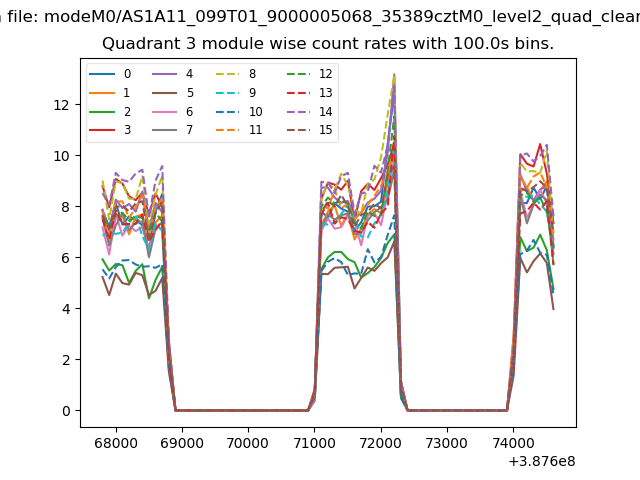
| Module-wise count rates for Quadrant A Data is divided into 100 sec bins |
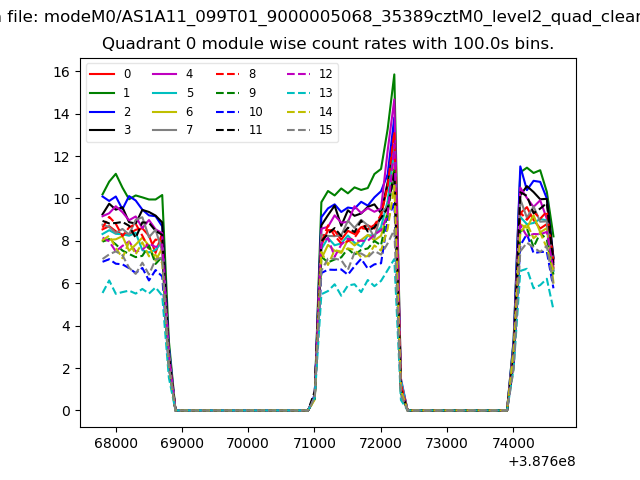 |
 |
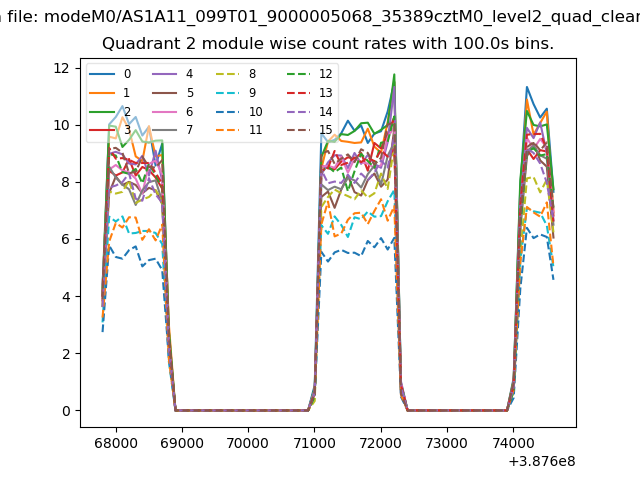
| Module-wise count rates for Quadrant B Data is divided into 100 sec bins |
 |
 |
| Module-wise count rates for Quadrant C Data is divided into 100 sec bins |
 |
 |
| Module-wise count rates for Quadrant D Data is divided into 100 sec bins |
 |
 |
| Parameter | Plot |
|---|---|
| CZT HV Monitor | 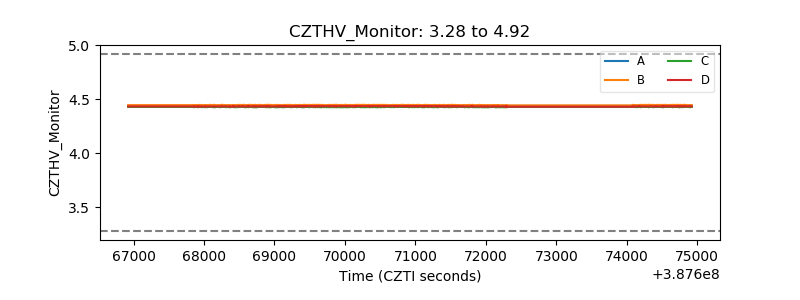 |
| D_VDD | 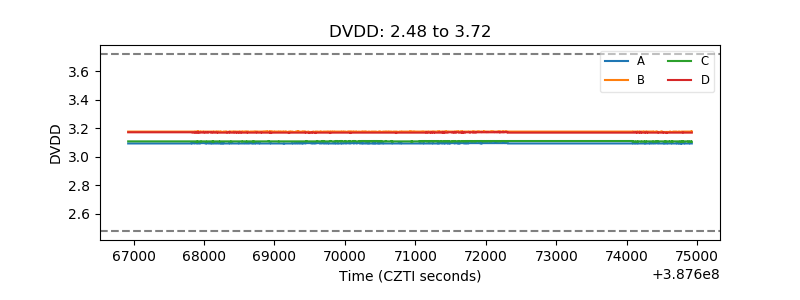 |
| Temperature 1 | 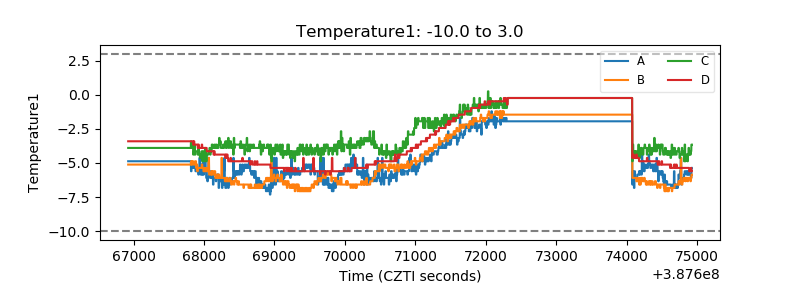 |
| Veto HV Monitor | 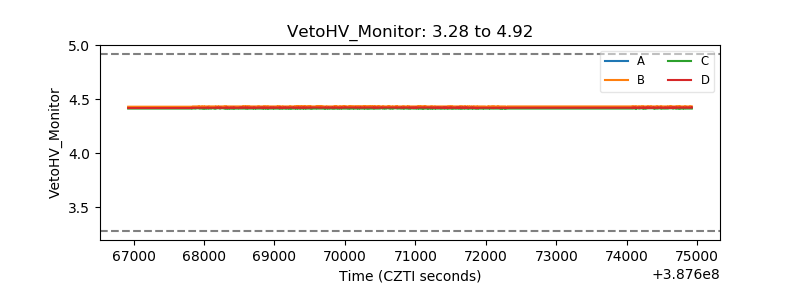 |
| Veto LLD | 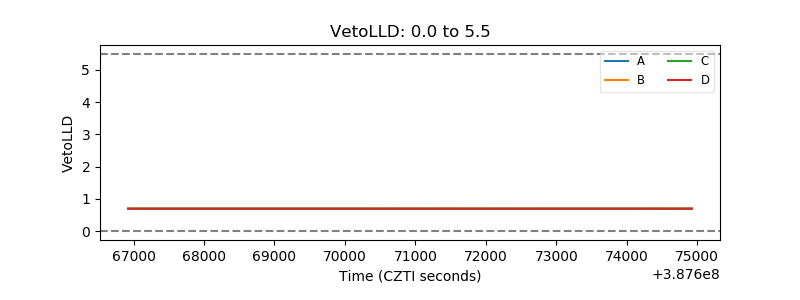 |
| Alpha Counter | 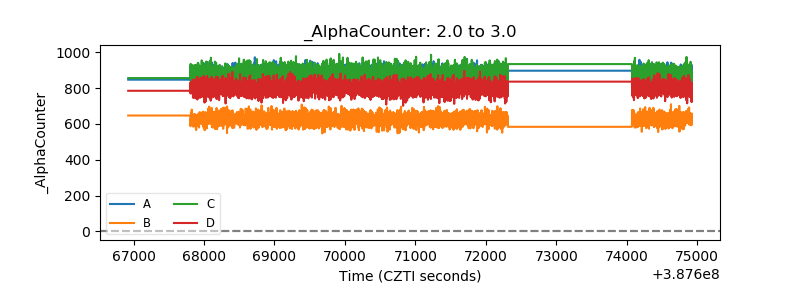 |
| _CPM_Rate | 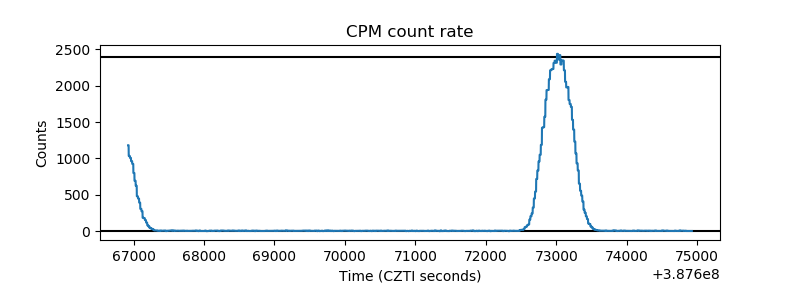 |
| CZT Counter | 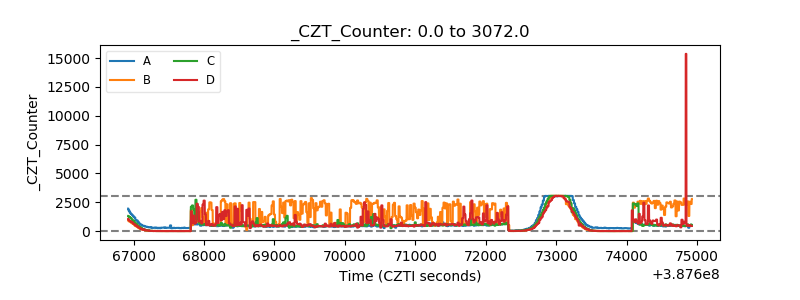 |
| +2.5 Volts monitor | 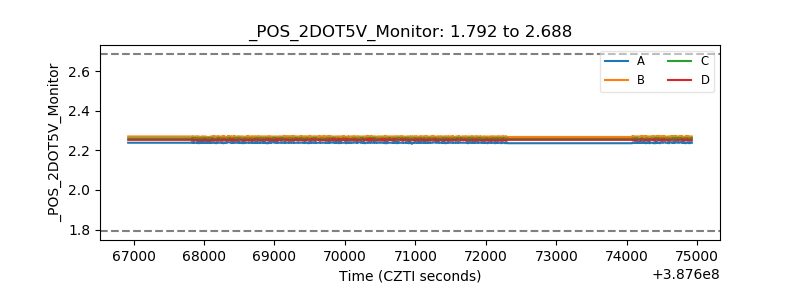 |
| +5 Volts monitor | 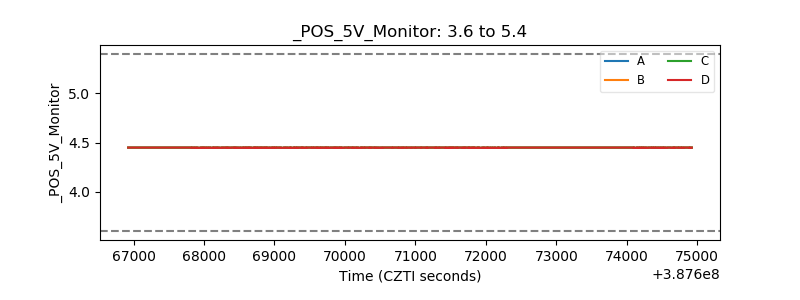 |
| _ROLL_ROT | 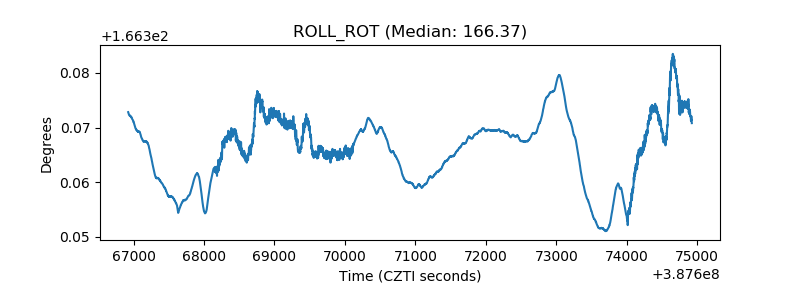 |
| _Roll_DEC | 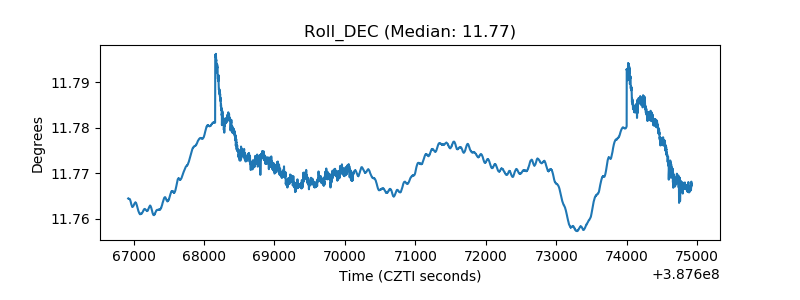 |
| _Roll_RA | 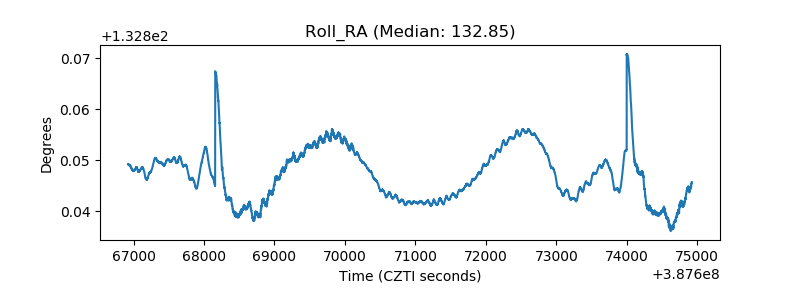 |
| Veto Counter | 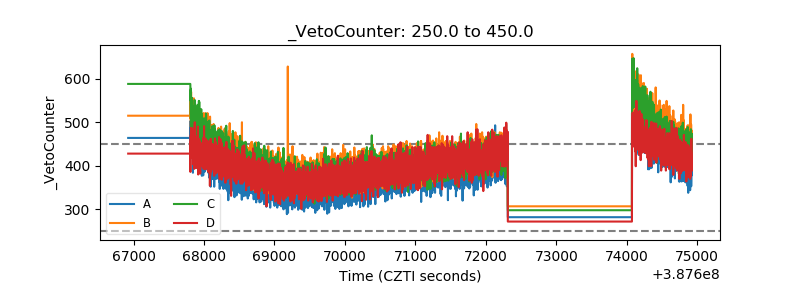 |