| Param | Original file | Final file |
|---|---|---|
| Filename | modeM0/AS1A11_099T01_9000005068_35383cztM0_level2.evt | modeM0/AS1A11_099T01_9000005068_35383cztM0_level2_quad_clean.evt |
| Size (bytes) | 1,889,280 | 604,800 |
| Size | 1.8 MB | 590.6 KB |
| Events in quadrant A | 13,991 | 2,815 |
| Events in quadrant B | 14,681 | 1,137 |
| Events in quadrant C | 16,068 | 3,353 |
| Events in quadrant D | 7,726 | 847 |
| Mode M9 | |||
|---|---|---|---|
| Quadrant | BADHDUFLAG | Total packets | Discarded packets |
| A | 1 | 139707407321896 | 46 |
| B | 1 | -1 | -1 |
| C | 1 | -1 | -1 |
| D | 1 | -1 | -1 |
| Mode M0 | |||
|---|---|---|---|
| Quadrant | BADHDUFLAG | Total packets | Discarded packets |
| A | 0 | 1163 | 1109 |
| B | 0 | 3973 | 3922 |
| C | 0 | 1262 | 1200 |
| D | 0 | 2635 | 2607 |
| Mode SS | |||
|---|---|---|---|
| Quadrant | BADHDUFLAG | Total packets | Discarded packets |
| A | 0 | 11 | 11 |
| B | 0 | 12 | 12 |
| C | 0 | 11 | 11 |
| D | 0 | 12 | 12 |
| Quadrant | Total seconds | Saturated seconds | Saturation percentage |
|---|---|---|---|
| A | 22 | 1 | 4.545455% |
| B | 10 | 5 | 50.000000% |
| C | 27 | 0 | 0.000000% |
| D | 7 | 0 | 0.000000% |
Noise dominated data is calculated using 1-second bins in cleaned event files. If a bin has >2000 counts, and if more than 50% of those come from <1% of pixels, then it is considered to be noise-dominated and hence unusable.
| Quadrant | # 1 sec bins | Bins with >0 counts | Bins with >2000 counts | High rate bins dominated by noise | Noise dominated (total time) | Noise dominated (detector-on time) | Marked lightcurve |
|---|---|---|---|---|---|---|---|
| A | 173 | 37 | 0 | 0 | 0.00% | 0.00% | 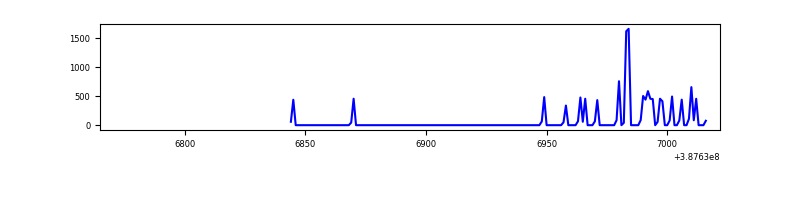 |
| B | 34 | 17 | 1 | 1 | 2.94% | 5.88% | 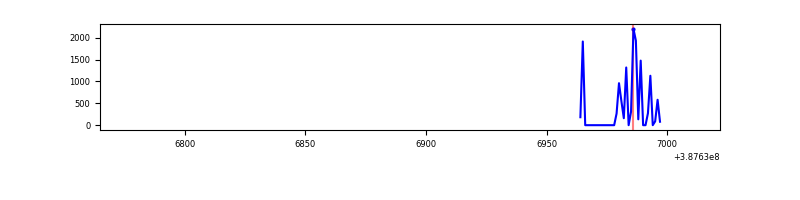 |
| C | 257 | 49 | 0 | 0 | 0.00% | 0.00% | 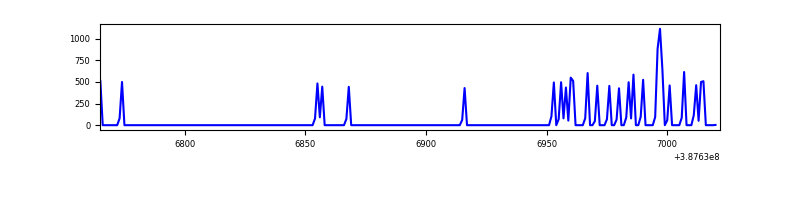 |
| D | 55 | 13 | 0 | 0 | 0.00% | 0.00% | 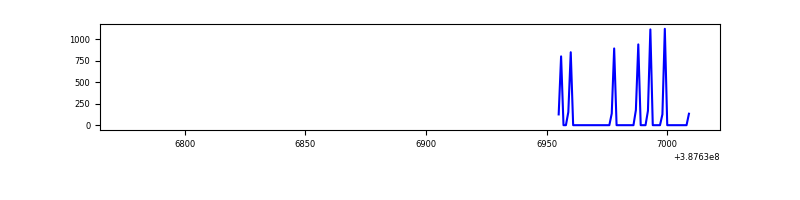 |
Top three noisy pixels from each quadrant. If the there are fewer than three noisy pixels in the level2.evt file, extra rows are filled as -1
| Pixel properties | Quadrant properties | ||||||
|---|---|---|---|---|---|---|---|
| Quadrant | DetID | PixID | Counts | Sigma | Mean | Median | Sigma |
| A | 9 | 143 | 2955 | 1921.38 | 2 | 2 | 1.5 |
| A | 10 | 83 | 346 | 223.82 | 2 | 2 | 1.5 |
| A | 13 | 254 | 39 | 24.07 | 2 | 2 | 1.5 |
| B | 4 | 251 | 6993 | 10213.48 | 1 | 1 | 0.7 |
| B | 5 | 172 | 1394 | 2034.81 | 1 | 1 | 0.7 |
| B | 5 | 200 | 1054 | 1538.16 | 1 | 1 | 0.7 |
| C | 0 | 10 | 2558 | 1481.9 | 3 | 3 | 1.7 |
| C | 15 | 214 | 1060 | 613.06 | 3 | 3 | 1.7 |
| C | 8 | 222 | 67 | 37.12 | 3 | 3 | 1.7 |
| D | 7 | 80 | 3280 | 3689.86 | 0 | 0 | 0.9 |
| D | 8 | 195 | 149 | 167.62 | 0 | 0 | 0.9 |
| D | 2 | 153 | 109 | 122.62 | 0 | 0 | 0.9 |
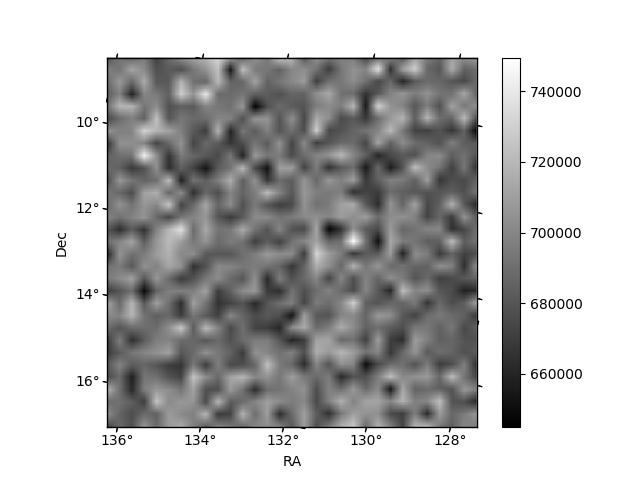
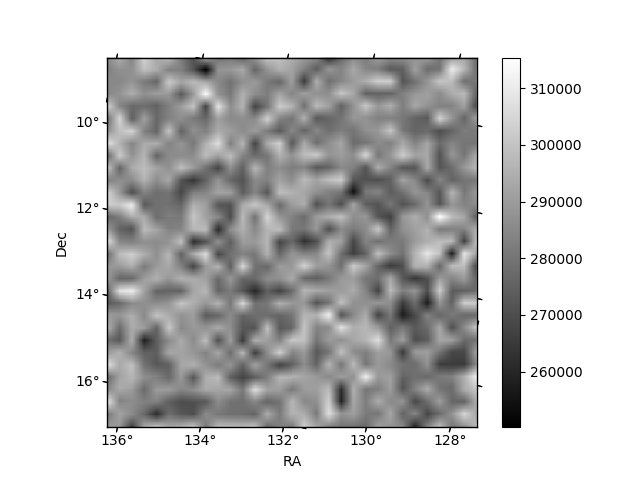
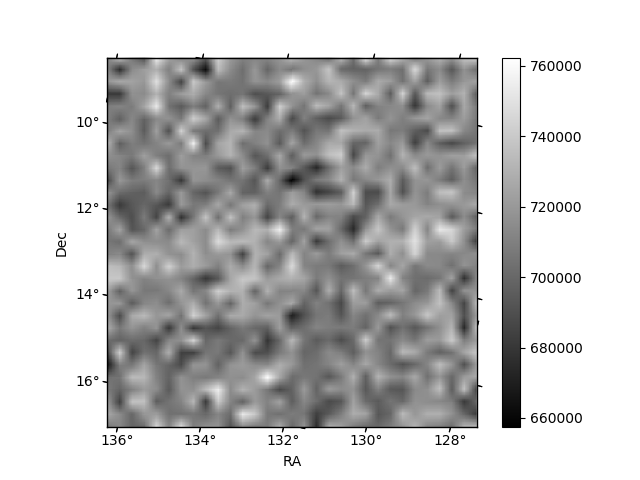
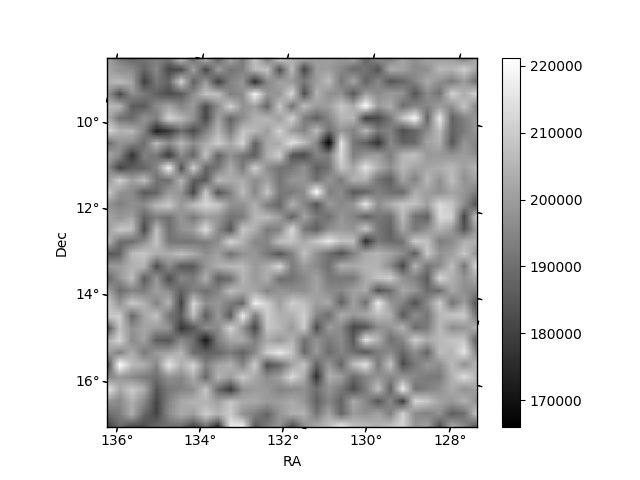
Histogram calculated using DETX and DETY for each event in the final _common_clean file
| Quadrant A | 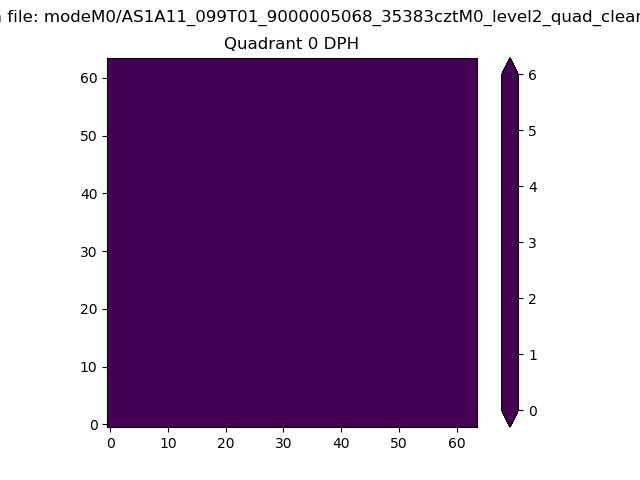 |
 |
Quadrant B |
|---|---|---|---|
| Quadrant D |  |
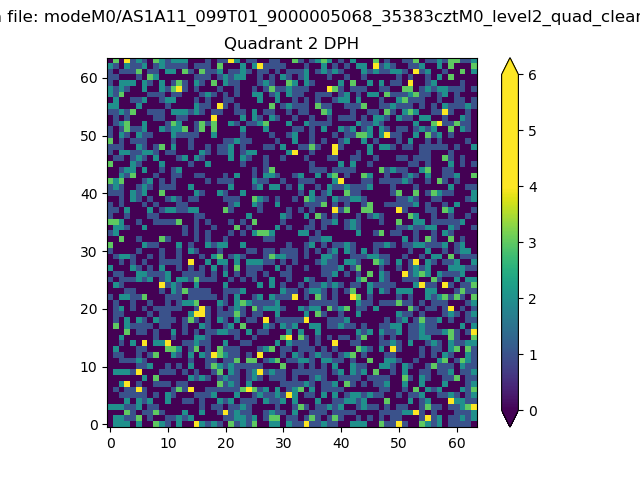 |
Quadrant C |
| Plot type | Count rate plots | Images |
|---|---|---|
| Comparison with Poisson distribution Blue bars denote a histogram of data divided into 1 sec bins. Red curve is a Poisson curve with rate = median count rate of data. |
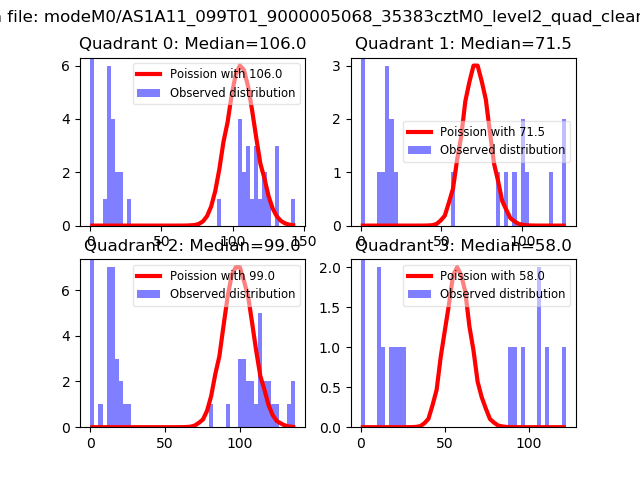 |
 |
| Quadrant-wise count rates Data is divided into 100 sec bins |
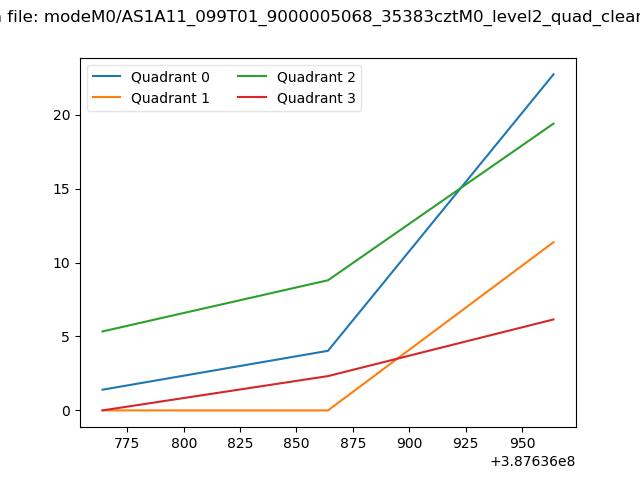 |
|
| Module-wise count rates for Quadrant A Data is divided into 100 sec bins |
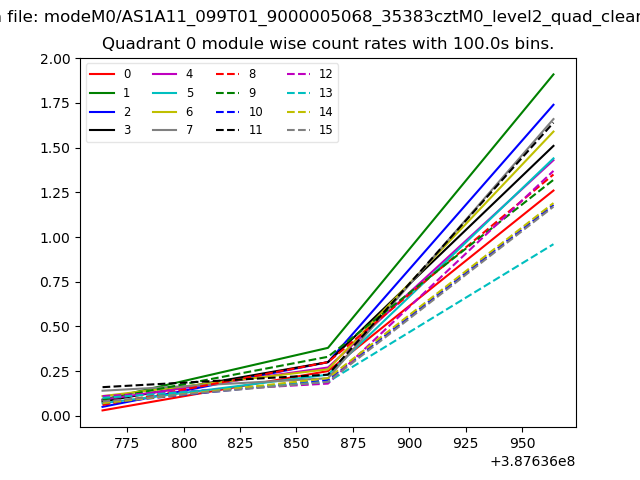 |
 |
| Module-wise count rates for Quadrant B Data is divided into 100 sec bins |
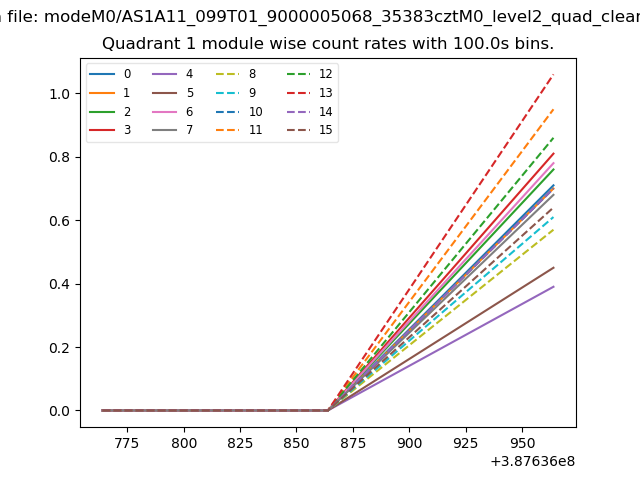 |
 |
| Module-wise count rates for Quadrant C Data is divided into 100 sec bins |
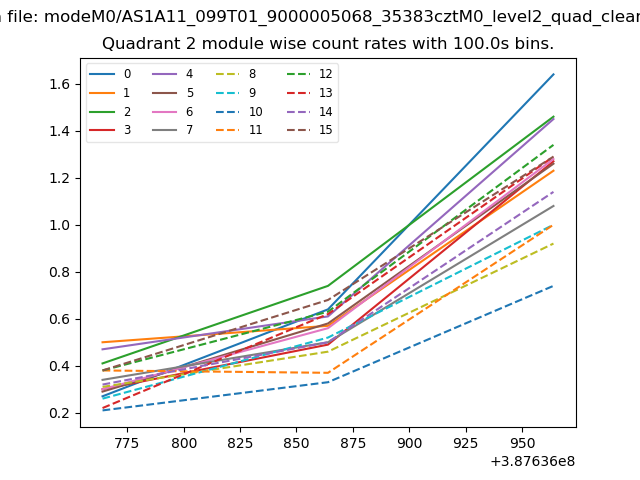 |
 |
| Module-wise count rates for Quadrant D Data is divided into 100 sec bins |
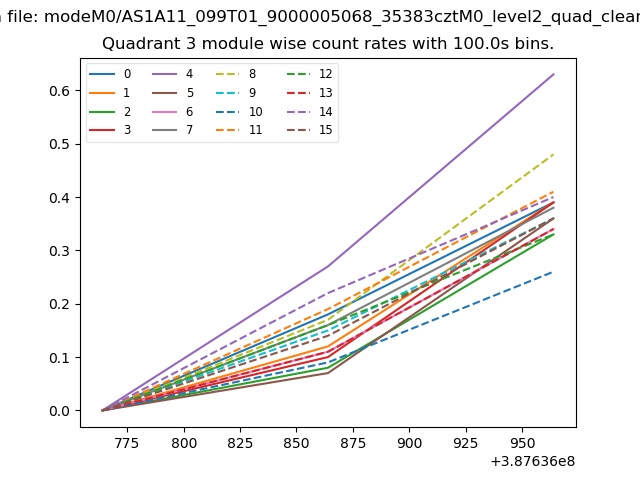 |
 |
| Parameter | Plot |
|---|---|
| CZT HV Monitor | 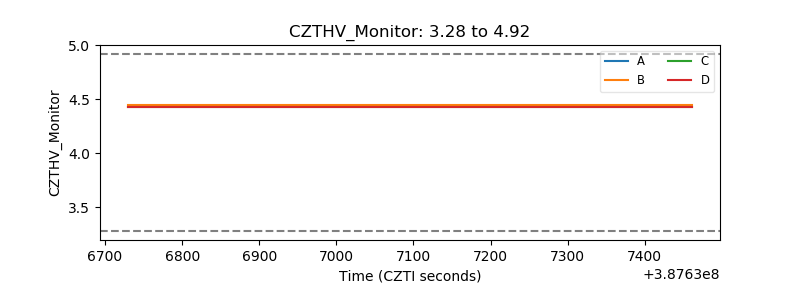 |
| D_VDD | 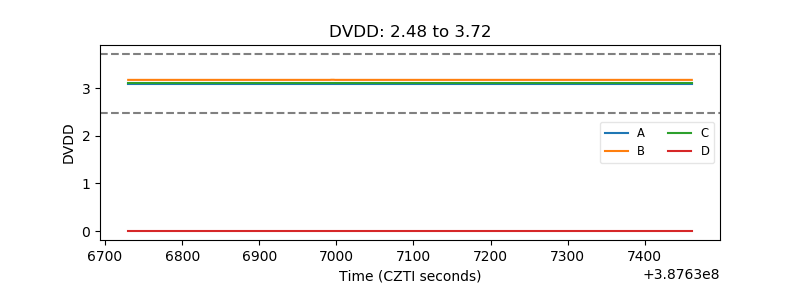 |
| Temperature 1 | 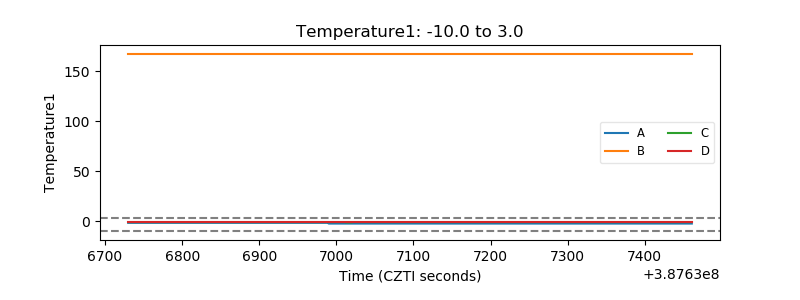 |
| Veto HV Monitor |  |
| Veto LLD | 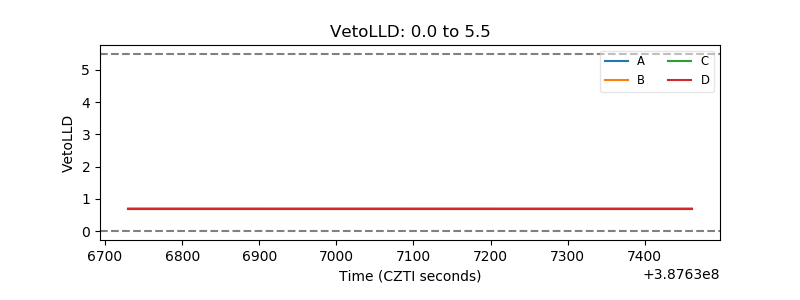 |
| Alpha Counter | 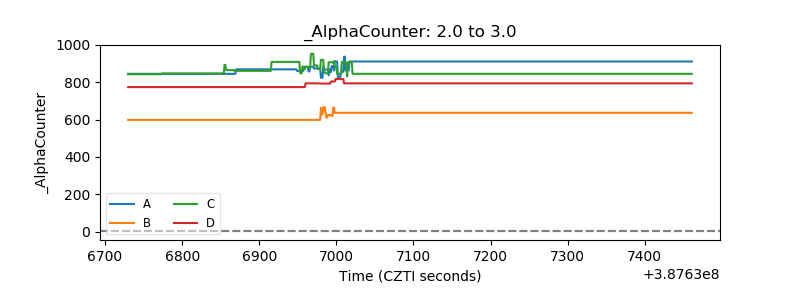 |
| _CPM_Rate | 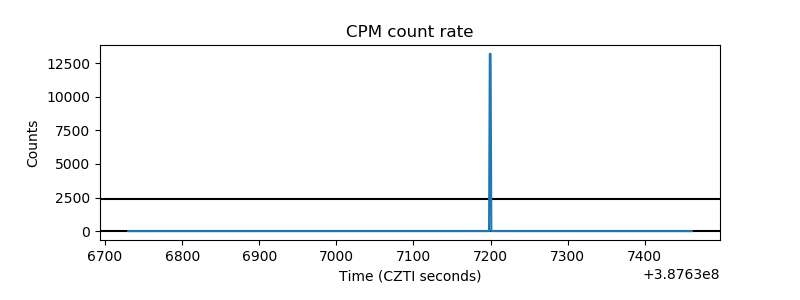 |
| CZT Counter | 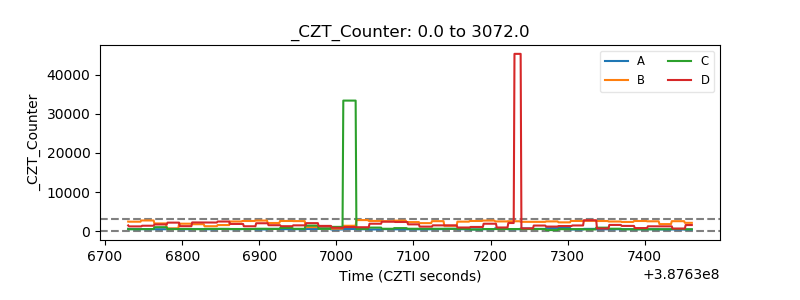 |
| +2.5 Volts monitor | 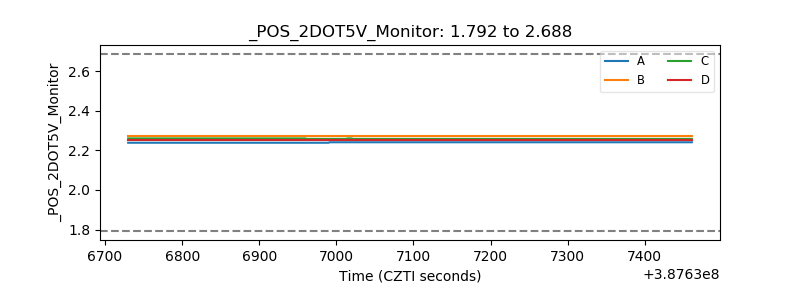 |
| +5 Volts monitor | 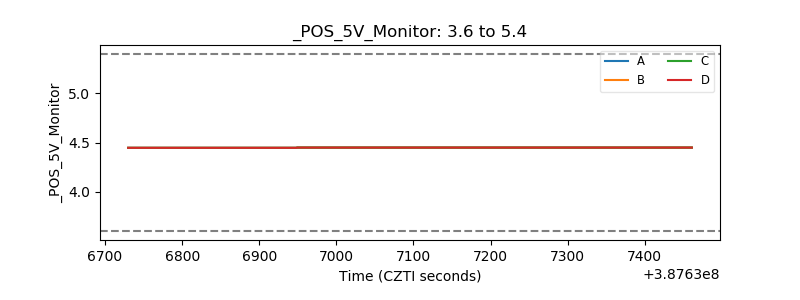 |
| _ROLL_ROT | 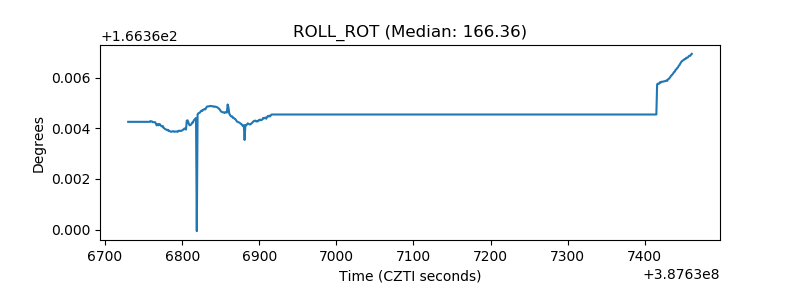 |
| _Roll_DEC | 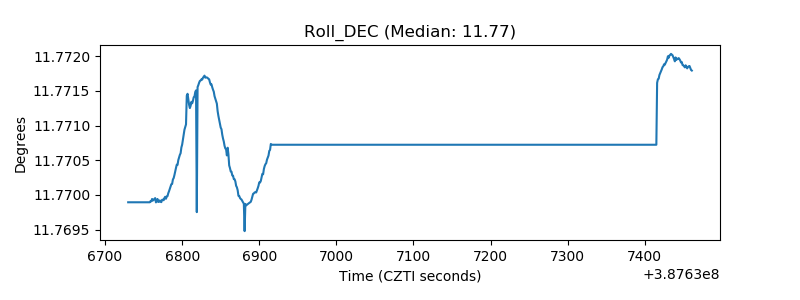 |
| _Roll_RA | 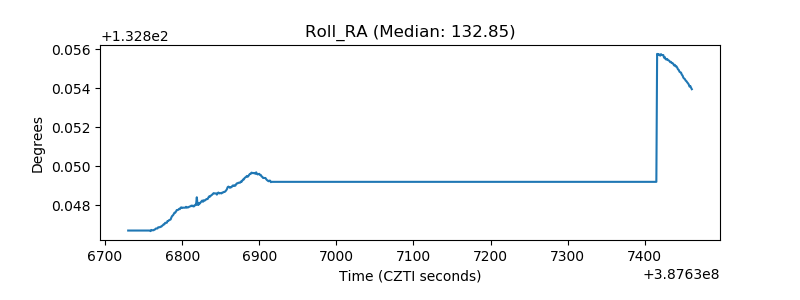 |
| Veto Counter | 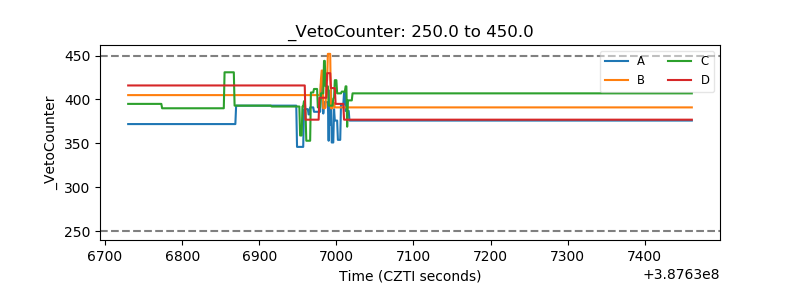 |