| Param | Original file | Final file |
|---|---|---|
| Filename | modeM0/AS1A11_099T01_9000005068_35382cztM0_level2.evt | modeM0/AS1A11_099T01_9000005068_35382cztM0_level2_quad_clean.evt |
| Size (bytes) | 997,378,560 | 74,761,920 |
| Size | 951.2 MB | 71.3 MB |
| Events in quadrant A | 3,054,995 | 580,922 |
| Events in quadrant B | 9,298,194 | 398,370 |
| Events in quadrant C | 3,416,110 | 569,050 |
| Events in quadrant D | 14,037,027 | 297,994 |
| Mode M9 | |||
|---|---|---|---|
| Quadrant | BADHDUFLAG | Total packets | Discarded packets |
| A | 0 | 21 | 0 |
| B | 0 | 21 | 0 |
| C | 0 | 21 | 0 |
| D | 0 | 22 | 0 |
| Mode M0 | |||
|---|---|---|---|
| Quadrant | BADHDUFLAG | Total packets | Discarded packets |
| A | 0 | 12766 | 3 |
| B | 0 | 31724 | 2 |
| C | 0 | 13606 | 2 |
| D | 0 | 45671 | 2 |
| Mode SS | |||
|---|---|---|---|
| Quadrant | BADHDUFLAG | Total packets | Discarded packets |
| A | 0 | 120 | 0 |
| B | 0 | 120 | 0 |
| C | 0 | 120 | 0 |
| D | 0 | 120 | 0 |
| Quadrant | Total seconds | Saturated seconds | Saturation percentage |
|---|---|---|---|
| A | 5932 | 63 | 1.062036% |
| B | 5932 | 2682 | 45.212407% |
| C | 5932 | 122 | 2.056642% |
| D | 5932 | 4733 | 79.787593% |
Noise dominated data is calculated using 1-second bins in cleaned event files. If a bin has >2000 counts, and if more than 50% of those come from <1% of pixels, then it is considered to be noise-dominated and hence unusable.
| Quadrant | # 1 sec bins | Bins with >0 counts | Bins with >2000 counts | High rate bins dominated by noise | Noise dominated (total time) | Noise dominated (detector-on time) | Marked lightcurve |
|---|---|---|---|---|---|---|---|
| A | 7365 | 5933 | 39 | 39 | 0.53% | 0.66% | 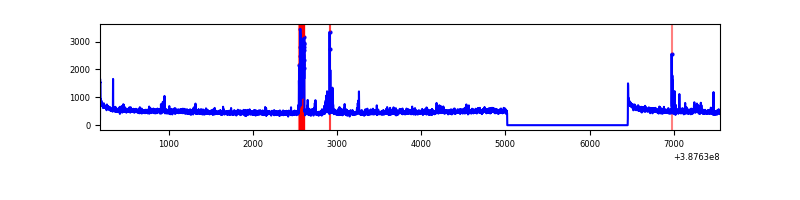 |
| B | 7365 | 5933 | 2131 | 2131 | 28.93% | 35.92% | 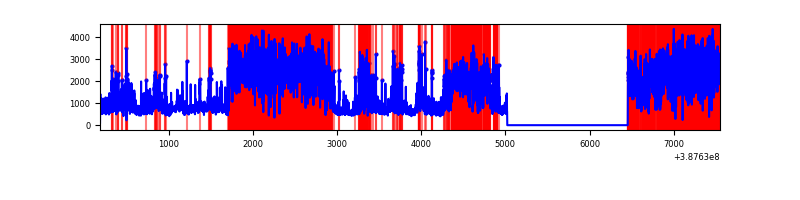 |
| C | 7365 | 5933 | 90 | 90 | 1.22% | 1.52% | 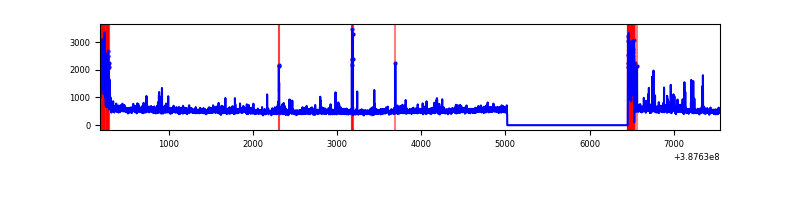 |
| D | 7365 | 5933 | 4605 | 4605 | 62.53% | 77.62% | 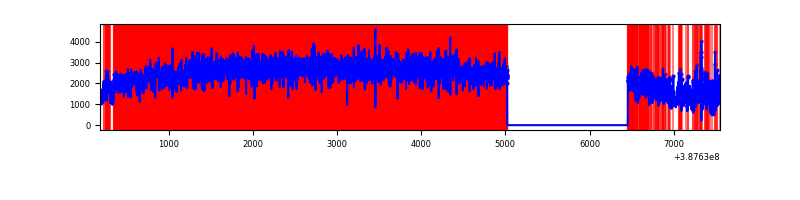 |
Top three noisy pixels from each quadrant. If the there are fewer than three noisy pixels in the level2.evt file, extra rows are filled as -1
| Pixel properties | Quadrant properties | ||||||
|---|---|---|---|---|---|---|---|
| Quadrant | DetID | PixID | Counts | Sigma | Mean | Median | Sigma |
| A | 9 | 143 | 143124 | 1005.77 | 696 | 683 | 141.6 |
| A | 10 | 83 | 129249 | 907.8 | 696 | 683 | 141.6 |
| A | 14 | 254 | 65573 | 458.19 | 696 | 683 | 141.6 |
| B | 4 | 251 | 6471472 | 63649.02 | 521 | 508 | 101.7 |
| B | 5 | 172 | 316681 | 3109.91 | 521 | 508 | 101.7 |
| B | 5 | 200 | 207168 | 2032.73 | 521 | 508 | 101.7 |
| C | 0 | 10 | 494835 | 3127.53 | 671 | 675 | 158.0 |
| C | 15 | 214 | 244560 | 1543.54 | 671 | 675 | 158.0 |
| C | 3 | 233 | 24994 | 153.91 | 671 | 675 | 158.0 |
| D | 7 | 80 | 10996764 | 109995.4 | 403 | 391 | 100.0 |
| D | 1 | 52 | 436688 | 4364.23 | 403 | 391 | 100.0 |
| D | 12 | 235 | 385289 | 3850.09 | 403 | 391 | 100.0 |
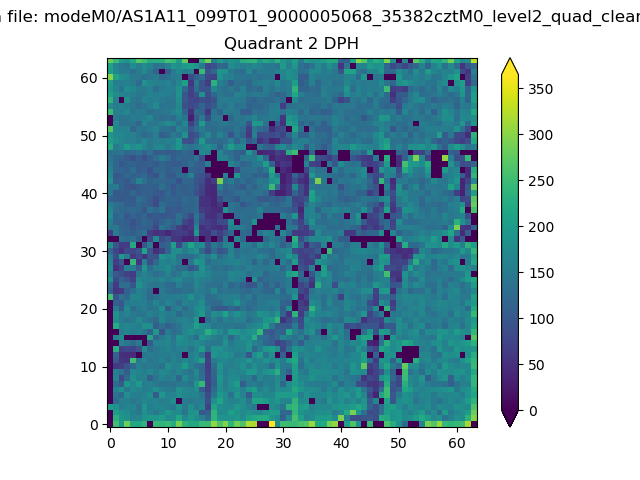
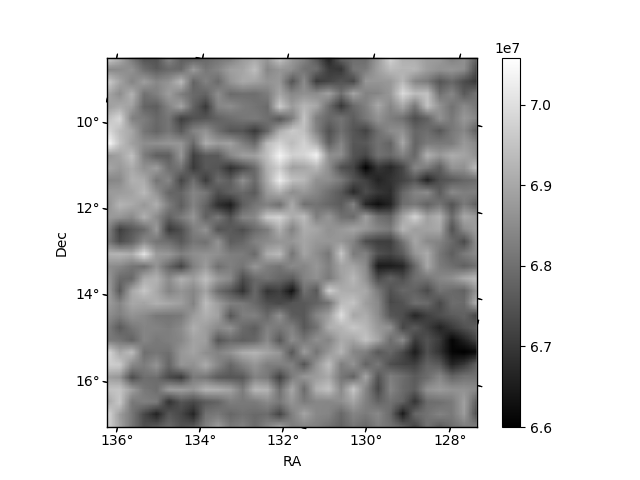
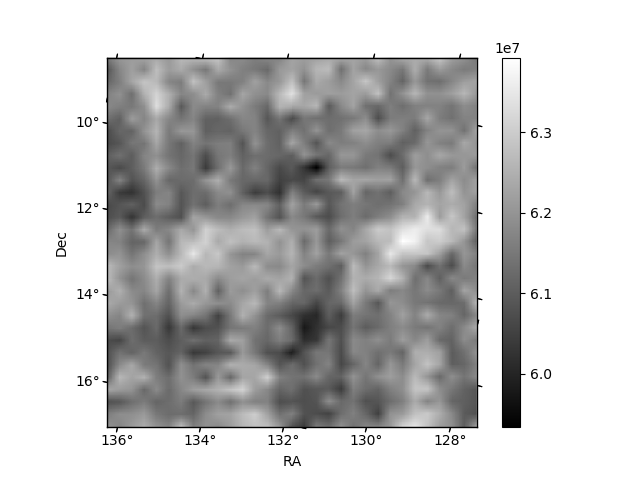
Histogram calculated using DETX and DETY for each event in the final _common_clean file
| Quadrant A | 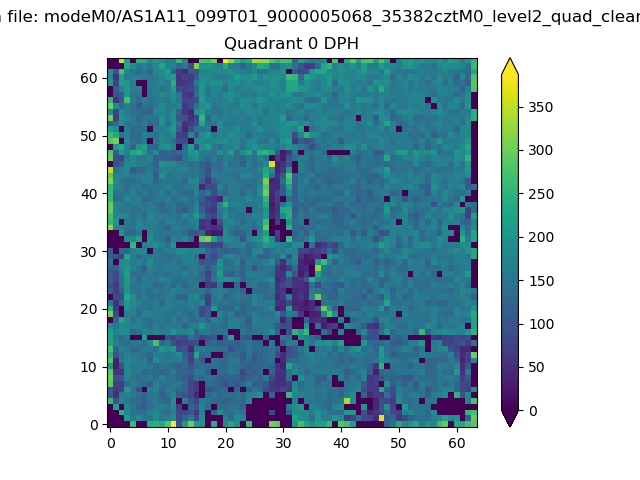 |
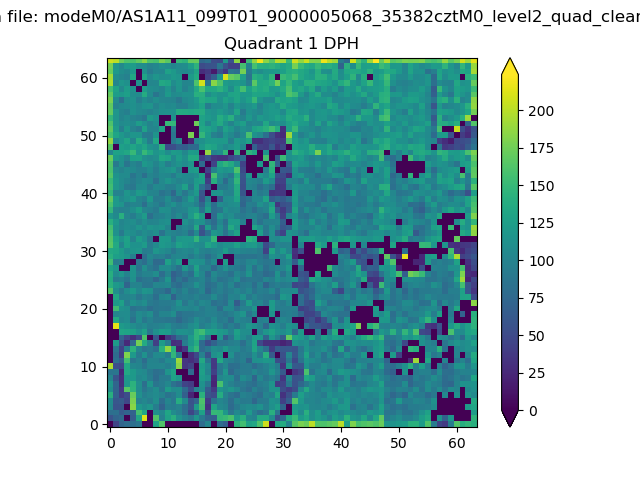 |
Quadrant B |
|---|---|---|---|
| Quadrant D | 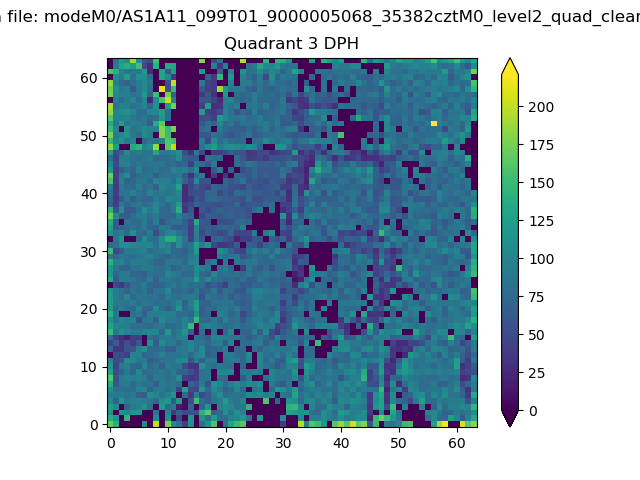 |
 |
Quadrant C |
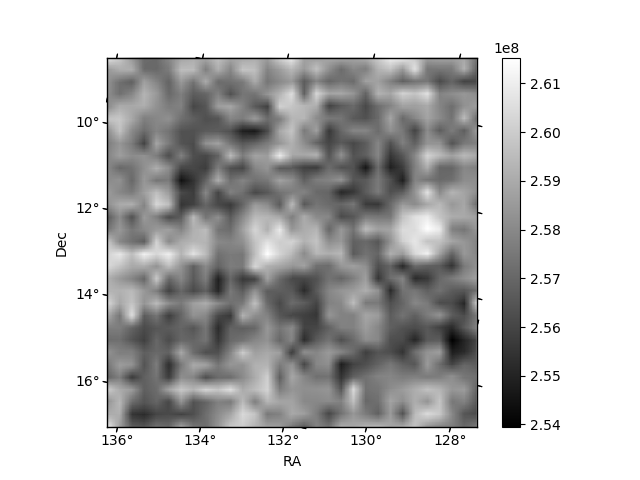
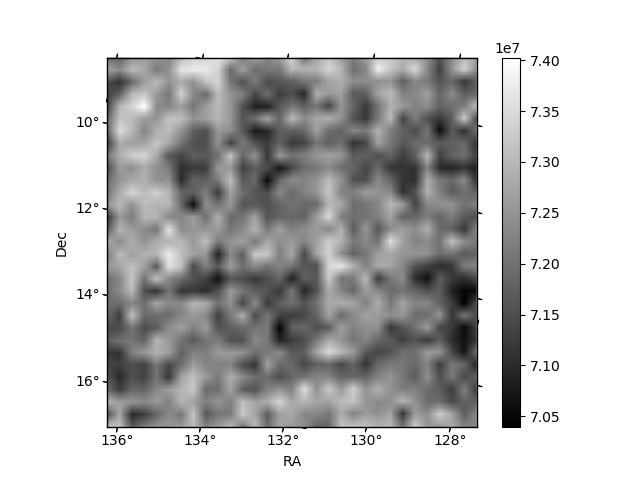
| Plot type | Count rate plots | Images |
|---|---|---|
| Comparison with Poisson distribution Blue bars denote a histogram of data divided into 1 sec bins. Red curve is a Poisson curve with rate = median count rate of data. |
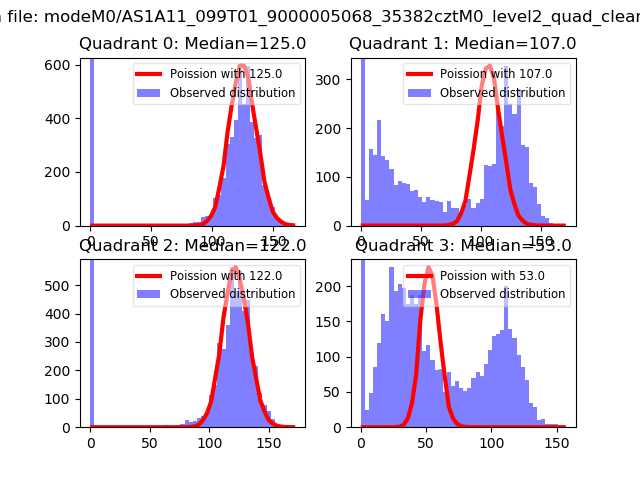 |
 |
| Quadrant-wise count rates Data is divided into 100 sec bins |
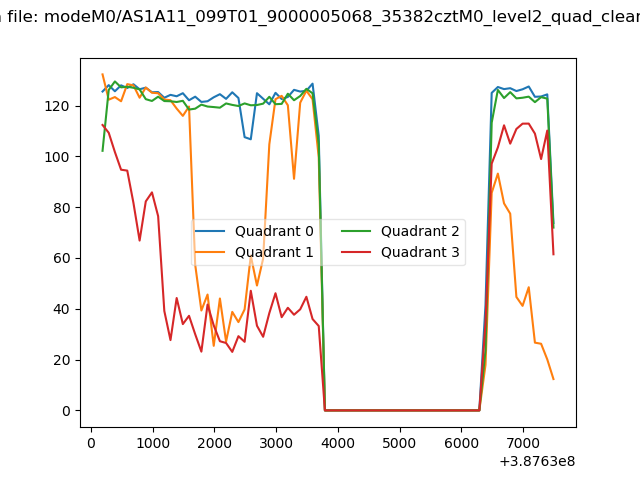 |
|
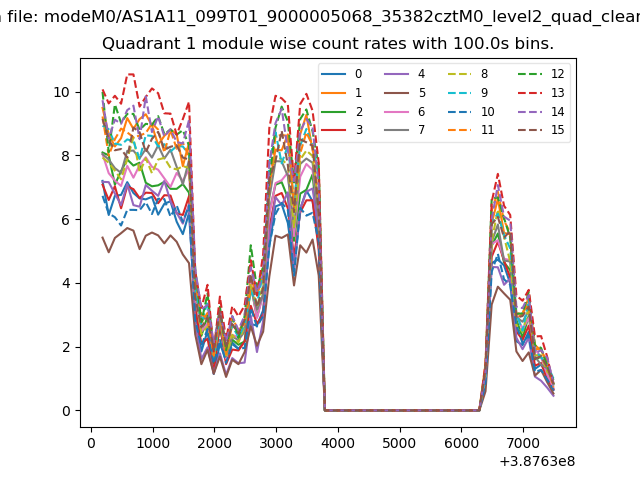
| Module-wise count rates for Quadrant A Data is divided into 100 sec bins |
 |
 |
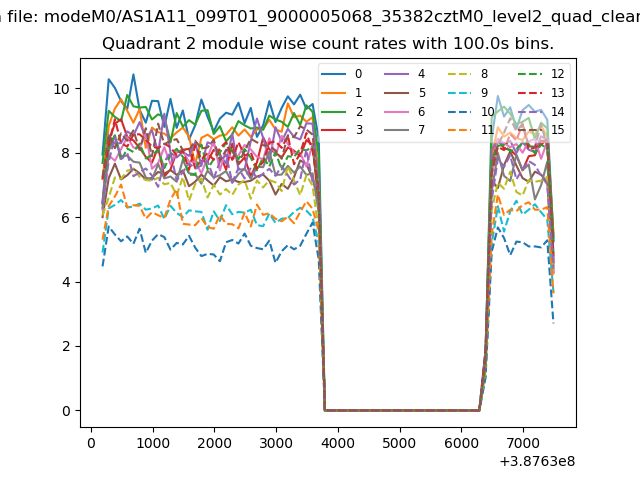
| Module-wise count rates for Quadrant B Data is divided into 100 sec bins |
 |
 |
| Module-wise count rates for Quadrant C Data is divided into 100 sec bins |
 |
 |
| Module-wise count rates for Quadrant D Data is divided into 100 sec bins |
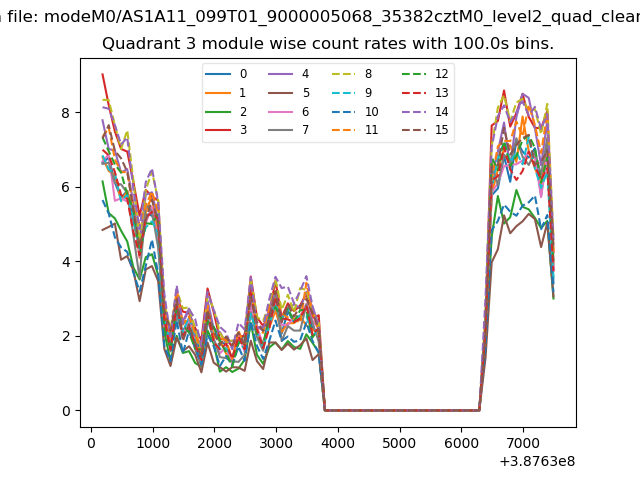 |
 |
| Parameter | Plot |
|---|---|
| CZT HV Monitor | 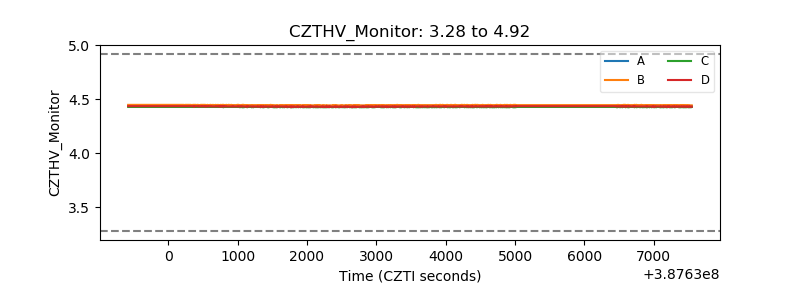 |
| D_VDD | 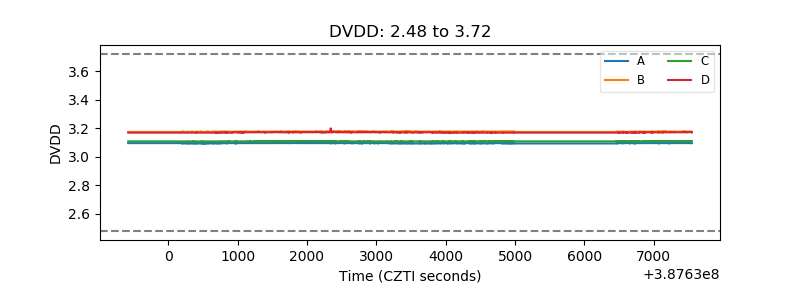 |
| Temperature 1 | 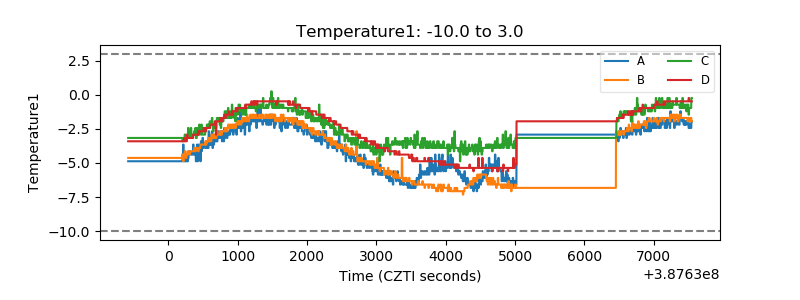 |
| Veto HV Monitor | 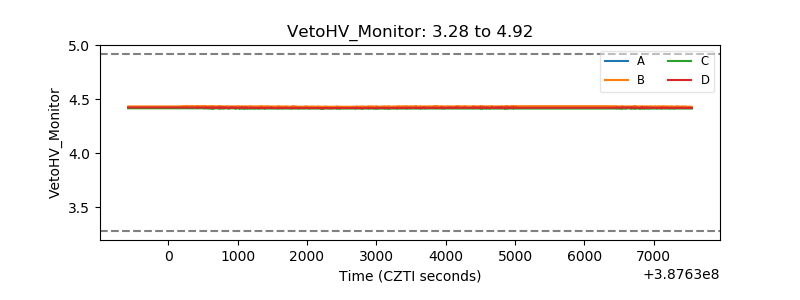 |
| Veto LLD | 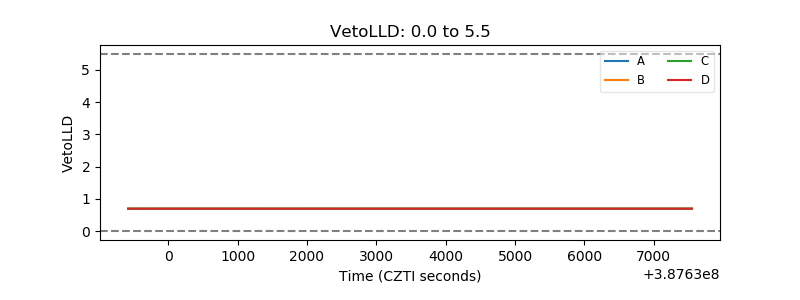 |
| Alpha Counter | 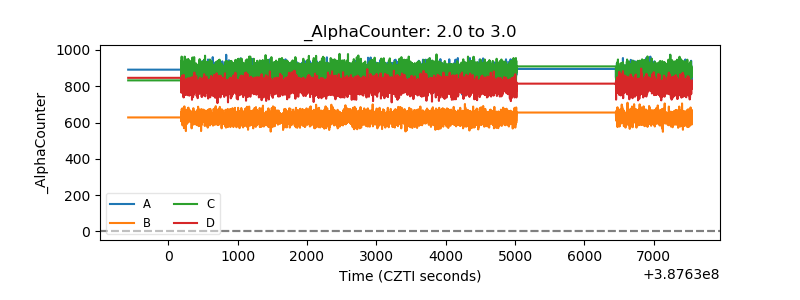 |
| _CPM_Rate | 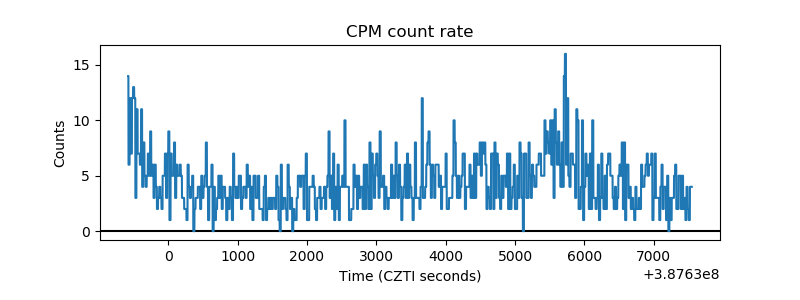 |
| CZT Counter | 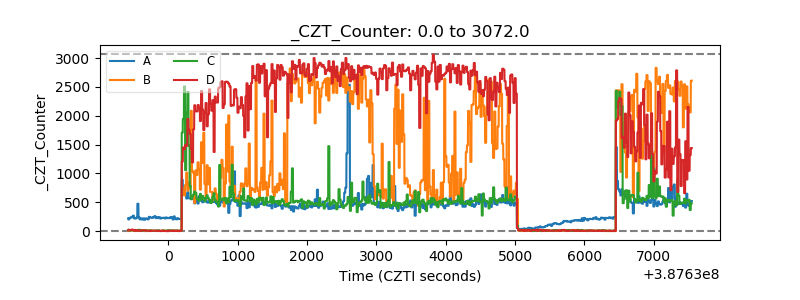 |
| +2.5 Volts monitor | 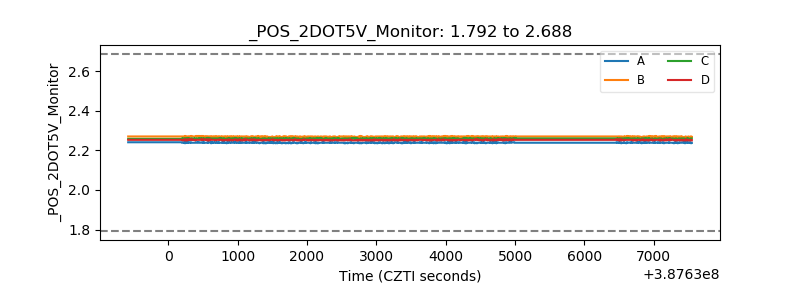 |
| +5 Volts monitor | 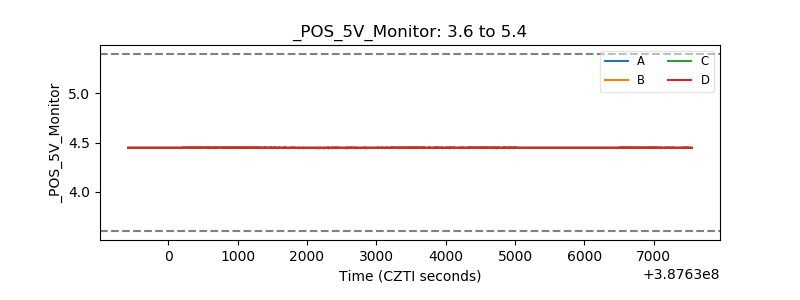 |
| _ROLL_ROT | 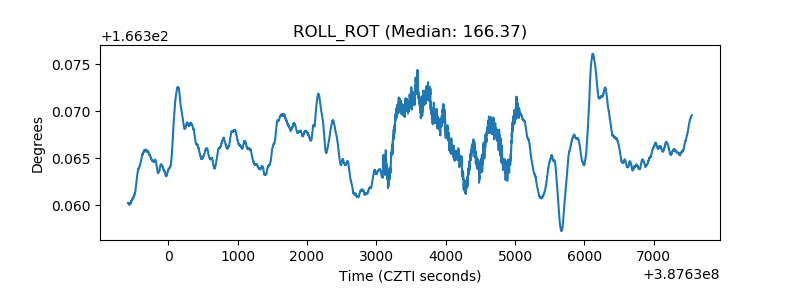 |
| _Roll_DEC | 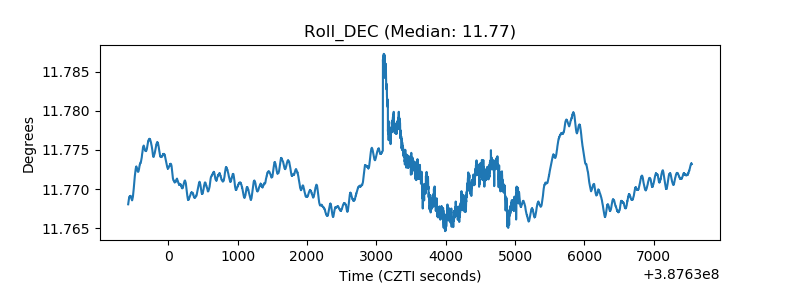 |
| _Roll_RA | 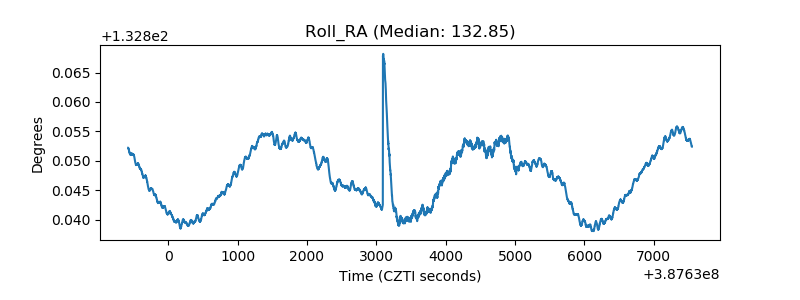 |
| Veto Counter | 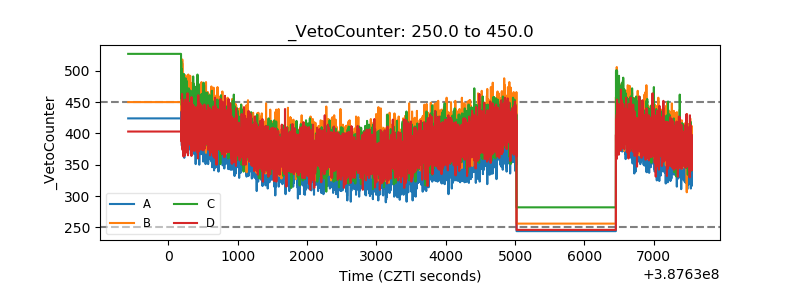 |