| Param | Original file | Final file |
|---|---|---|
| Filename | modeM0/AS1A11_099T01_9000005068_35379cztM0_level2.evt | modeM0/AS1A11_099T01_9000005068_35379cztM0_level2_quad_clean.evt |
| Size (bytes) | 818,507,520 | 53,395,200 |
| Size | 780.6 MB | 50.9 MB |
| Events in quadrant A | 2,617,765 | 403,946 |
| Events in quadrant B | 8,498,780 | 248,622 |
| Events in quadrant C | 4,458,226 | 385,445 |
| Events in quadrant D | 8,884,001 | 232,764 |
| Mode M9 | |||
|---|---|---|---|
| Quadrant | BADHDUFLAG | Total packets | Discarded packets |
| A | 0 | 29 | 0 |
| B | 0 | 29 | 0 |
| C | 0 | 29 | 0 |
| D | 0 | 30 | 0 |
| Mode M0 | |||
|---|---|---|---|
| Quadrant | BADHDUFLAG | Total packets | Discarded packets |
| A | 0 | 10507 | 3 |
| B | 0 | 28570 | 2 |
| C | 0 | 16433 | 2 |
| D | 0 | 29840 | 2 |
| Mode SS | |||
|---|---|---|---|
| Quadrant | BADHDUFLAG | Total packets | Discarded packets |
| A | 0 | 98 | 0 |
| B | 0 | 98 | 0 |
| C | 0 | 98 | 0 |
| D | 0 | 98 | 0 |
| Quadrant | Total seconds | Saturated seconds | Saturation percentage |
|---|---|---|---|
| A | 4903 | 11 | 0.224352% |
| B | 4903 | 2656 | 54.170916% |
| C | 4903 | 297 | 6.057516% |
| D | 4903 | 2527 | 51.539874% |
Noise dominated data is calculated using 1-second bins in cleaned event files. If a bin has >2000 counts, and if more than 50% of those come from <1% of pixels, then it is considered to be noise-dominated and hence unusable.
| Quadrant | # 1 sec bins | Bins with >0 counts | Bins with >2000 counts | High rate bins dominated by noise | Noise dominated (total time) | Noise dominated (detector-on time) | Marked lightcurve |
|---|---|---|---|---|---|---|---|
| A | 7026 | 4904 | 2 | 2 | 0.03% | 0.04% | 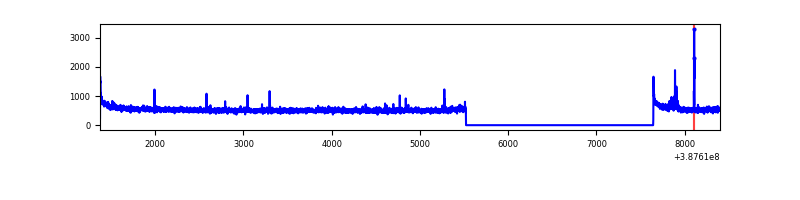 |
| B | 7026 | 4904 | 2320 | 2320 | 33.02% | 47.31% | 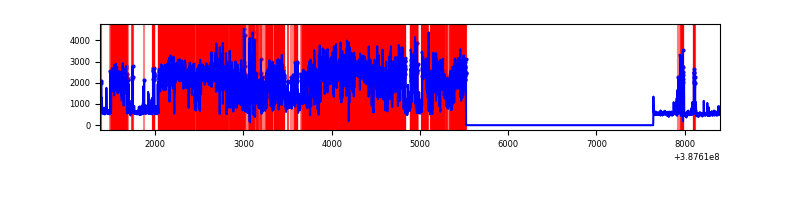 |
| C | 7026 | 4904 | 234 | 234 | 3.33% | 4.77% | 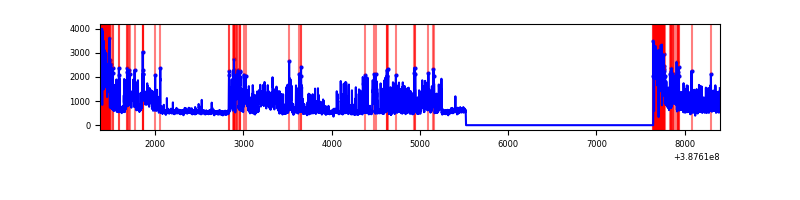 |
| D | 7026 | 4904 | 2451 | 2451 | 34.88% | 49.98% | 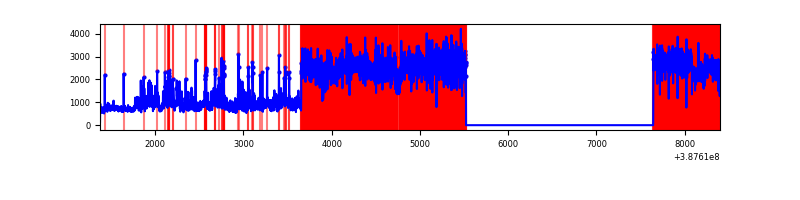 |
Top three noisy pixels from each quadrant. If the there are fewer than three noisy pixels in the level2.evt file, extra rows are filled as -1
| Pixel properties | Quadrant properties | ||||||
|---|---|---|---|---|---|---|---|
| Quadrant | DetID | PixID | Counts | Sigma | Mean | Median | Sigma |
| A | 10 | 83 | 117628 | 919.84 | 633 | 623 | 127.2 |
| A | 14 | 254 | 20954 | 159.83 | 633 | 623 | 127.2 |
| A | 9 | 143 | 20378 | 155.3 | 633 | 623 | 127.2 |
| B | 4 | 251 | 5820335 | 66490.56 | 459 | 448 | 87.5 |
| B | 5 | 236 | 344753 | 3933.59 | 459 | 448 | 87.5 |
| B | 5 | 200 | 242979 | 2770.85 | 459 | 448 | 87.5 |
| C | 10 | 49 | 1365368 | 10130.39 | 587 | 591 | 134.7 |
| C | 0 | 10 | 520946 | 3862.46 | 587 | 591 | 134.7 |
| C | 15 | 214 | 204429 | 1513.04 | 587 | 591 | 134.7 |
| D | 7 | 80 | 5891149 | 54026.51 | 440 | 426 | 109.0 |
| D | 8 | 195 | 586289 | 5373.22 | 440 | 426 | 109.0 |
| D | 12 | 217 | 321598 | 2945.62 | 440 | 426 | 109.0 |
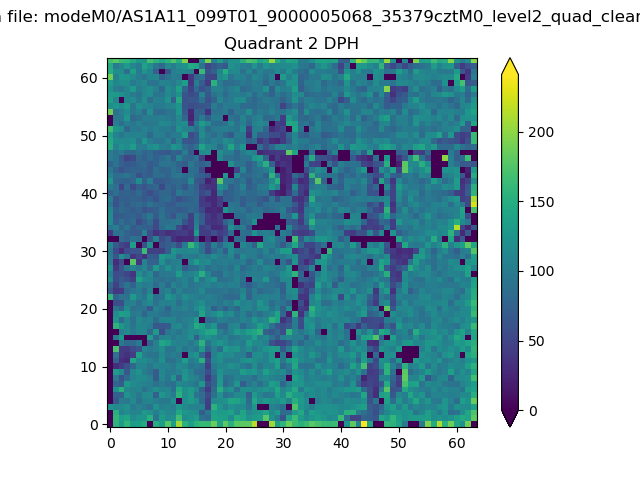
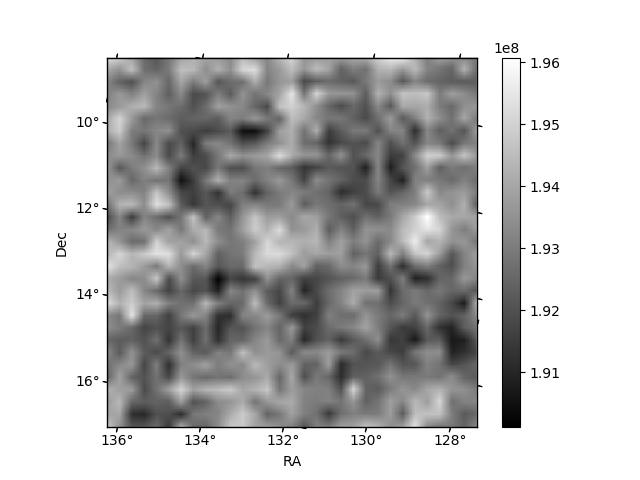
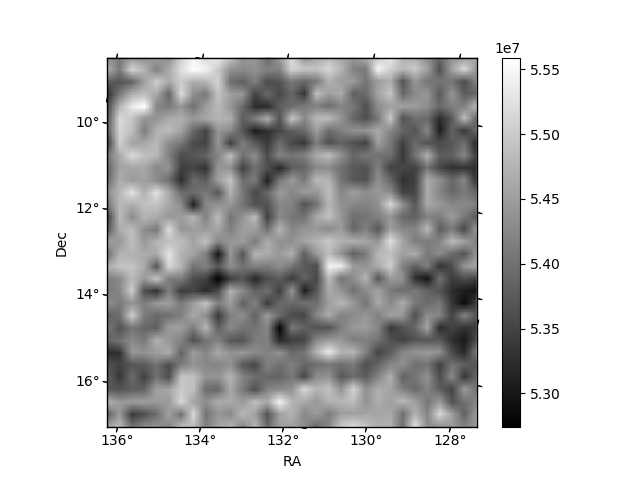
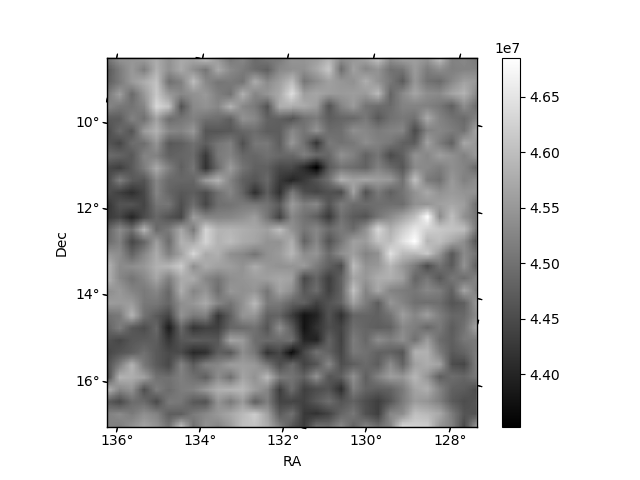
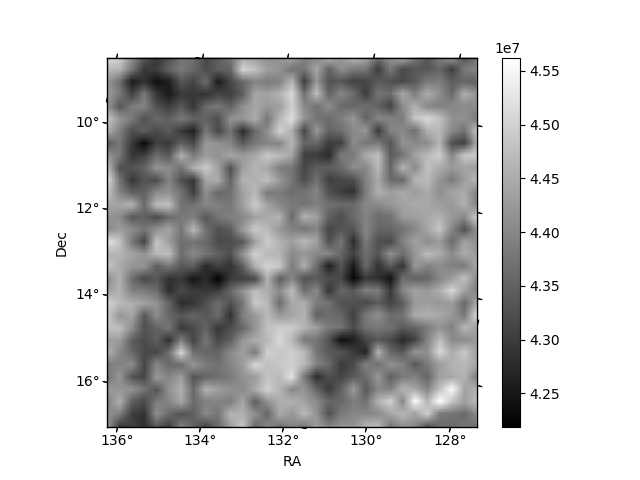
Histogram calculated using DETX and DETY for each event in the final _common_clean file
| Quadrant A | 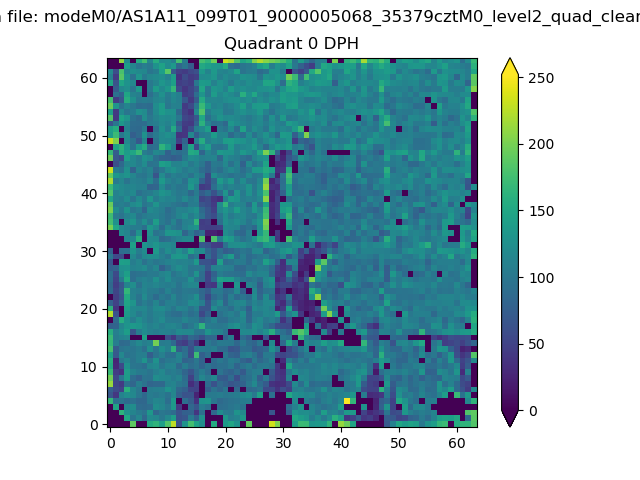 |
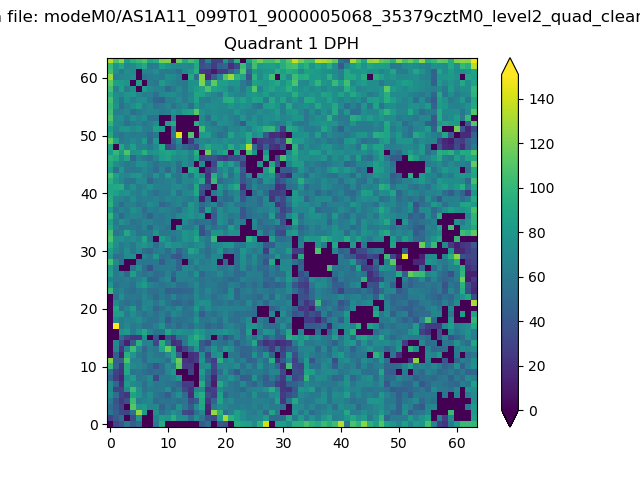 |
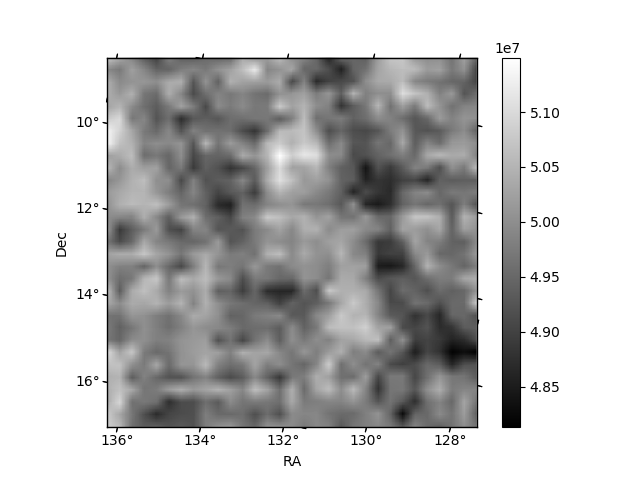
Quadrant B |
|---|---|---|---|
| Quadrant D | 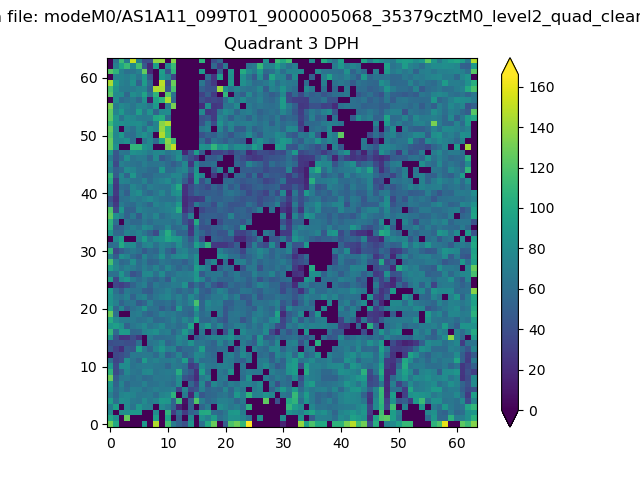 |
 |
Quadrant C |
| Plot type | Count rate plots | Images |
|---|---|---|
| Comparison with Poisson distribution Blue bars denote a histogram of data divided into 1 sec bins. Red curve is a Poisson curve with rate = median count rate of data. |
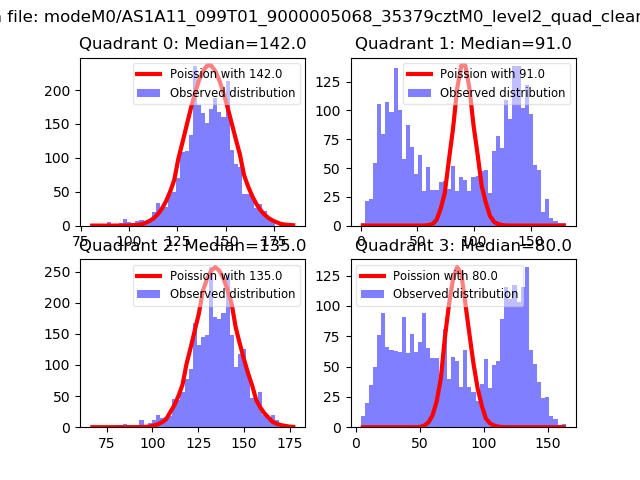 |
 |
| Quadrant-wise count rates Data is divided into 100 sec bins |
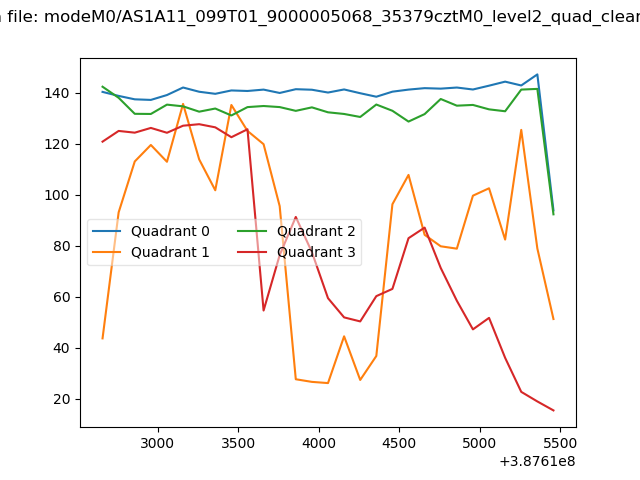 |
|
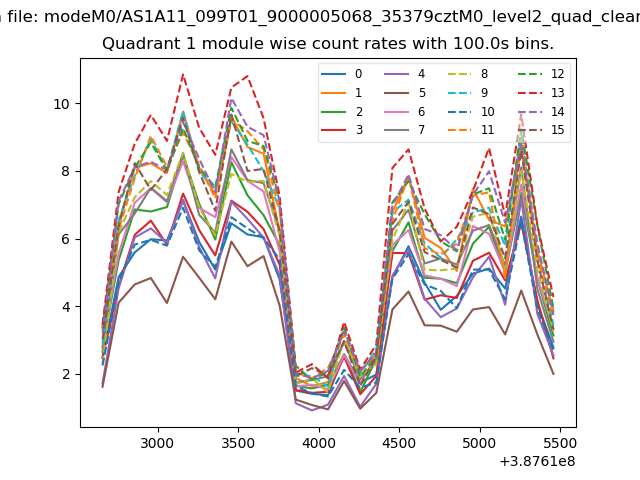
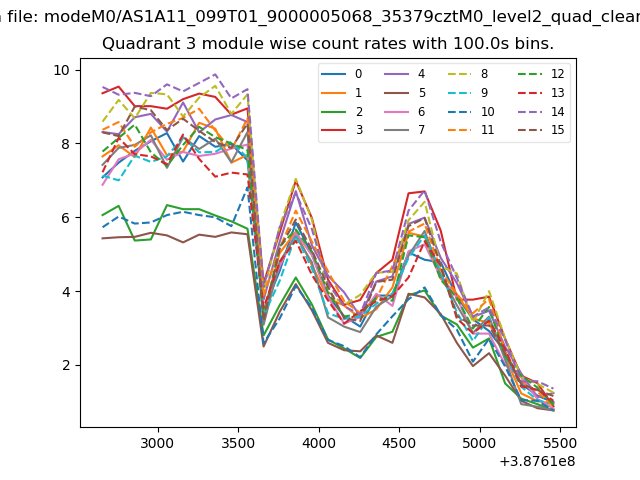
| Module-wise count rates for Quadrant A Data is divided into 100 sec bins |
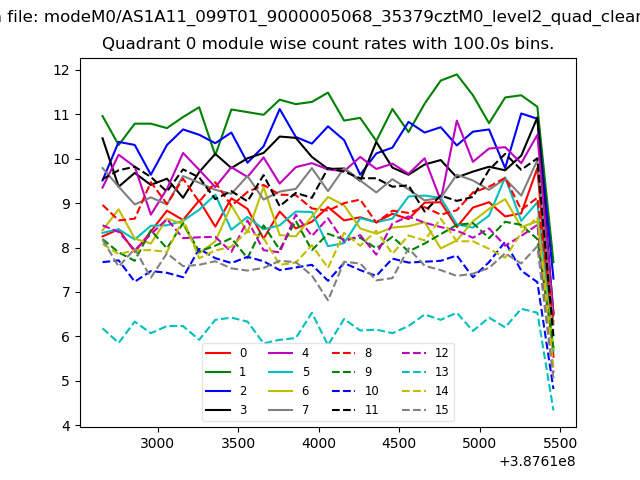 |
 |
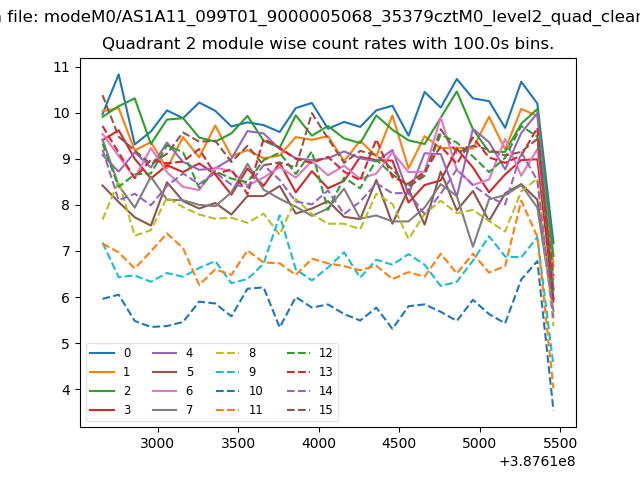
| Module-wise count rates for Quadrant B Data is divided into 100 sec bins |
 |
 |
| Module-wise count rates for Quadrant C Data is divided into 100 sec bins |
 |
 |
| Module-wise count rates for Quadrant D Data is divided into 100 sec bins |
 |
 |
| Parameter | Plot |
|---|---|
| CZT HV Monitor | 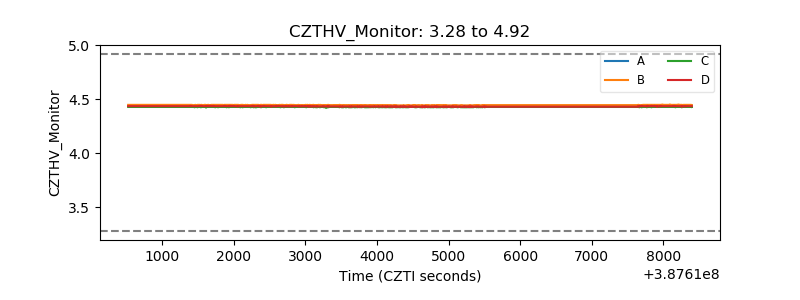 |
| D_VDD | 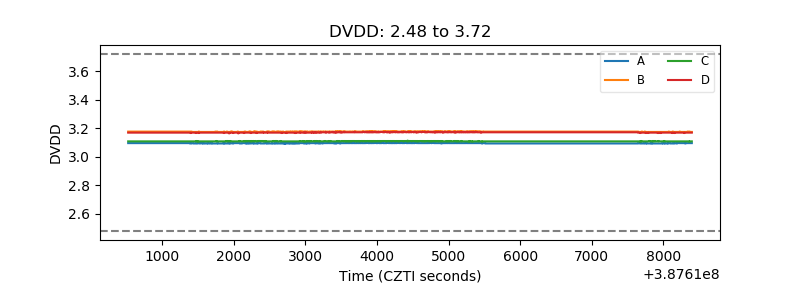 |
| Temperature 1 | 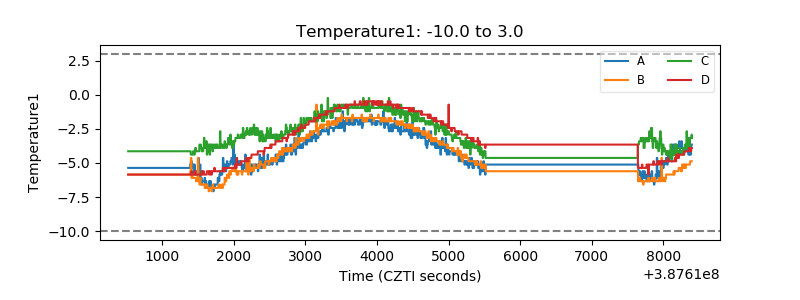 |
| Veto HV Monitor | 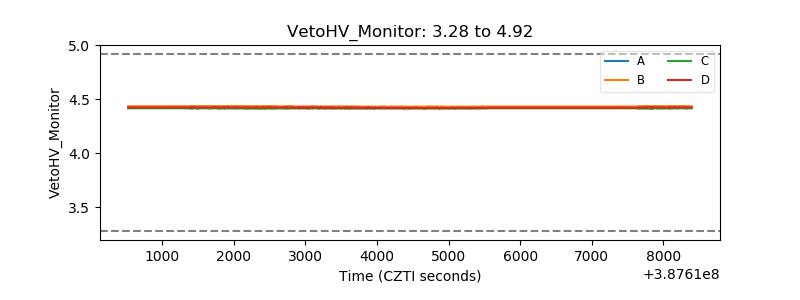 |
| Veto LLD | 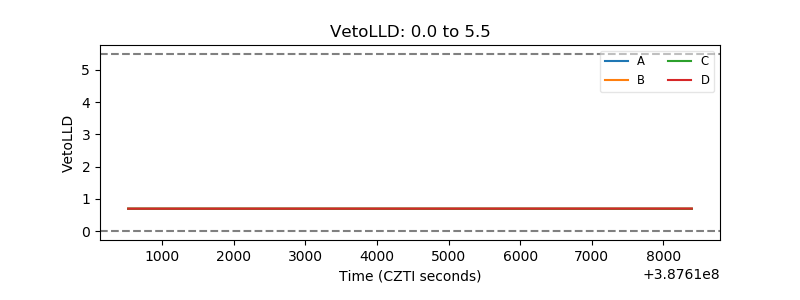 |
| Alpha Counter | 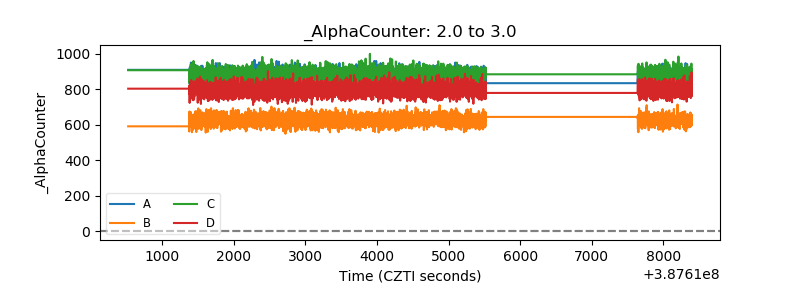 |
| _CPM_Rate | 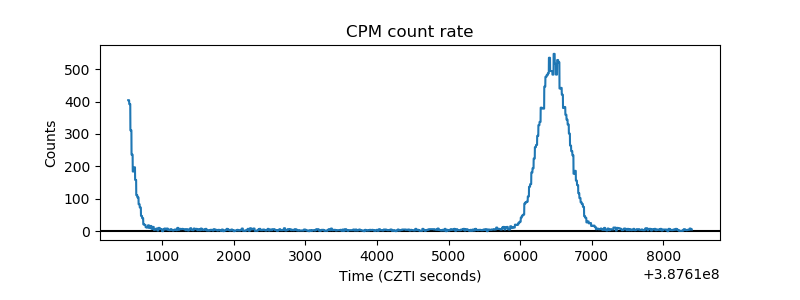 |
| CZT Counter | 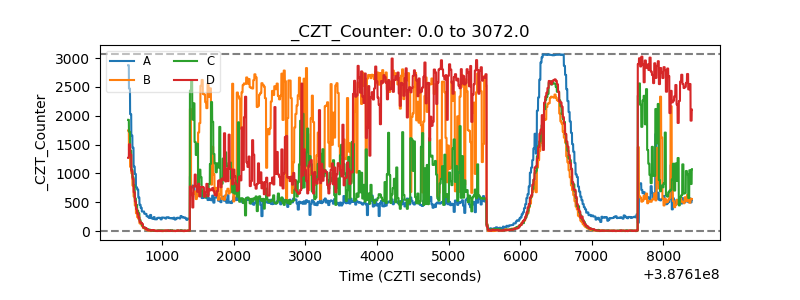 |
| +2.5 Volts monitor | 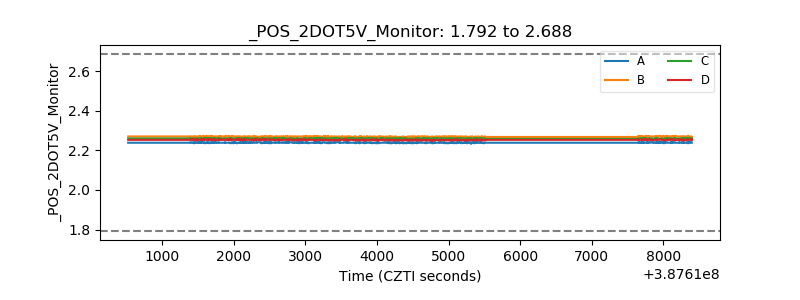 |
| +5 Volts monitor | 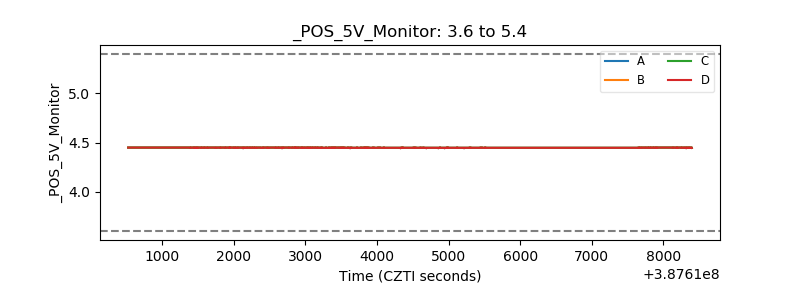 |
| _ROLL_ROT | 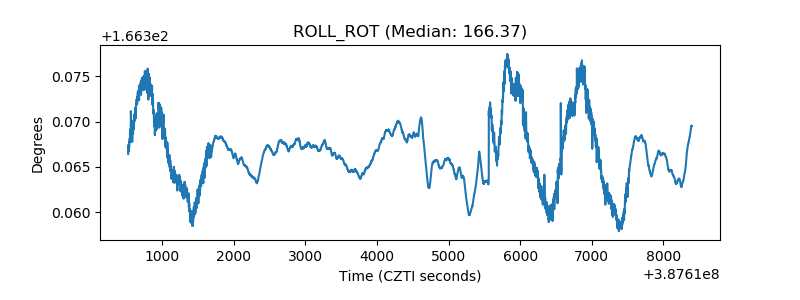 |
| _Roll_DEC | 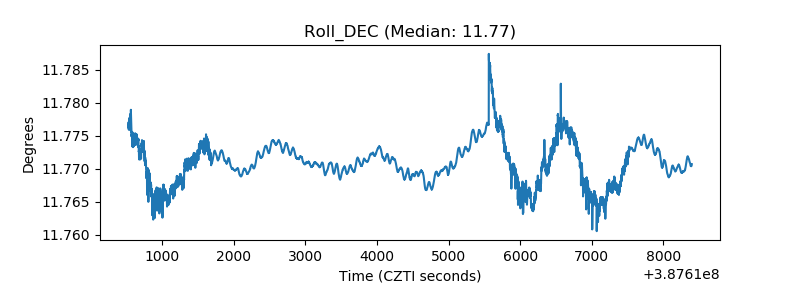 |
| _Roll_RA | 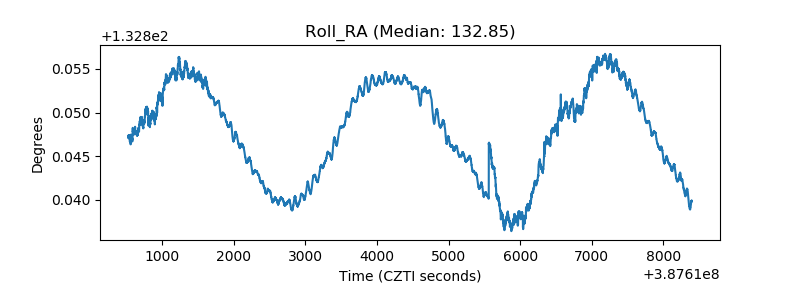 |
| Veto Counter | 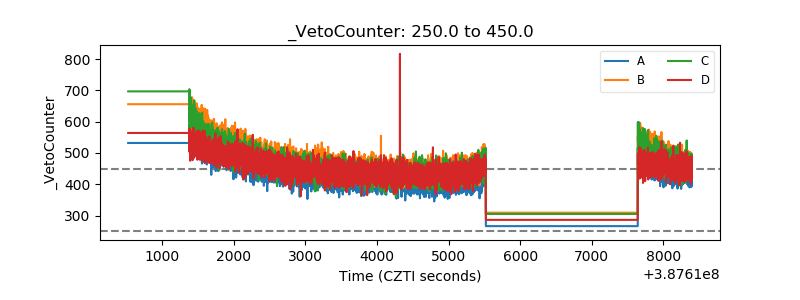 |