| Param | Original file | Final file |
|---|---|---|
| Filename | modeM0/AS1A11_099T01_9000005068_35378cztM0_level2.evt | modeM0/AS1A11_099T01_9000005068_35378cztM0_level2_quad_clean.evt |
| Size (bytes) | 607,389,120 | 51,258,240 |
| Size | 579.3 MB | 48.9 MB |
| Events in quadrant A | 2,794,939 | 350,146 |
| Events in quadrant B | 7,466,308 | 199,900 |
| Events in quadrant C | 3,497,064 | 340,897 |
| Events in quadrant D | 4,292,985 | 303,844 |
| Mode M9 | |||
|---|---|---|---|
| Quadrant | BADHDUFLAG | Total packets | Discarded packets |
| A | 0 | 34 | 0 |
| B | 0 | 34 | 0 |
| C | 0 | 34 | 0 |
| D | 0 | 35 | 0 |
| Mode M0 | |||
|---|---|---|---|
| Quadrant | BADHDUFLAG | Total packets | Discarded packets |
| A | 0 | 11106 | 3 |
| B | 0 | 25747 | 2 |
| C | 0 | 13255 | 2 |
| D | 0 | 16443 | 2 |
| Mode SS | |||
|---|---|---|---|
| Quadrant | BADHDUFLAG | Total packets | Discarded packets |
| A | 0 | 104 | 0 |
| B | 0 | 104 | 0 |
| C | 0 | 104 | 0 |
| D | 0 | 104 | 0 |
| Quadrant | Total seconds | Saturated seconds | Saturation percentage |
|---|---|---|---|
| A | 5077 | 11 | 0.216663% |
| B | 5077 | 2055 | 40.476659% |
| C | 5077 | 230 | 4.530234% |
| D | 5077 | 209 | 4.116604% |
Noise dominated data is calculated using 1-second bins in cleaned event files. If a bin has >2000 counts, and if more than 50% of those come from <1% of pixels, then it is considered to be noise-dominated and hence unusable.
| Quadrant | # 1 sec bins | Bins with >0 counts | Bins with >2000 counts | High rate bins dominated by noise | Noise dominated (total time) | Noise dominated (detector-on time) | Marked lightcurve |
|---|---|---|---|---|---|---|---|
| A | 7201 | 5078 | 2 | 2 | 0.03% | 0.04% | 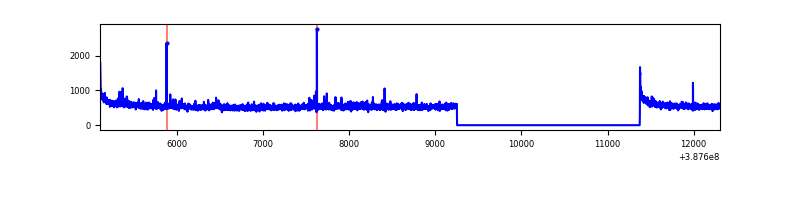 |
| B | 7201 | 5078 | 1759 | 1759 | 24.43% | 34.64% | 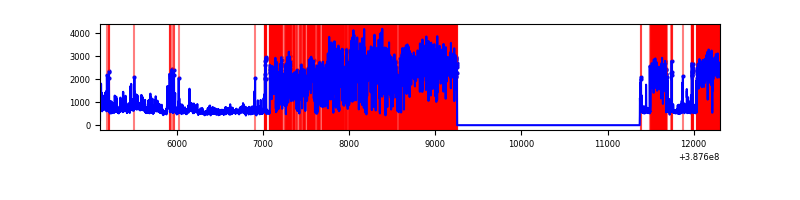 |
| C | 7201 | 5078 | 178 | 178 | 2.47% | 3.51% | 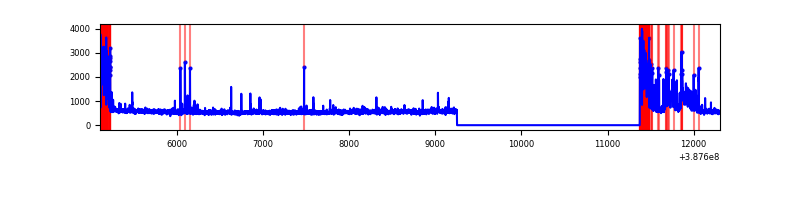 |
| D | 7201 | 5078 | 177 | 177 | 2.46% | 3.49% | 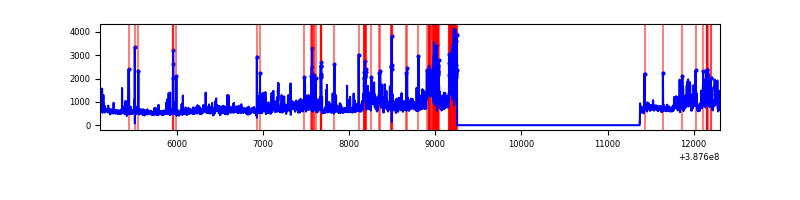 |
Top three noisy pixels from each quadrant. If the there are fewer than three noisy pixels in the level2.evt file, extra rows are filled as -1
| Pixel properties | Quadrant properties | ||||||
|---|---|---|---|---|---|---|---|
| Quadrant | DetID | PixID | Counts | Sigma | Mean | Median | Sigma |
| A | 10 | 83 | 116242 | 865.69 | 671 | 660 | 133.5 |
| A | 14 | 254 | 32822 | 240.89 | 671 | 660 | 133.5 |
| A | 9 | 143 | 22406 | 162.87 | 671 | 660 | 133.5 |
| B | 4 | 251 | 5026561 | 50796.86 | 522 | 511 | 98.9 |
| B | 5 | 172 | 173533 | 1748.68 | 522 | 511 | 98.9 |
| B | 5 | 236 | 100249 | 1008.02 | 522 | 511 | 98.9 |
| C | 0 | 10 | 555230 | 3852.46 | 627 | 630 | 144.0 |
| C | 10 | 49 | 225334 | 1560.87 | 627 | 630 | 144.0 |
| C | 15 | 214 | 210436 | 1457.39 | 627 | 630 | 144.0 |
| D | 8 | 195 | 735965 | 4864.96 | 626 | 611 | 151.2 |
| D | 10 | 253 | 354412 | 2340.68 | 626 | 611 | 151.2 |
| D | 12 | 217 | 171934 | 1133.44 | 626 | 611 | 151.2 |
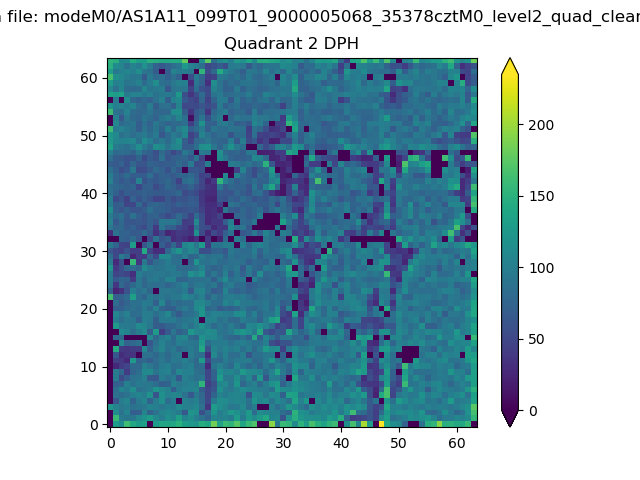
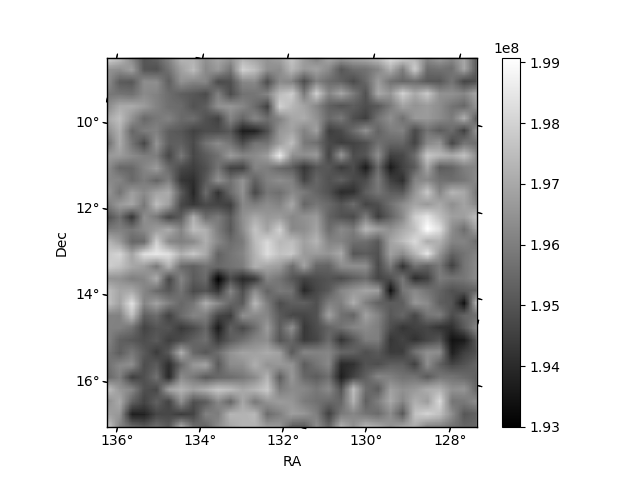
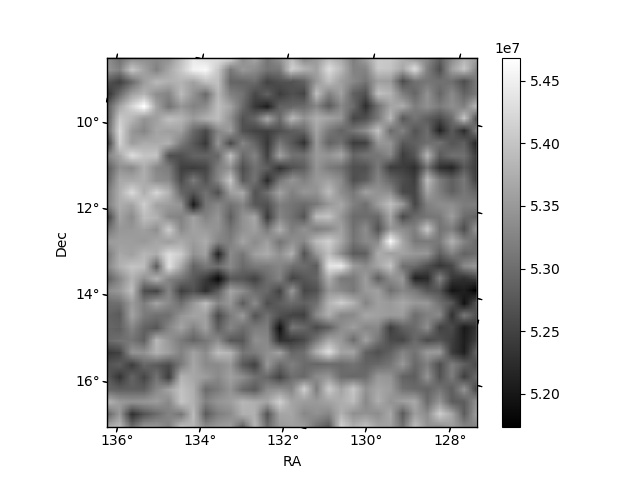
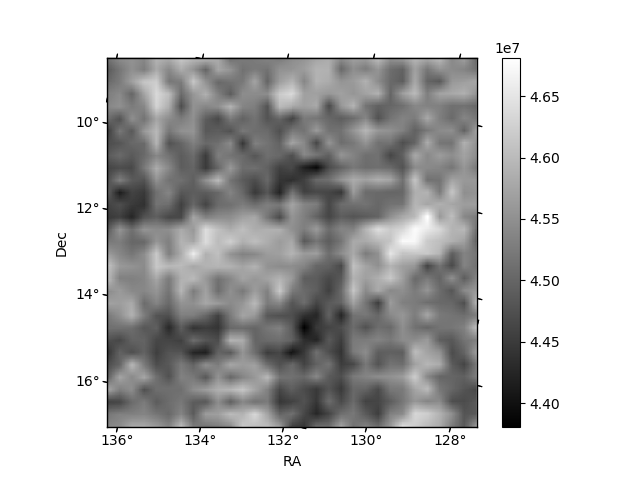
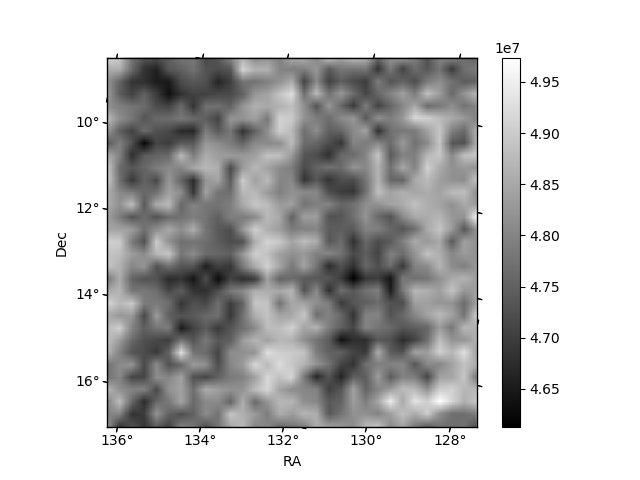
Histogram calculated using DETX and DETY for each event in the final _common_clean file
| Quadrant A | 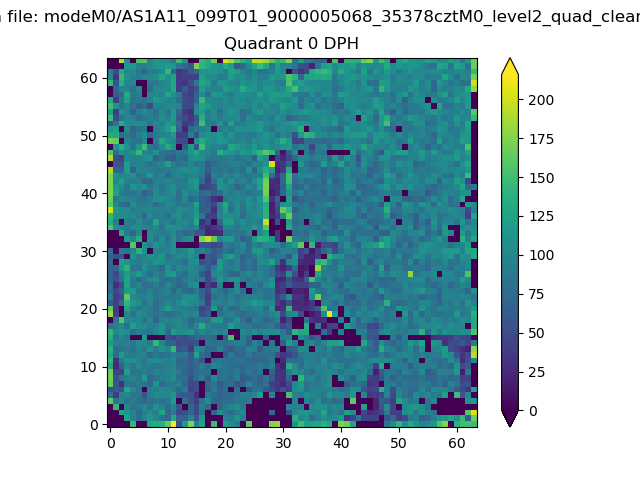 |
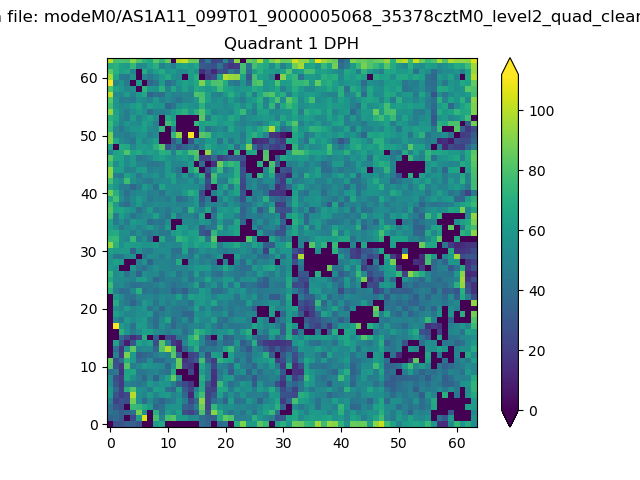 |
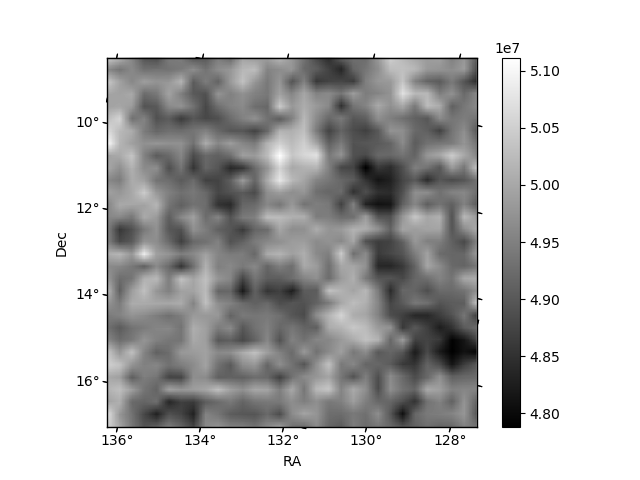
Quadrant B |
|---|---|---|---|
| Quadrant D | 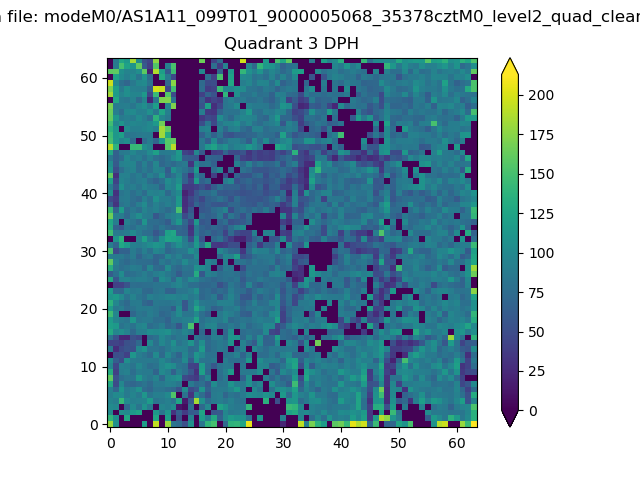 |
 |
Quadrant C |
| Plot type | Count rate plots | Images |
|---|---|---|
| Comparison with Poisson distribution Blue bars denote a histogram of data divided into 1 sec bins. Red curve is a Poisson curve with rate = median count rate of data. |
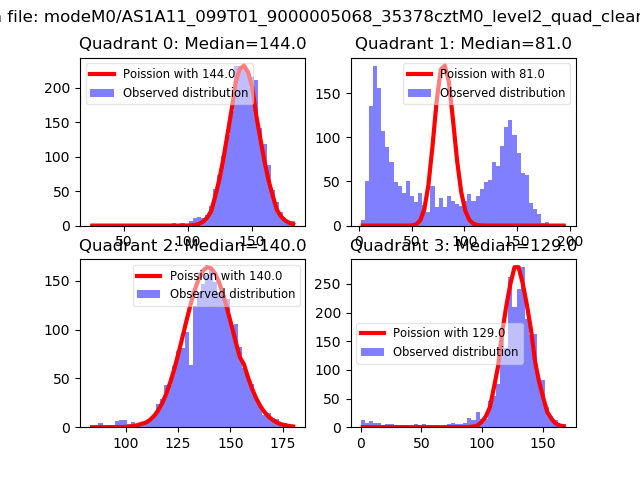 |
 |
| Quadrant-wise count rates Data is divided into 100 sec bins |
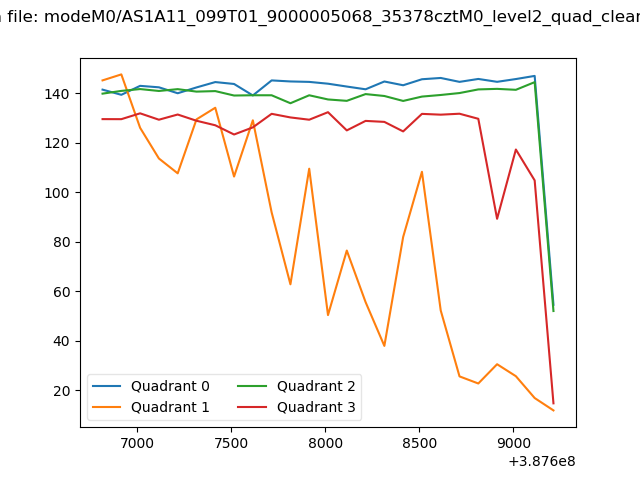 |
|
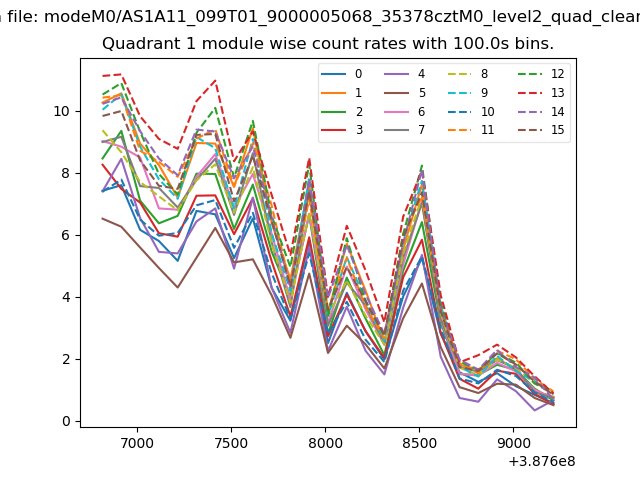
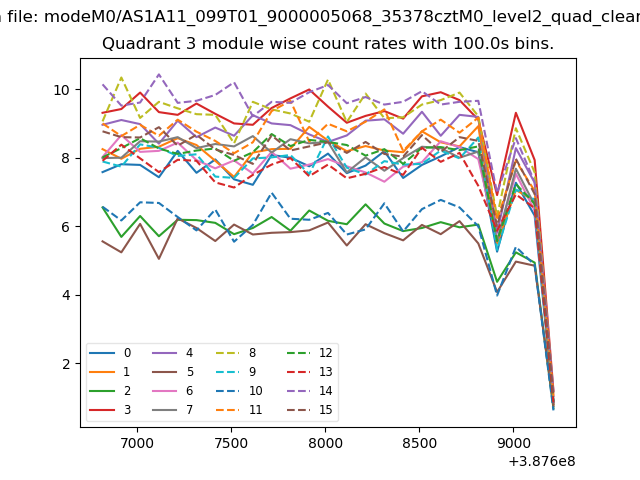
| Module-wise count rates for Quadrant A Data is divided into 100 sec bins |
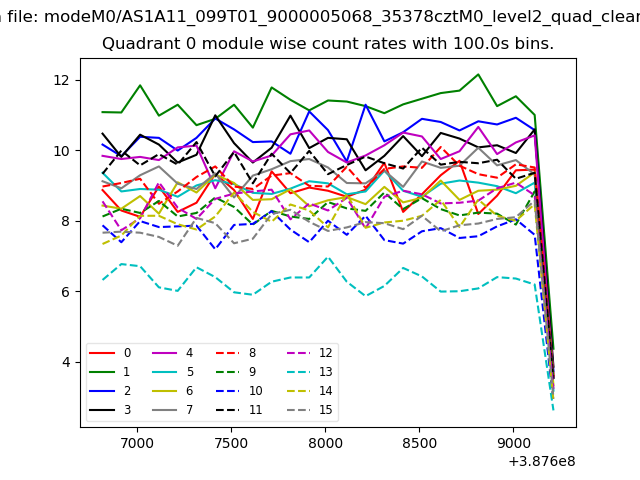 |
 |
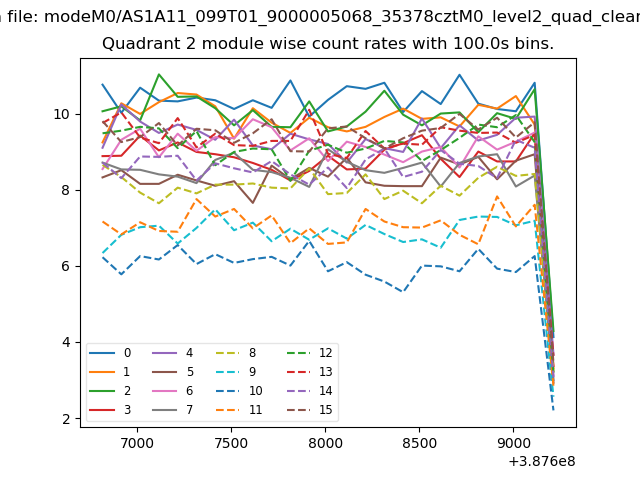
| Module-wise count rates for Quadrant B Data is divided into 100 sec bins |
 |
 |
| Module-wise count rates for Quadrant C Data is divided into 100 sec bins |
 |
 |
| Module-wise count rates for Quadrant D Data is divided into 100 sec bins |
 |
 |
| Parameter | Plot |
|---|---|
| CZT HV Monitor | 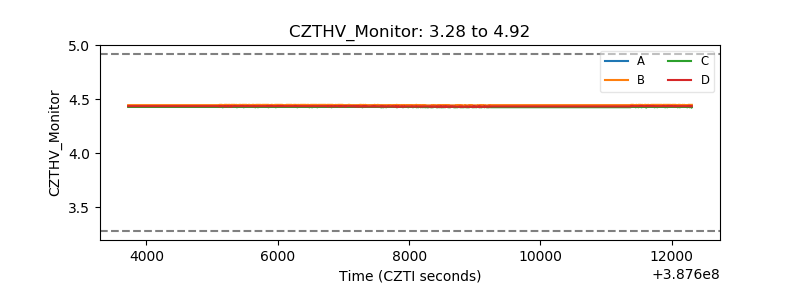 |
| D_VDD | 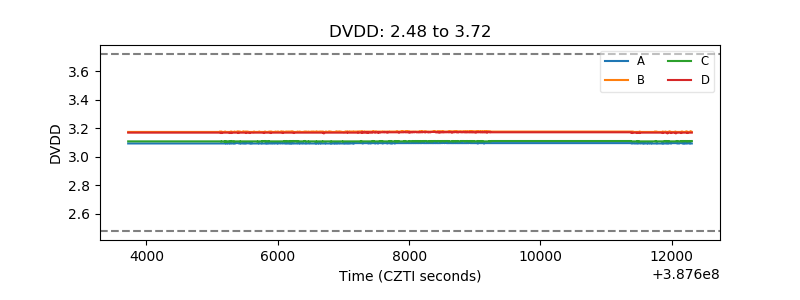 |
| Temperature 1 | 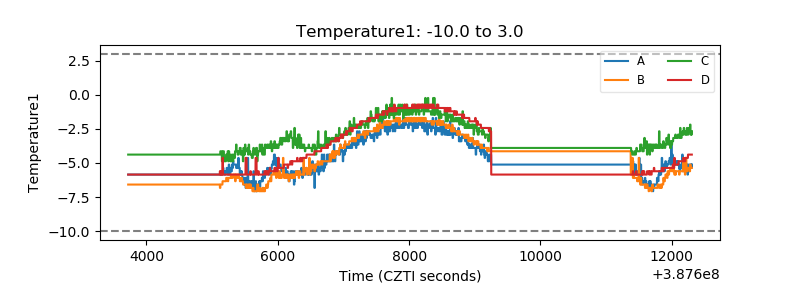 |
| Veto HV Monitor | 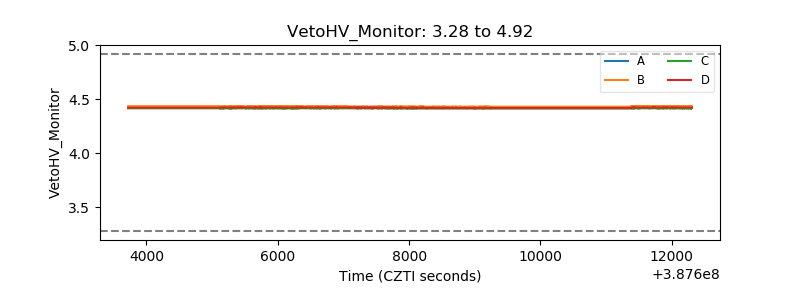 |
| Veto LLD | 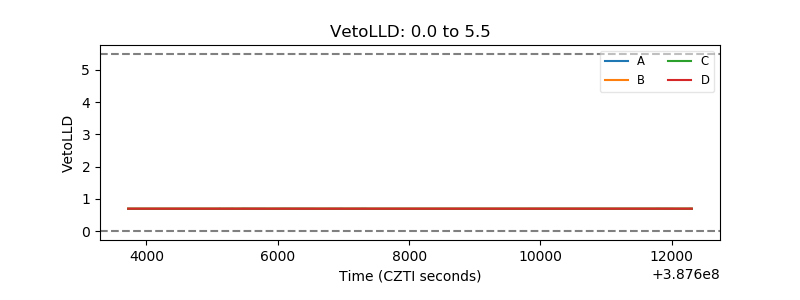 |
| Alpha Counter | 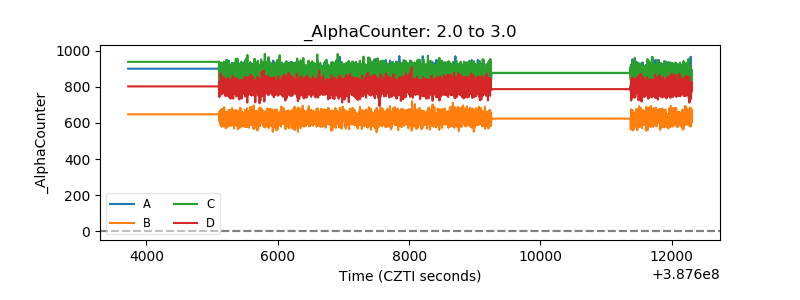 |
| _CPM_Rate | 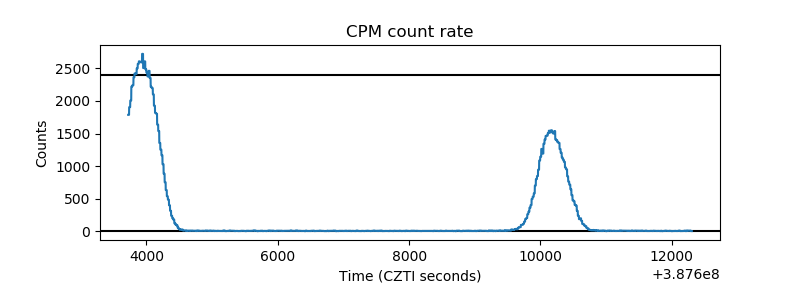 |
| CZT Counter | 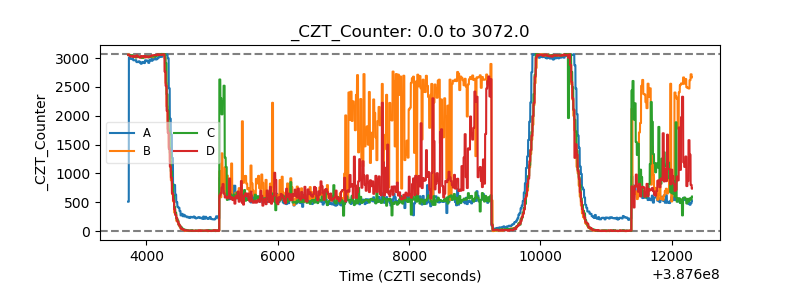 |
| +2.5 Volts monitor | 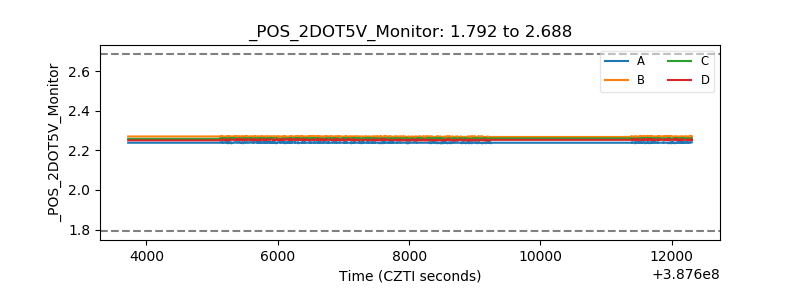 |
| +5 Volts monitor | 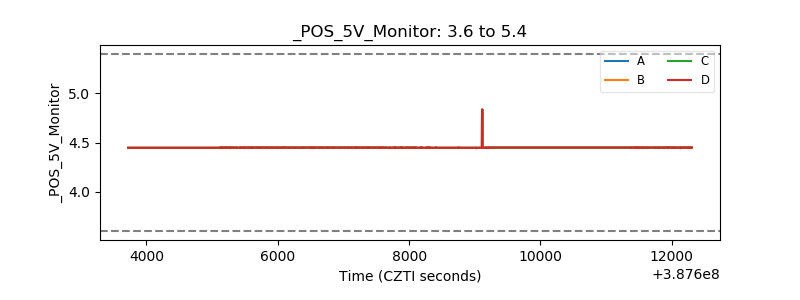 |
| _ROLL_ROT | 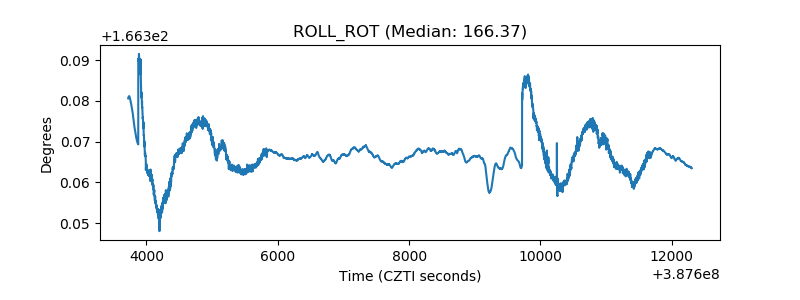 |
| _Roll_DEC | 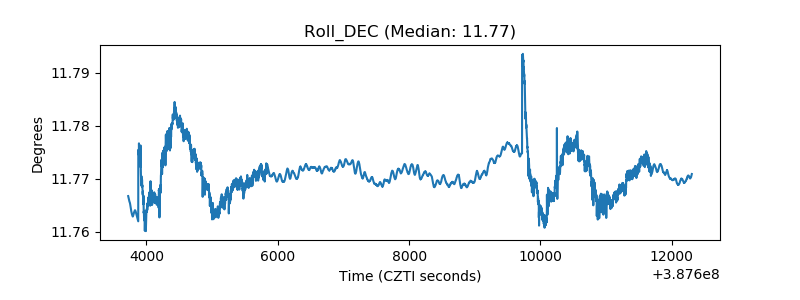 |
| _Roll_RA | 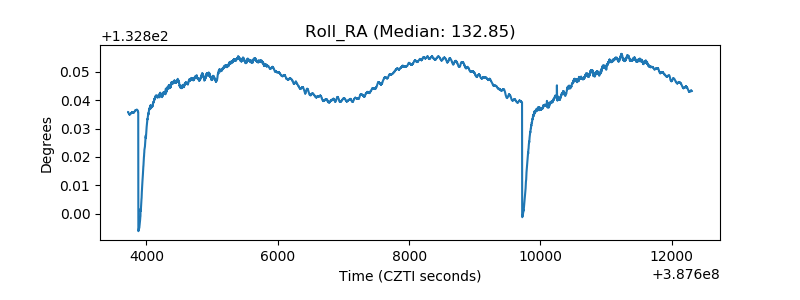 |
| Veto Counter | 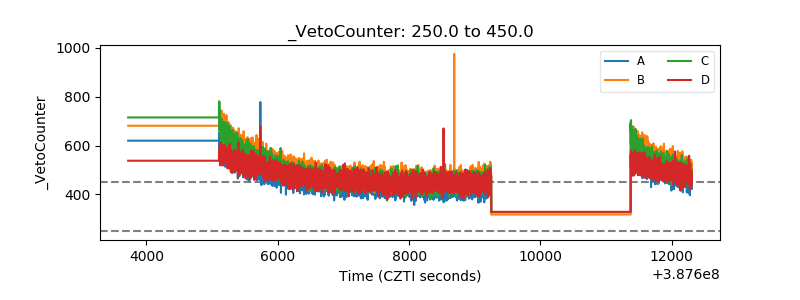 |