| Param | Original file | Final file |
|---|---|---|
| Filename | modeM0/AS1A11_099T01_9000005068_35377cztM0_level2.evt | modeM0/AS1A11_099T01_9000005068_35377cztM0_level2_quad_clean.evt |
| Size (bytes) | 559,022,400 | 49,622,400 |
| Size | 533.1 MB | 47.3 MB |
| Events in quadrant A | 2,818,795 | 299,792 |
| Events in quadrant B | 6,912,874 | 276,767 |
| Events in quadrant C | 3,367,934 | 291,621 |
| Events in quadrant D | 3,482,512 | 273,773 |
| Mode M9 | |||
|---|---|---|---|
| Quadrant | BADHDUFLAG | Total packets | Discarded packets |
| A | 0 | 27 | 0 |
| B | 0 | 27 | 0 |
| C | 0 | 27 | 0 |
| D | 0 | 28 | 0 |
| Mode M0 | |||
|---|---|---|---|
| Quadrant | BADHDUFLAG | Total packets | Discarded packets |
| A | 0 | 11226 | 3 |
| B | 0 | 24160 | 2 |
| C | 0 | 12929 | 2 |
| D | 0 | 13739 | 2 |
| Mode SS | |||
|---|---|---|---|
| Quadrant | BADHDUFLAG | Total packets | Discarded packets |
| A | 0 | 104 | 0 |
| B | 0 | 104 | 0 |
| C | 0 | 104 | 0 |
| D | 0 | 104 | 0 |
| Quadrant | Total seconds | Saturated seconds | Saturation percentage |
|---|---|---|---|
| A | 5140 | 18 | 0.350195% |
| B | 5140 | 1681 | 32.704280% |
| C | 5140 | 209 | 4.066148% |
| D | 5140 | 36 | 0.700389% |
Noise dominated data is calculated using 1-second bins in cleaned event files. If a bin has >2000 counts, and if more than 50% of those come from <1% of pixels, then it is considered to be noise-dominated and hence unusable.
| Quadrant | # 1 sec bins | Bins with >0 counts | Bins with >2000 counts | High rate bins dominated by noise | Noise dominated (total time) | Noise dominated (detector-on time) | Marked lightcurve |
|---|---|---|---|---|---|---|---|
| A | 7173 | 5141 | 3 | 3 | 0.04% | 0.06% | 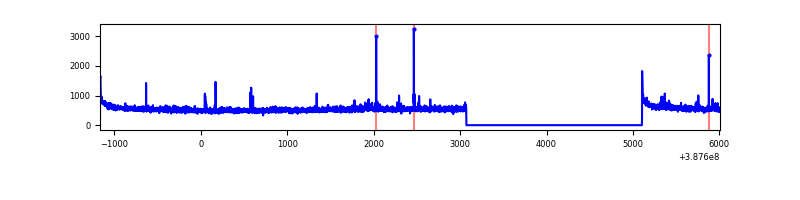 |
| B | 7173 | 5141 | 1486 | 1486 | 20.72% | 28.90% | 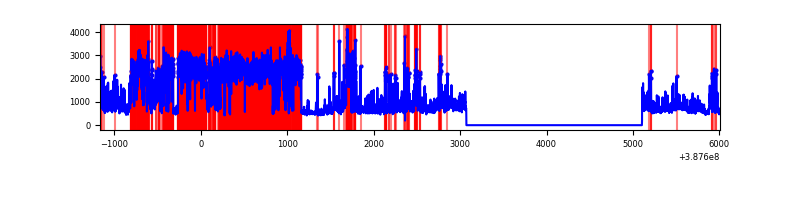 |
| C | 7173 | 5141 | 172 | 172 | 2.40% | 3.35% | 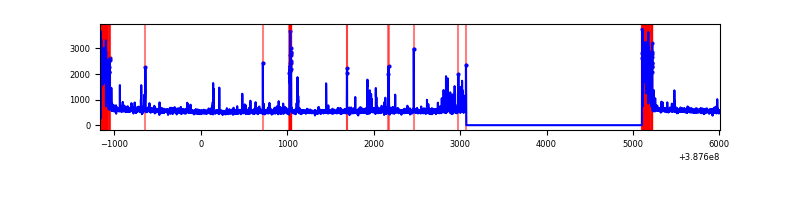 |
| D | 7173 | 5141 | 22 | 22 | 0.31% | 0.43% | 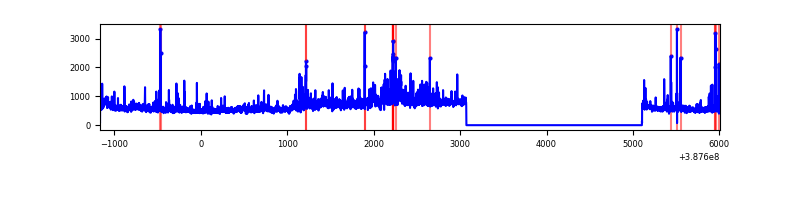 |
Top three noisy pixels from each quadrant. If the there are fewer than three noisy pixels in the level2.evt file, extra rows are filled as -1
| Pixel properties | Quadrant properties | ||||||
|---|---|---|---|---|---|---|---|
| Quadrant | DetID | PixID | Counts | Sigma | Mean | Median | Sigma |
| A | 10 | 83 | 114886 | 836.84 | 679 | 669 | 136.5 |
| A | 14 | 254 | 40274 | 290.18 | 679 | 669 | 136.5 |
| A | 9 | 143 | 22359 | 158.92 | 679 | 669 | 136.5 |
| B | 4 | 251 | 3939672 | 36006.76 | 582 | 570 | 109.4 |
| B | 5 | 172 | 307860 | 2808.89 | 582 | 570 | 109.4 |
| B | 5 | 200 | 276076 | 2518.36 | 582 | 570 | 109.4 |
| C | 0 | 10 | 535703 | 3626.02 | 637 | 644 | 147.6 |
| C | 15 | 214 | 211656 | 1430.0 | 637 | 644 | 147.6 |
| C | 15 | 208 | 110274 | 742.95 | 637 | 644 | 147.6 |
| D | 8 | 195 | 398530 | 2530.57 | 643 | 627 | 157.2 |
| D | 2 | 31 | 192050 | 1217.4 | 643 | 627 | 157.2 |
| D | 13 | 249 | 84554 | 533.76 | 643 | 627 | 157.2 |
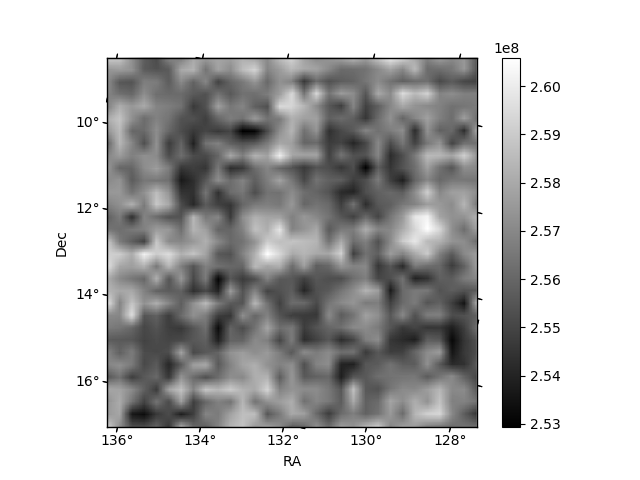
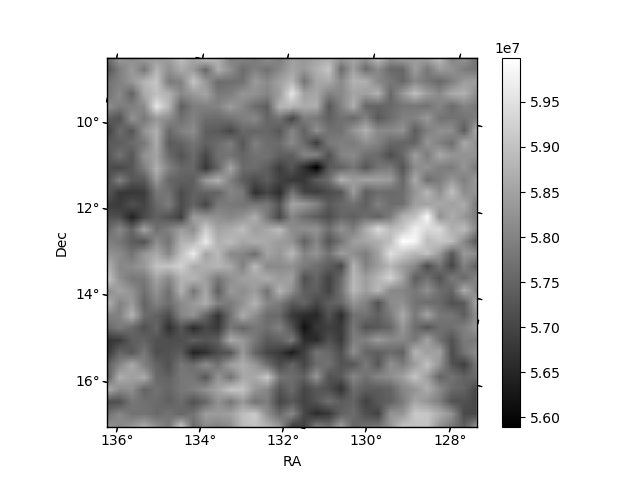
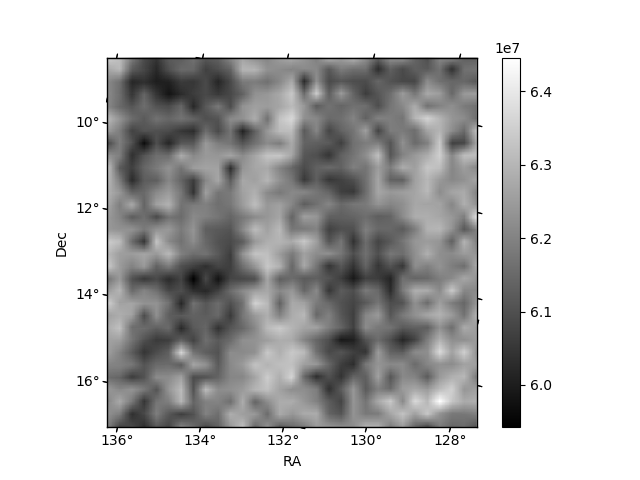
Histogram calculated using DETX and DETY for each event in the final _common_clean file
| Quadrant A | 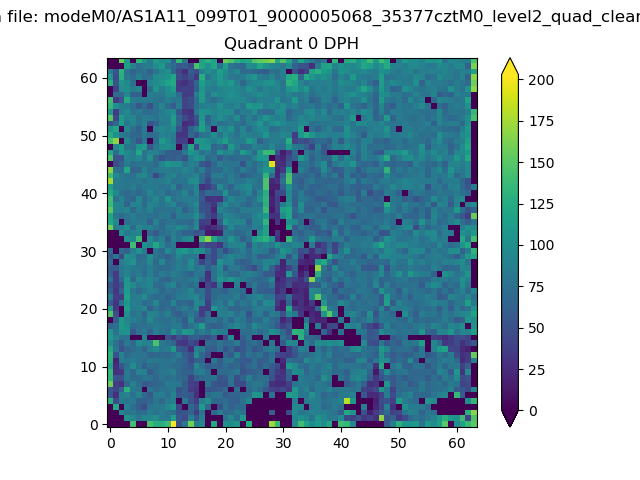 |
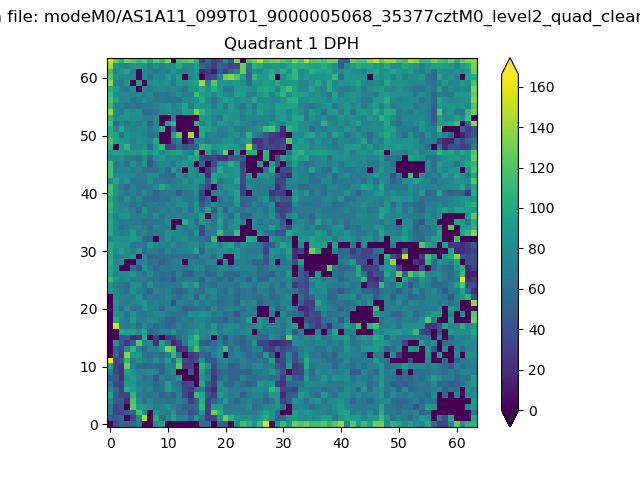 |
Quadrant B |
|---|---|---|---|
| Quadrant D | 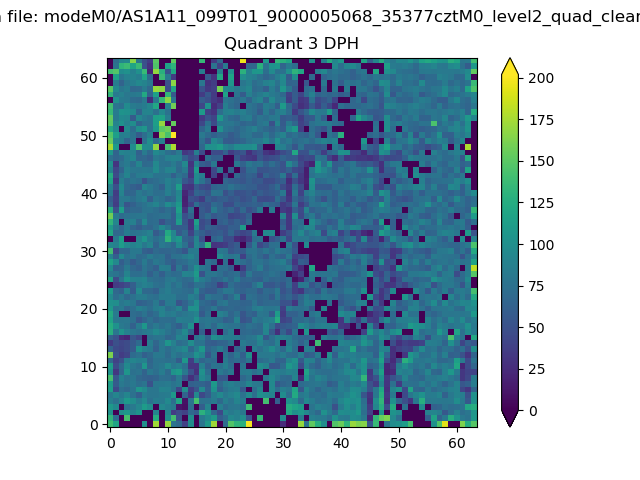 |
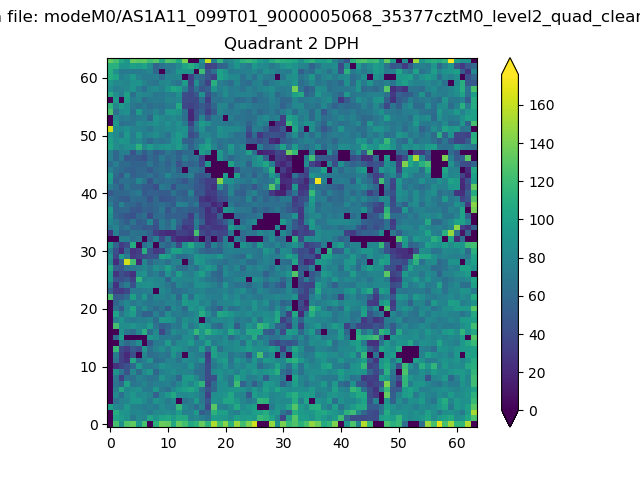 |
Quadrant C |
| Plot type | Count rate plots | Images |
|---|---|---|
| Comparison with Poisson distribution Blue bars denote a histogram of data divided into 1 sec bins. Red curve is a Poisson curve with rate = median count rate of data. |
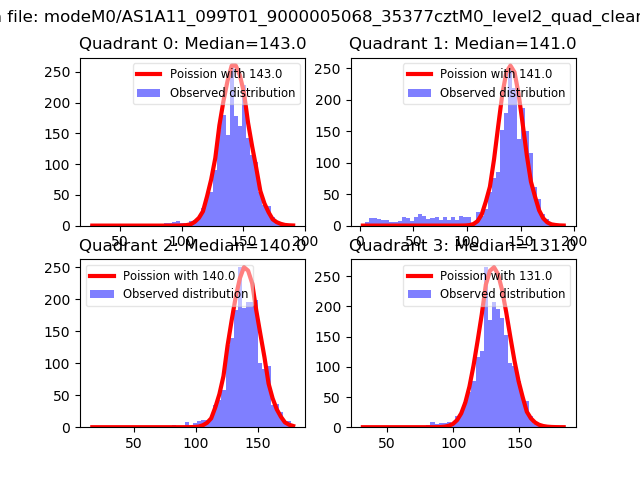 |
 |
| Quadrant-wise count rates Data is divided into 100 sec bins |
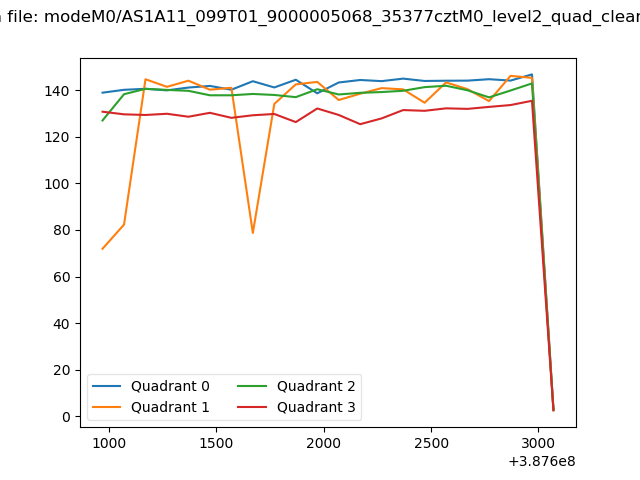 |
|
| Module-wise count rates for Quadrant A Data is divided into 100 sec bins |
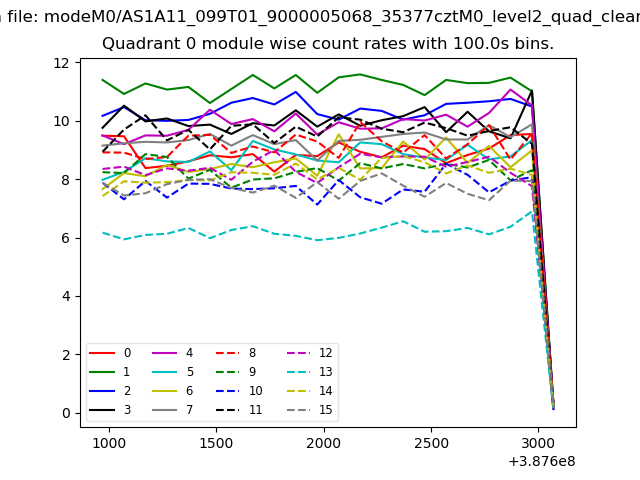 |
 |
| Module-wise count rates for Quadrant B Data is divided into 100 sec bins |
 |
 |
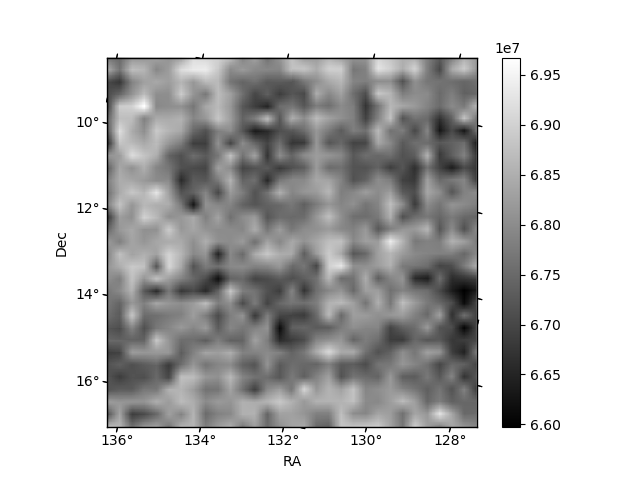
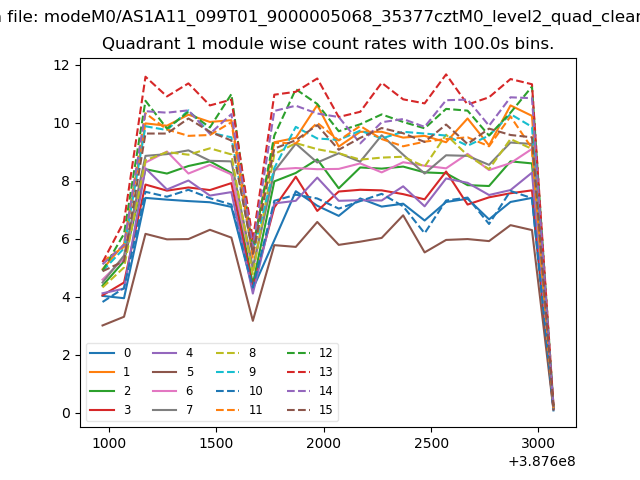
| Module-wise count rates for Quadrant C Data is divided into 100 sec bins |
 |
 |
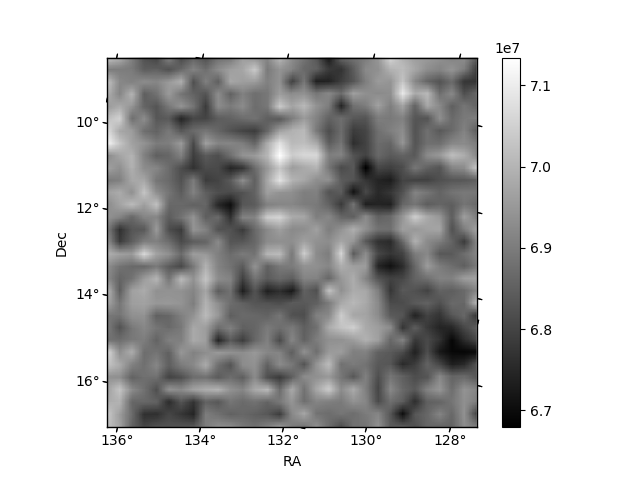
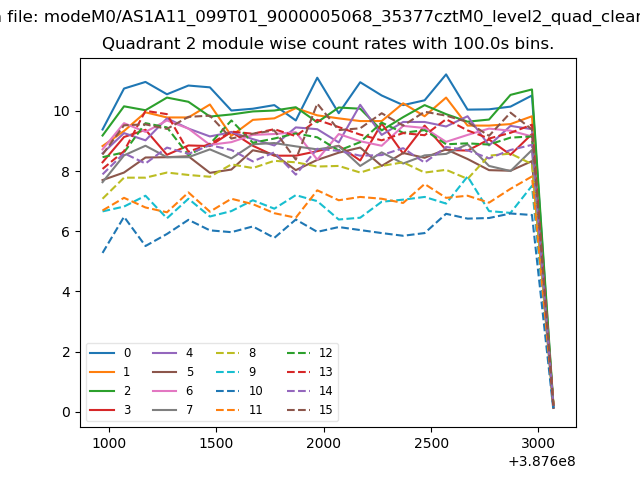
| Module-wise count rates for Quadrant D Data is divided into 100 sec bins |
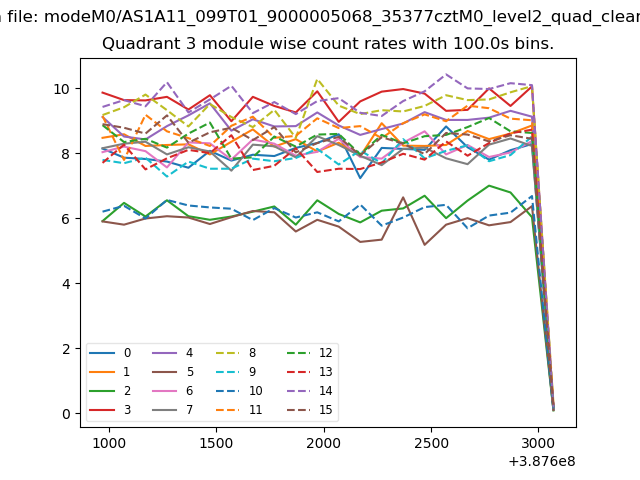 |
 |
| Parameter | Plot |
|---|---|
| CZT HV Monitor | 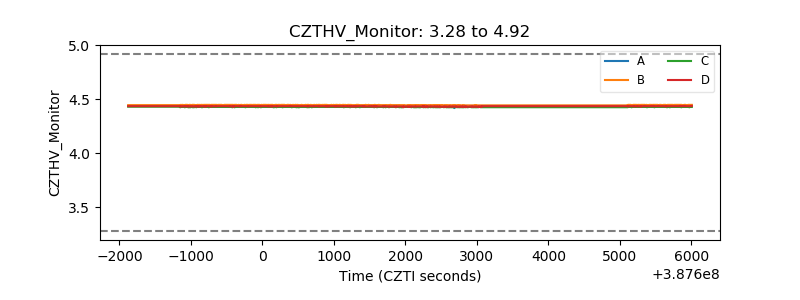 |
| D_VDD | 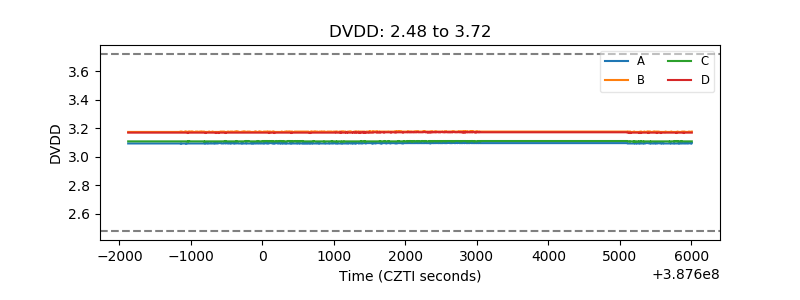 |
| Temperature 1 | 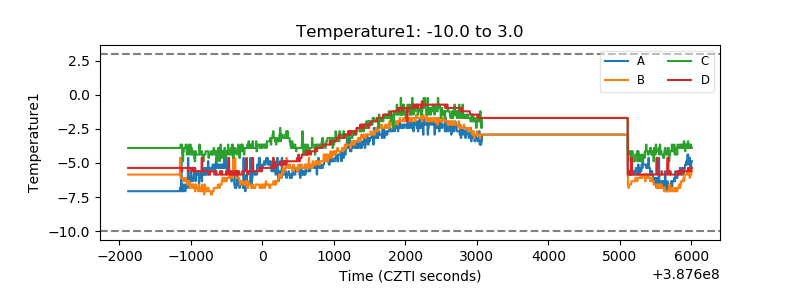 |
| Veto HV Monitor | 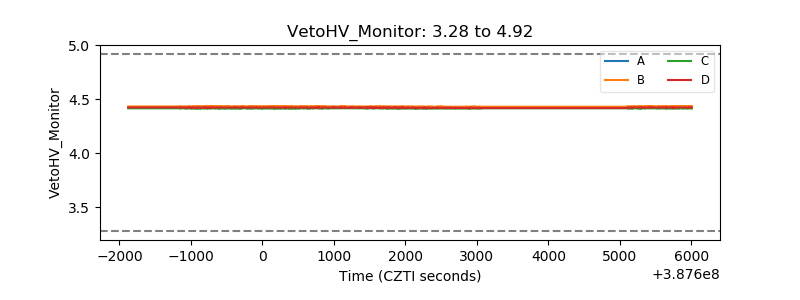 |
| Veto LLD | 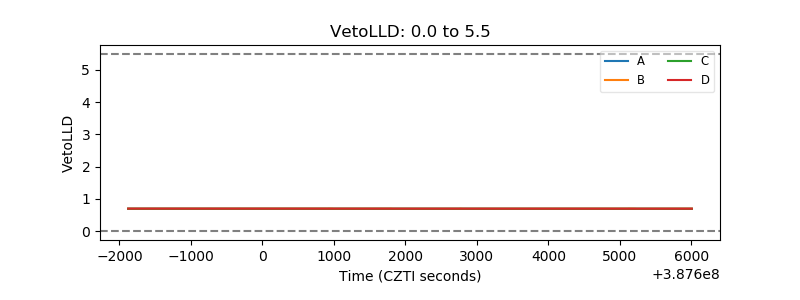 |
| Alpha Counter | 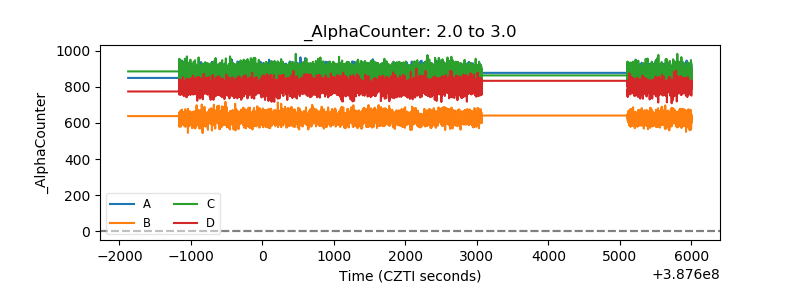 |
| _CPM_Rate | 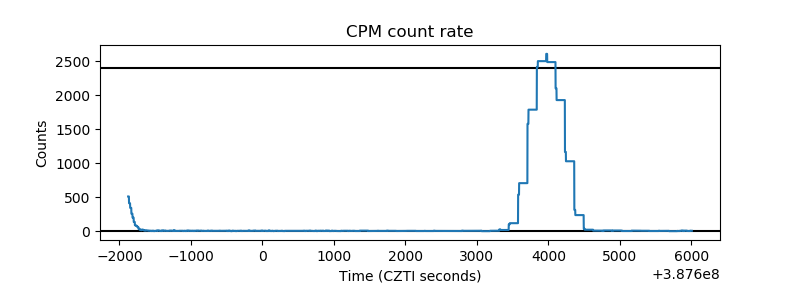 |
| CZT Counter | 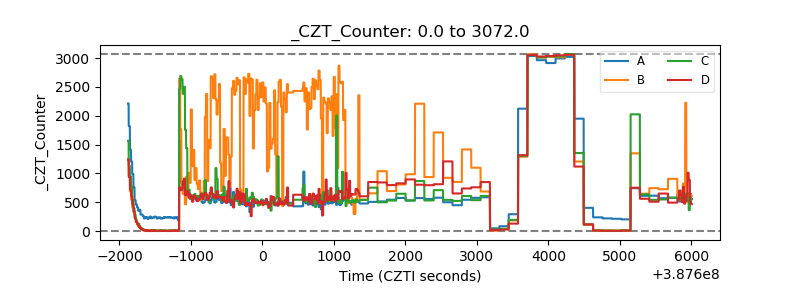 |
| +2.5 Volts monitor | 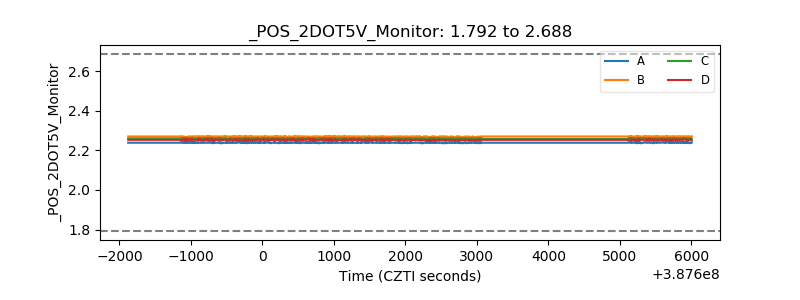 |
| +5 Volts monitor | 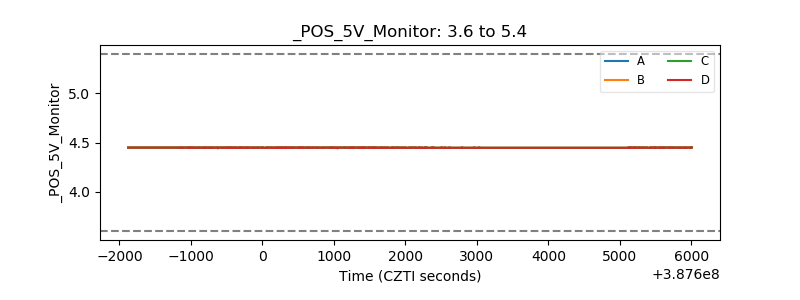 |
| _ROLL_ROT | 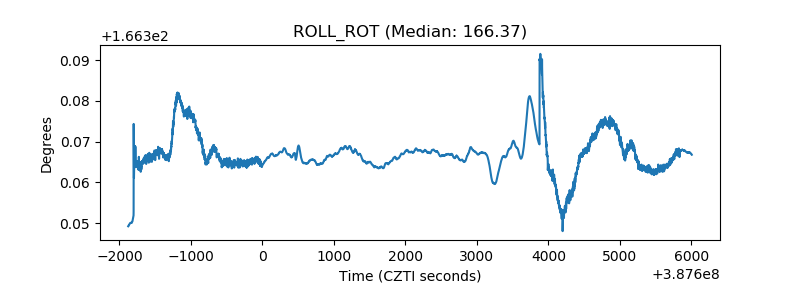 |
| _Roll_DEC | 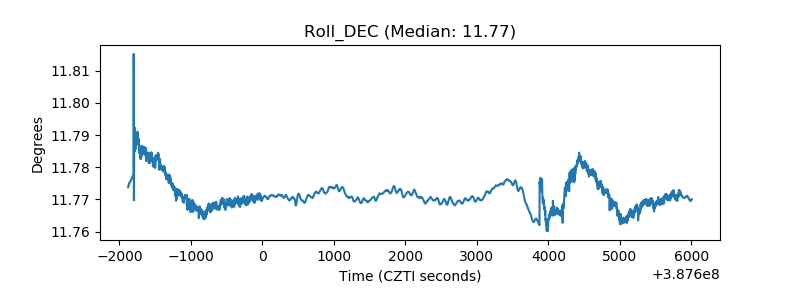 |
| _Roll_RA | 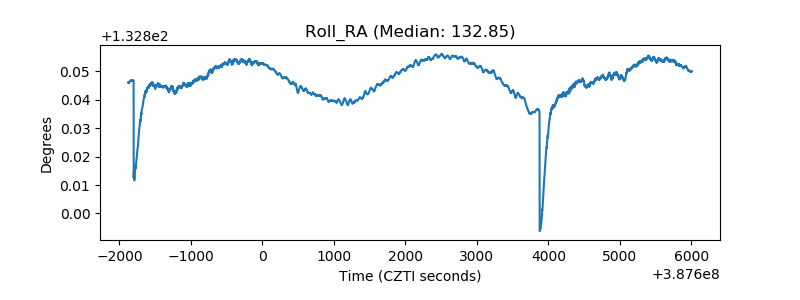 |
| Veto Counter | 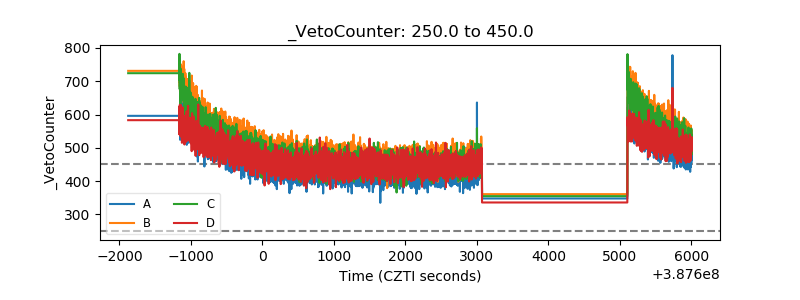 |