| Param | Original file | Final file |
|---|---|---|
| Filename | modeM0/AS1A11_099T01_9000005068_35376cztM0_level2.evt | modeM0/AS1A11_099T01_9000005068_35376cztM0_level2_quad_clean.evt |
| Size (bytes) | 634,222,080 | 46,696,320 |
| Size | 604.8 MB | 44.5 MB |
| Events in quadrant A | 2,772,671 | 291,487 |
| Events in quadrant B | 9,014,176 | 201,794 |
| Events in quadrant C | 3,149,285 | 284,310 |
| Events in quadrant D | 3,917,411 | 269,058 |
| Mode M9 | |||
|---|---|---|---|
| Quadrant | BADHDUFLAG | Total packets | Discarded packets |
| A | 0 | 28 | 0 |
| B | 0 | 28 | 0 |
| C | 0 | 28 | 0 |
| D | 0 | 29 | 0 |
| Mode M0 | |||
|---|---|---|---|
| Quadrant | BADHDUFLAG | Total packets | Discarded packets |
| A | 0 | 11188 | 3 |
| B | 0 | 30321 | 2 |
| C | 0 | 12227 | 2 |
| D | 0 | 15395 | 2 |
| Mode SS | |||
|---|---|---|---|
| Quadrant | BADHDUFLAG | Total packets | Discarded packets |
| A | 0 | 104 | 0 |
| B | 0 | 104 | 0 |
| C | 0 | 104 | 0 |
| D | 0 | 104 | 0 |
| Quadrant | Total seconds | Saturated seconds | Saturation percentage |
|---|---|---|---|
| A | 5230 | 12 | 0.229446% |
| B | 5230 | 2767 | 52.906310% |
| C | 5230 | 152 | 2.906310% |
| D | 5230 | 80 | 1.529637% |
Noise dominated data is calculated using 1-second bins in cleaned event files. If a bin has >2000 counts, and if more than 50% of those come from <1% of pixels, then it is considered to be noise-dominated and hence unusable.
| Quadrant | # 1 sec bins | Bins with >0 counts | Bins with >2000 counts | High rate bins dominated by noise | Noise dominated (total time) | Noise dominated (detector-on time) | Marked lightcurve |
|---|---|---|---|---|---|---|---|
| A | 7142 | 5231 | 4 | 4 | 0.06% | 0.08% | 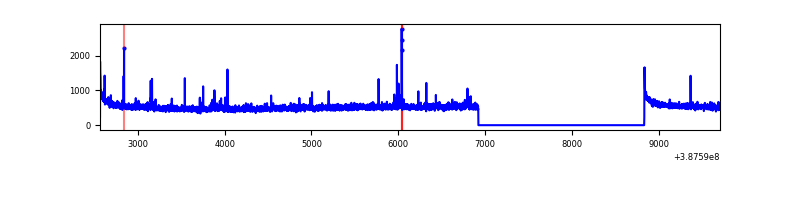 |
| B | 7142 | 5231 | 2320 | 2320 | 32.48% | 44.35% | 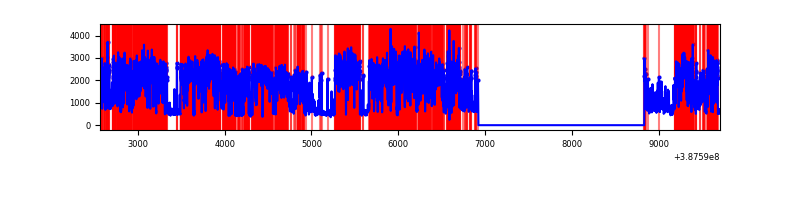 |
| C | 7142 | 5231 | 117 | 117 | 1.64% | 2.24% | 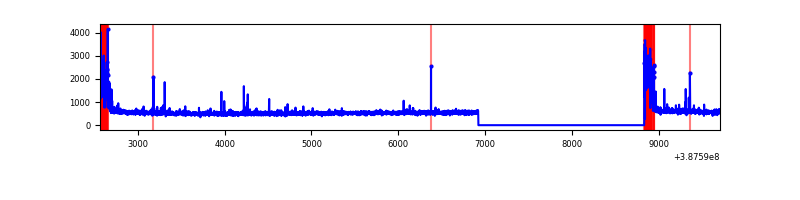 |
| D | 7142 | 5231 | 59 | 59 | 0.83% | 1.13% | 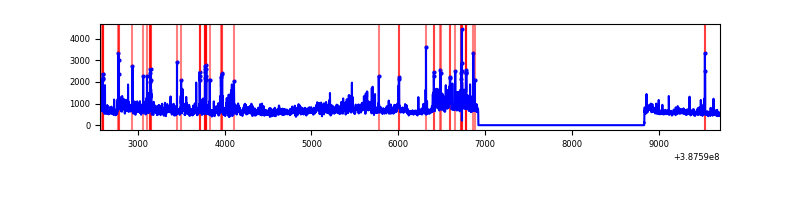 |
Top three noisy pixels from each quadrant. If the there are fewer than three noisy pixels in the level2.evt file, extra rows are filled as -1
| Pixel properties | Quadrant properties | ||||||
|---|---|---|---|---|---|---|---|
| Quadrant | DetID | PixID | Counts | Sigma | Mean | Median | Sigma |
| A | 10 | 83 | 113643 | 849.16 | 664 | 652 | 133.1 |
| A | 14 | 254 | 37366 | 275.92 | 664 | 652 | 133.1 |
| A | 9 | 143 | 35516 | 262.01 | 664 | 652 | 133.1 |
| B | 4 | 251 | 6265761 | 63830.29 | 518 | 507 | 98.2 |
| B | 5 | 200 | 409137 | 4163.11 | 518 | 507 | 98.2 |
| B | 5 | 172 | 162978 | 1655.25 | 518 | 507 | 98.2 |
| C | 0 | 10 | 423579 | 2883.08 | 632 | 638 | 146.7 |
| C | 15 | 214 | 214655 | 1458.9 | 632 | 638 | 146.7 |
| C | 15 | 208 | 26256 | 174.63 | 632 | 638 | 146.7 |
| D | 8 | 195 | 801961 | 5155.55 | 631 | 615 | 155.4 |
| D | 13 | 249 | 197669 | 1267.77 | 631 | 615 | 155.4 |
| D | 2 | 31 | 148345 | 950.44 | 631 | 615 | 155.4 |
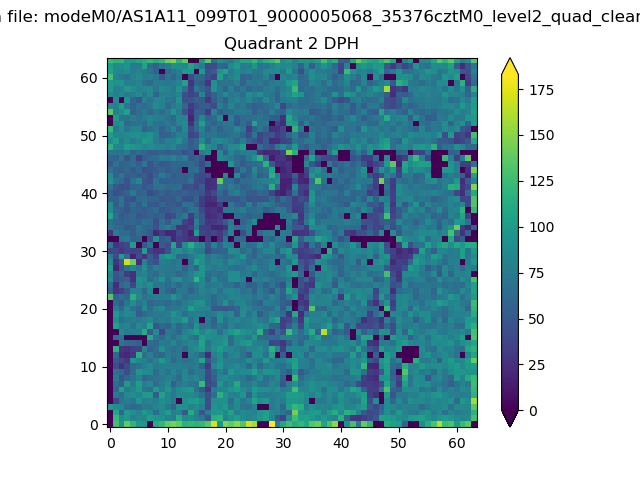
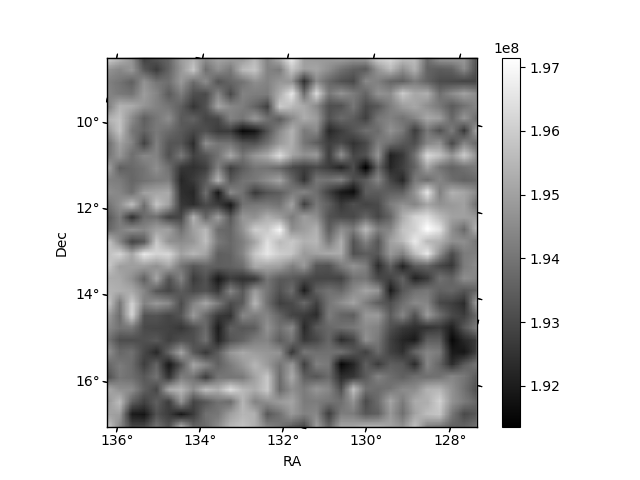
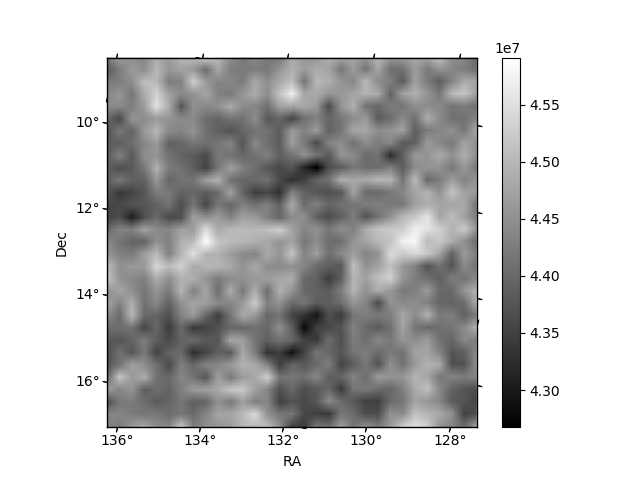
Histogram calculated using DETX and DETY for each event in the final _common_clean file
| Quadrant A | 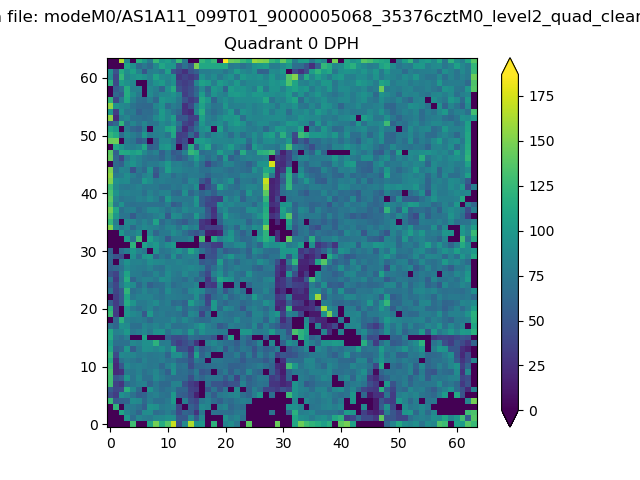 |
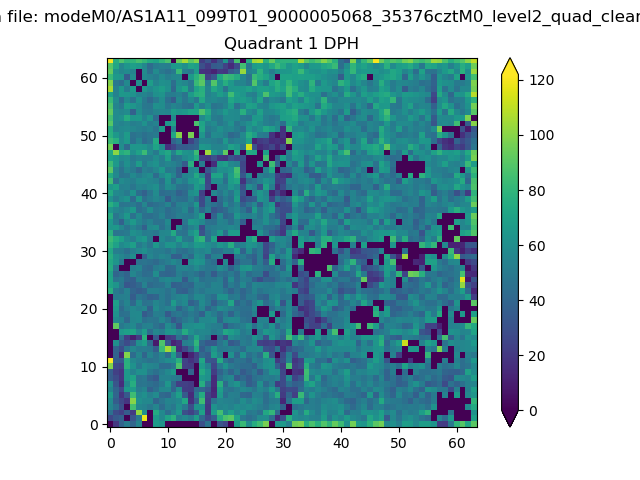 |
Quadrant B |
|---|---|---|---|
| Quadrant D | 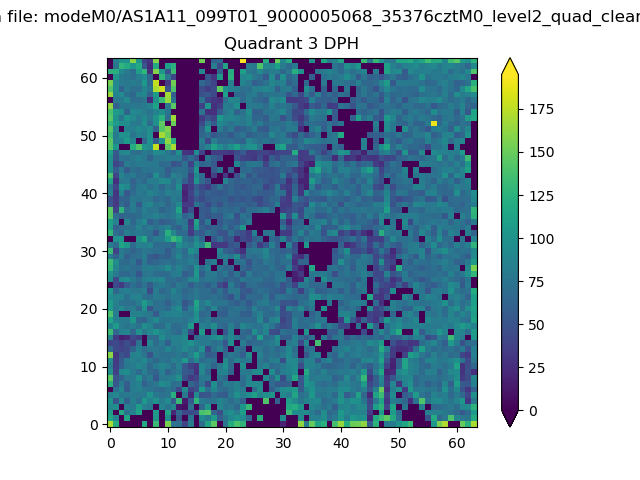 |
 |
Quadrant C |
| Plot type | Count rate plots | Images |
|---|---|---|
| Comparison with Poisson distribution Blue bars denote a histogram of data divided into 1 sec bins. Red curve is a Poisson curve with rate = median count rate of data. |
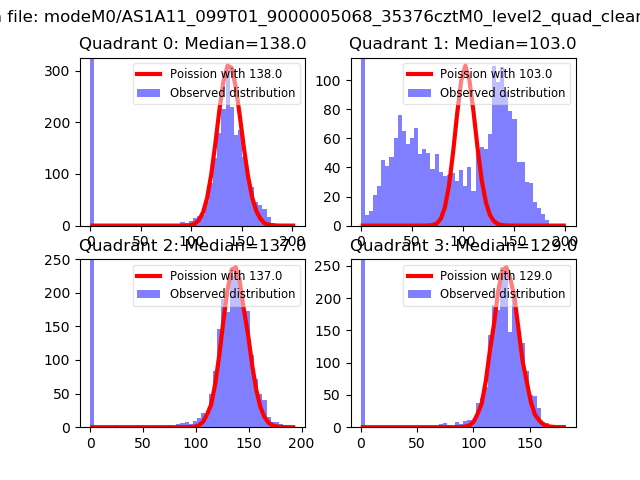 |
 |
| Quadrant-wise count rates Data is divided into 100 sec bins |
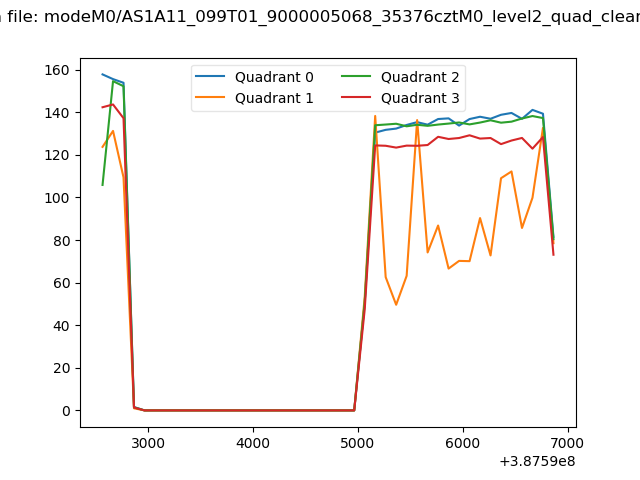 |
|
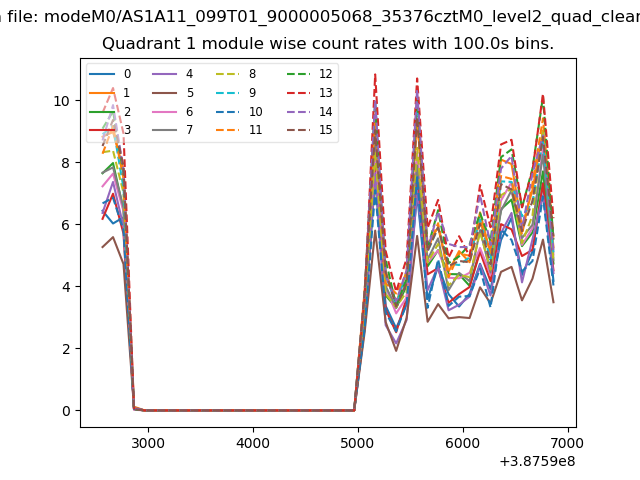
| Module-wise count rates for Quadrant A Data is divided into 100 sec bins |
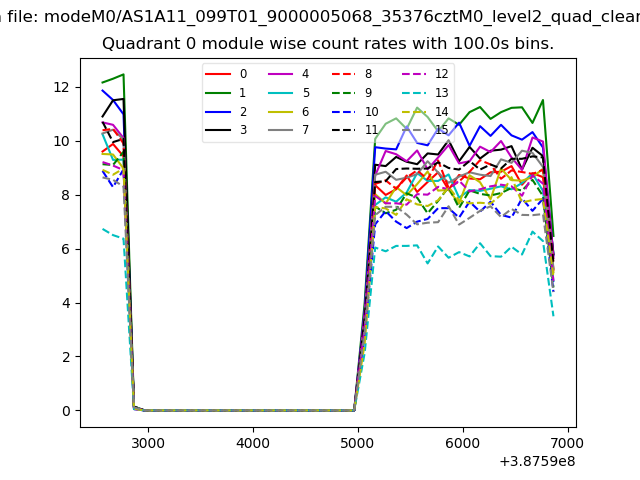 |
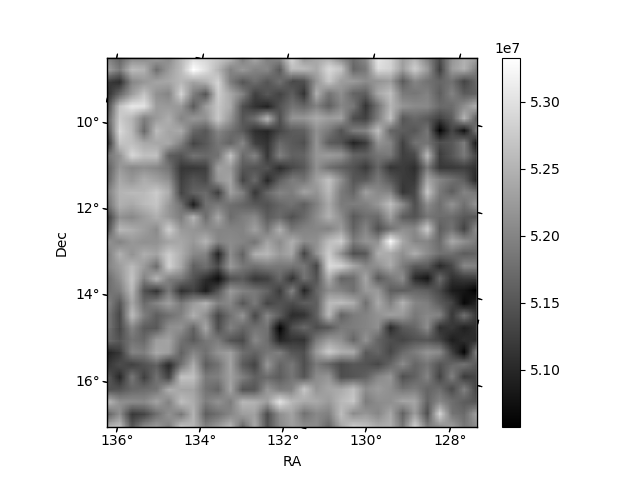 |
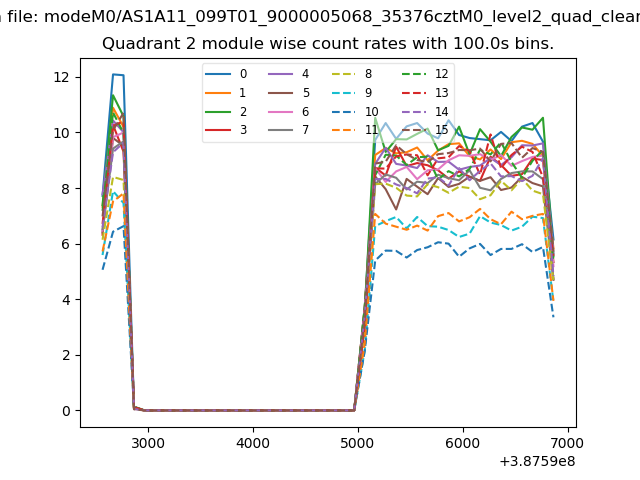
| Module-wise count rates for Quadrant B Data is divided into 100 sec bins |
 |
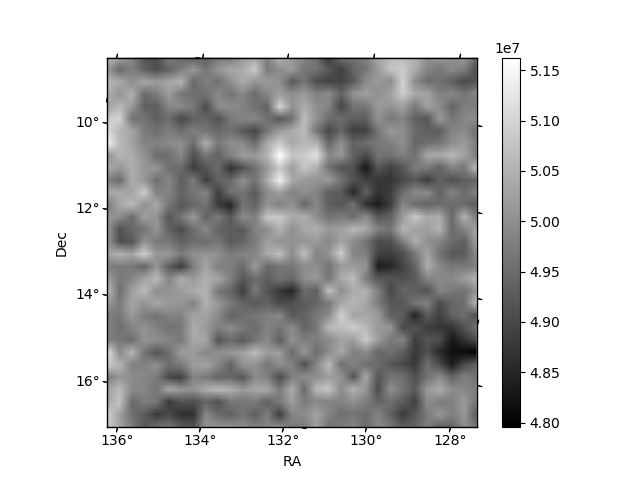 |
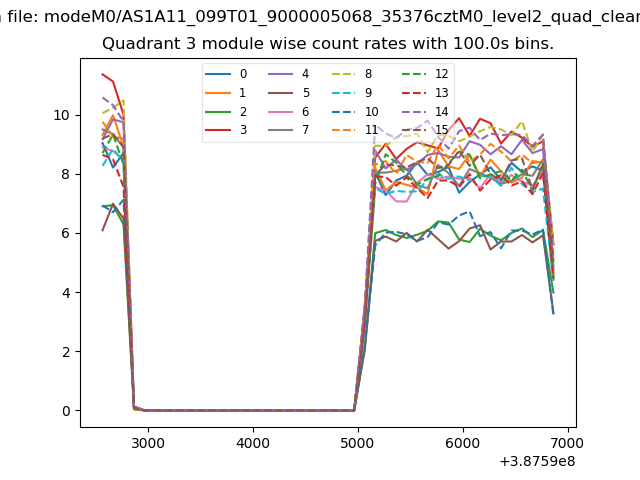
| Module-wise count rates for Quadrant C Data is divided into 100 sec bins |
 |
 |
| Module-wise count rates for Quadrant D Data is divided into 100 sec bins |
 |
 |
| Parameter | Plot |
|---|---|
| CZT HV Monitor |  |
| D_VDD | 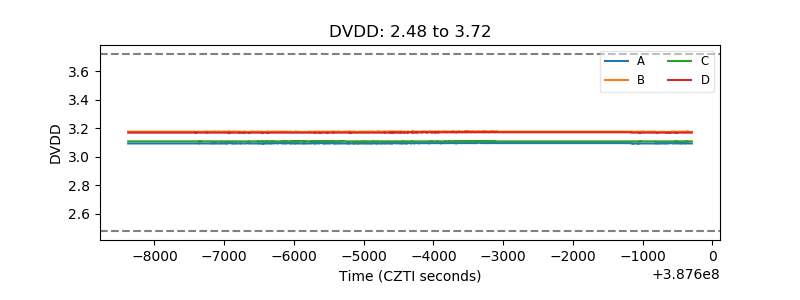 |
| Temperature 1 | 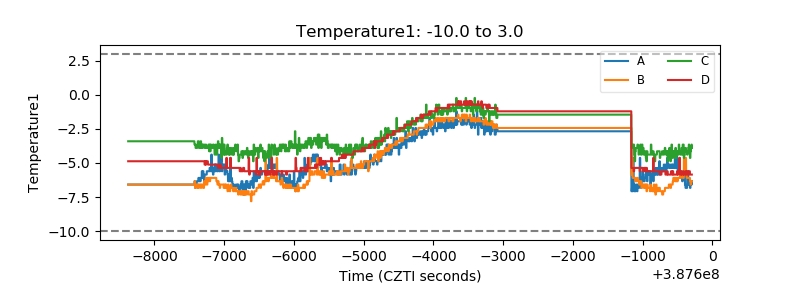 |
| Veto HV Monitor | 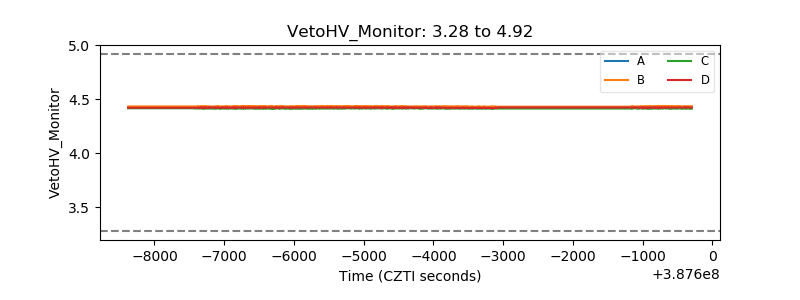 |
| Veto LLD | 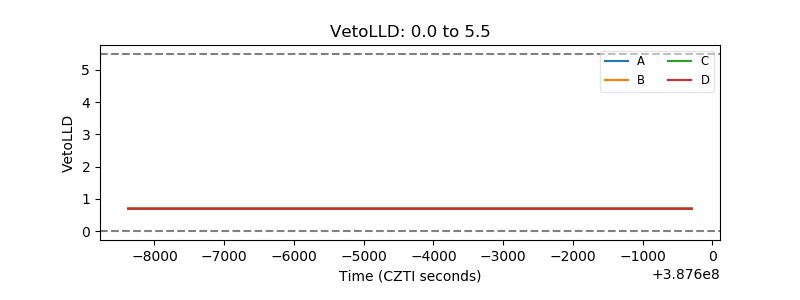 |
| Alpha Counter | 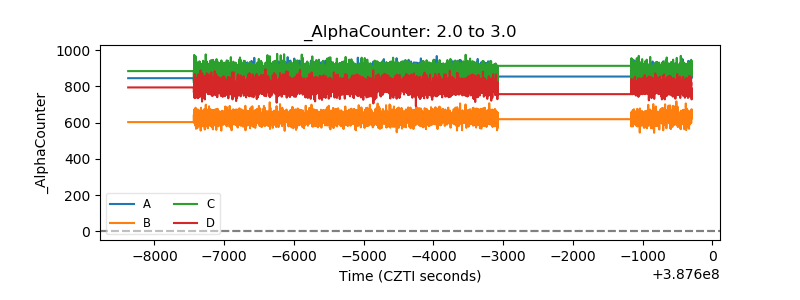 |
| _CPM_Rate | 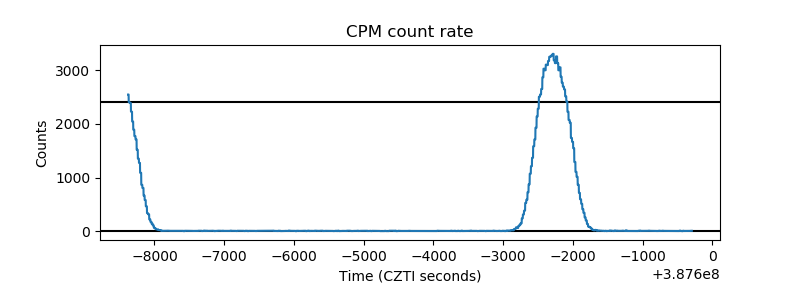 |
| CZT Counter | 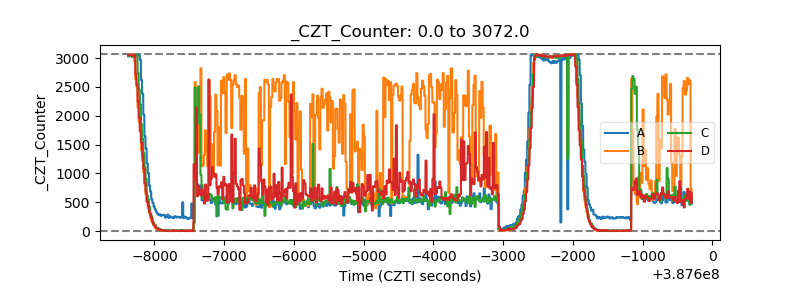 |
| +2.5 Volts monitor | 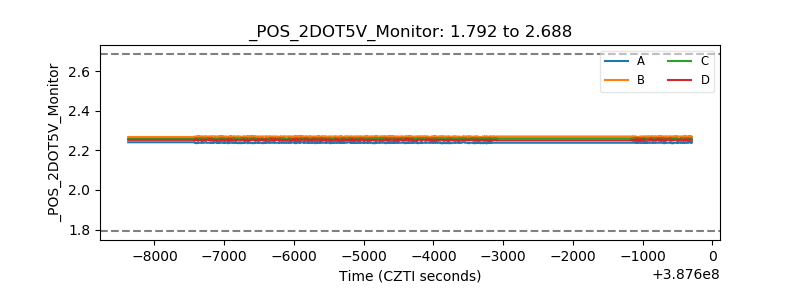 |
| +5 Volts monitor | 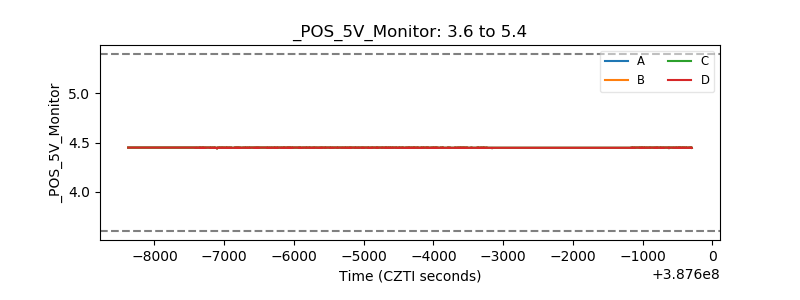 |
| _ROLL_ROT | 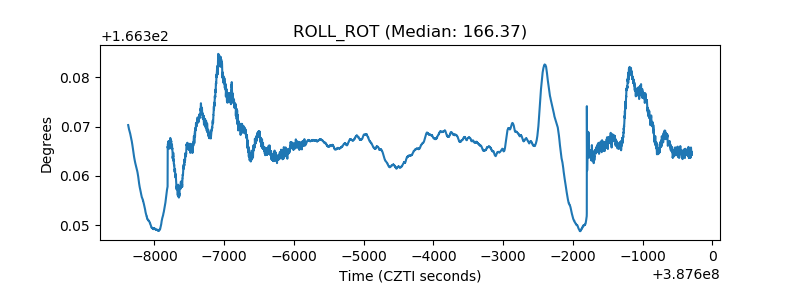 |
| _Roll_DEC | 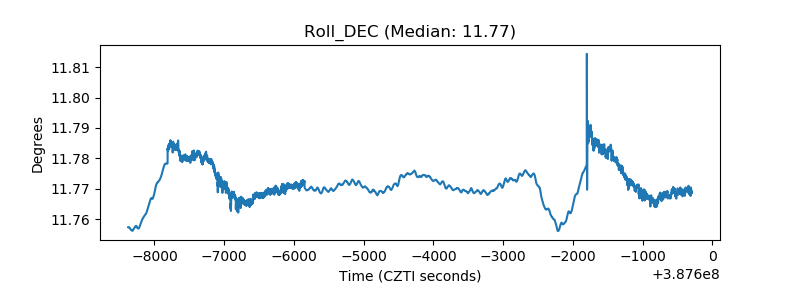 |
| _Roll_RA |  |
| Veto Counter | 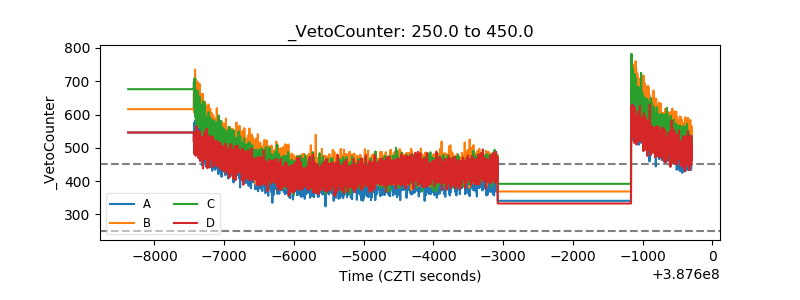 |