| Param | Original file | Final file |
|---|---|---|
| Filename | modeM0/AS1A11_099T01_9000005068_35375cztM0_level2.evt | modeM0/AS1A11_099T01_9000005068_35375cztM0_level2_quad_clean.evt |
| Size (bytes) | 543,911,040 | 57,401,280 |
| Size | 518.7 MB | 54.7 MB |
| Events in quadrant A | 2,785,041 | 360,742 |
| Events in quadrant B | 5,548,425 | 329,331 |
| Events in quadrant C | 3,250,257 | 343,041 |
| Events in quadrant D | 4,516,674 | 320,065 |
| Mode M9 | |||
|---|---|---|---|
| Quadrant | BADHDUFLAG | Total packets | Discarded packets |
| A | 0 | 35 | 0 |
| B | 0 | 35 | 0 |
| C | 0 | 35 | 0 |
| D | 0 | 35 | 0 |
| Mode M0 | |||
|---|---|---|---|
| Quadrant | BADHDUFLAG | Total packets | Discarded packets |
| A | 0 | 11587 | 3 |
| B | 0 | 20139 | 2 |
| C | 0 | 12795 | 2 |
| D | 0 | 17161 | 2 |
| Mode SS | |||
|---|---|---|---|
| Quadrant | BADHDUFLAG | Total packets | Discarded packets |
| A | 0 | 114 | 0 |
| B | 0 | 114 | 0 |
| C | 0 | 114 | 0 |
| D | 0 | 114 | 0 |
| Quadrant | Total seconds | Saturated seconds | Saturation percentage |
|---|---|---|---|
| A | 5489 | 9 | 0.163964% |
| B | 5489 | 1037 | 18.892330% |
| C | 5489 | 163 | 2.969576% |
| D | 5489 | 346 | 6.303516% |
Noise dominated data is calculated using 1-second bins in cleaned event files. If a bin has >2000 counts, and if more than 50% of those come from <1% of pixels, then it is considered to be noise-dominated and hence unusable.
| Quadrant | # 1 sec bins | Bins with >0 counts | Bins with >2000 counts | High rate bins dominated by noise | Noise dominated (total time) | Noise dominated (detector-on time) | Marked lightcurve |
|---|---|---|---|---|---|---|---|
| A | 8982 | 5491 | 2 | 2 | 0.02% | 0.04% | 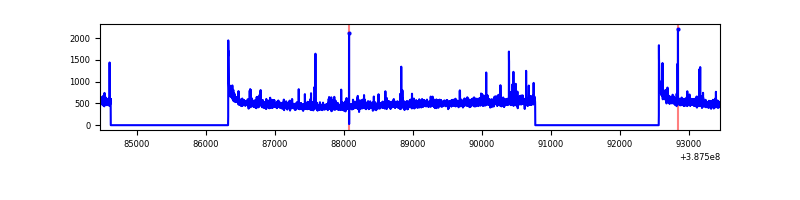 |
| B | 8982 | 5491 | 832 | 832 | 9.26% | 15.15% | 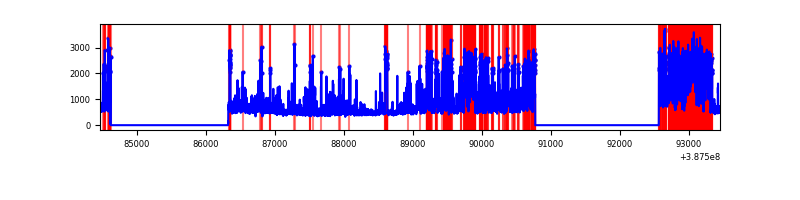 |
| C | 8982 | 5491 | 124 | 124 | 1.38% | 2.26% | 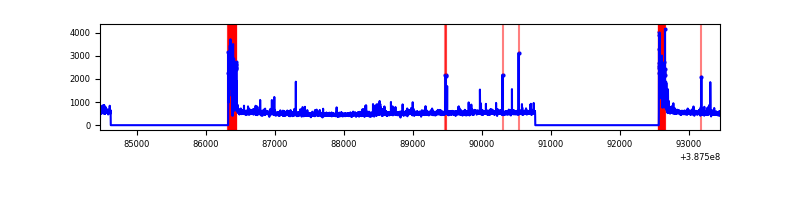 |
| D | 8982 | 5491 | 267 | 267 | 2.97% | 4.86% | 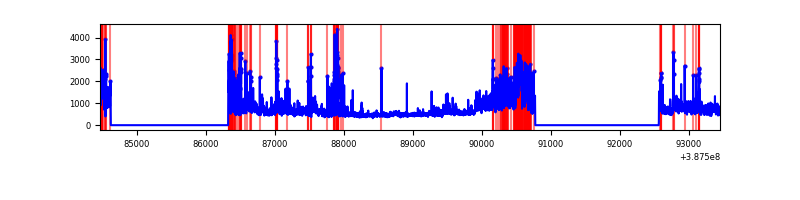 |
Top three noisy pixels from each quadrant. If the there are fewer than three noisy pixels in the level2.evt file, extra rows are filled as -1
| Pixel properties | Quadrant properties | ||||||
|---|---|---|---|---|---|---|---|
| Quadrant | DetID | PixID | Counts | Sigma | Mean | Median | Sigma |
| A | 10 | 83 | 117168 | 863.03 | 668 | 656 | 135.0 |
| A | 14 | 254 | 36740 | 267.28 | 668 | 656 | 135.0 |
| A | 9 | 143 | 24443 | 176.19 | 668 | 656 | 135.0 |
| B | 4 | 251 | 2419752 | 20596.22 | 614 | 599 | 117.5 |
| B | 5 | 172 | 376045 | 3196.48 | 614 | 599 | 117.5 |
| B | 5 | 200 | 200335 | 1700.52 | 614 | 599 | 117.5 |
| C | 0 | 10 | 462758 | 3090.7 | 638 | 642 | 149.5 |
| C | 15 | 214 | 223816 | 1492.62 | 638 | 642 | 149.5 |
| C | 3 | 233 | 48832 | 322.3 | 638 | 642 | 149.5 |
| D | 8 | 195 | 988940 | 6410.9 | 627 | 610 | 154.2 |
| D | 12 | 233 | 412062 | 2668.92 | 627 | 610 | 154.2 |
| D | 13 | 249 | 275144 | 1780.79 | 627 | 610 | 154.2 |
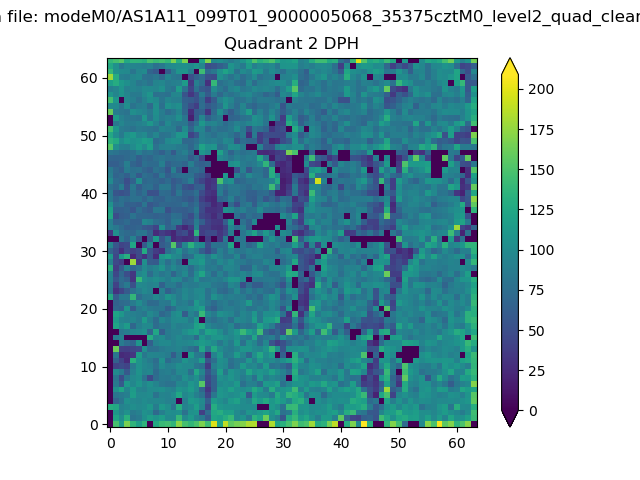
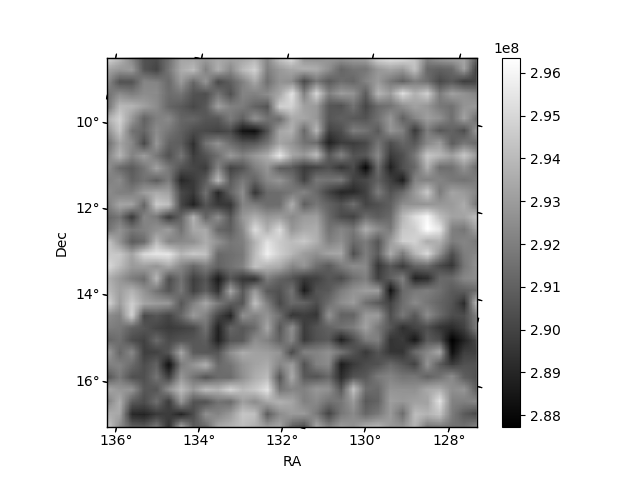
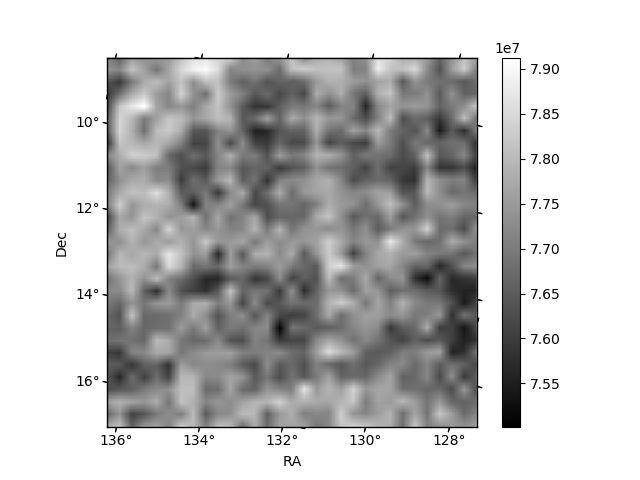
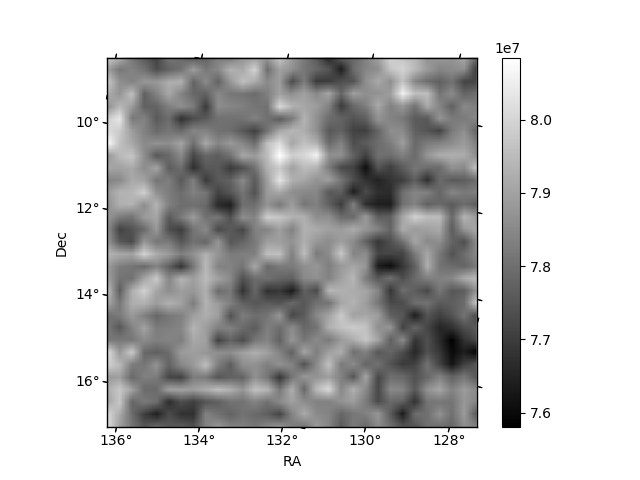
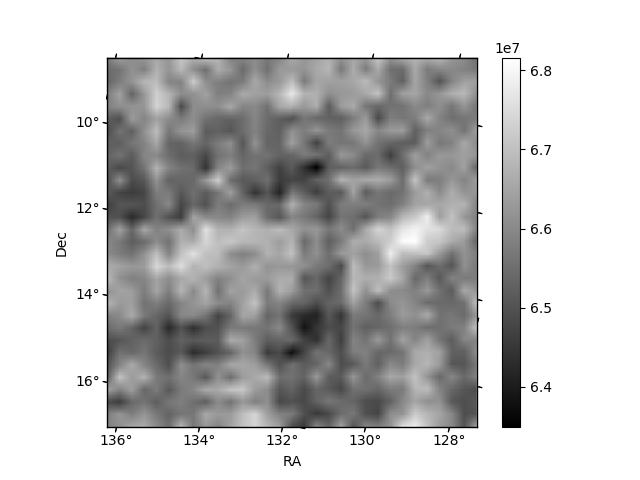
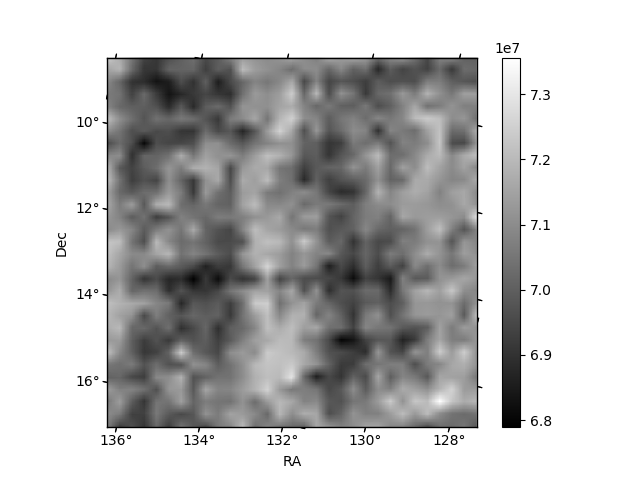
Histogram calculated using DETX and DETY for each event in the final _common_clean file
| Quadrant A | 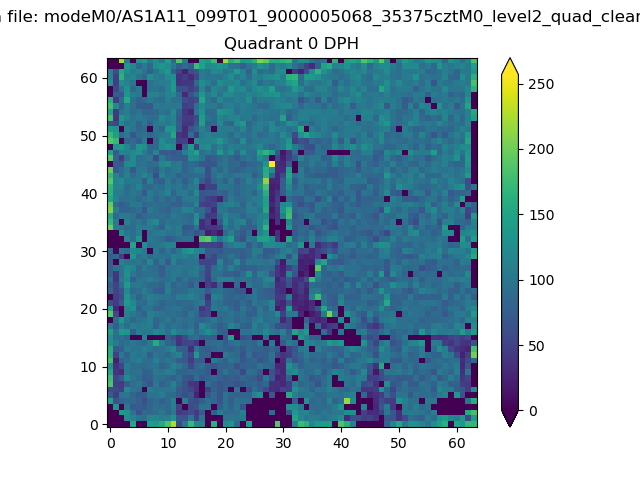 |
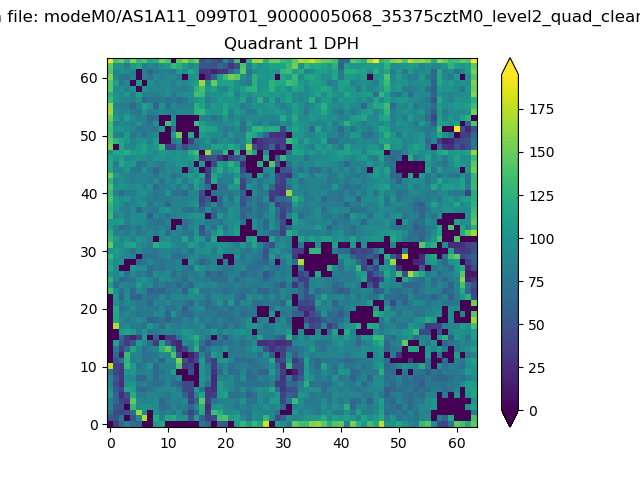 |
Quadrant B |
|---|---|---|---|
| Quadrant D | 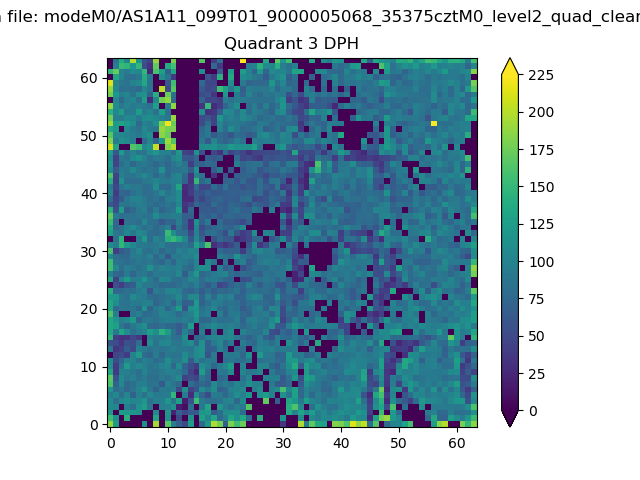 |
 |
Quadrant C |
| Plot type | Count rate plots | Images |
|---|---|---|
| Comparison with Poisson distribution Blue bars denote a histogram of data divided into 1 sec bins. Red curve is a Poisson curve with rate = median count rate of data. |
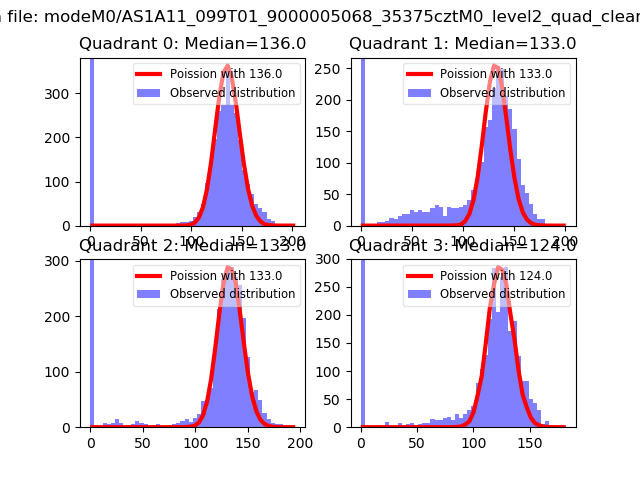 |
 |
| Quadrant-wise count rates Data is divided into 100 sec bins |
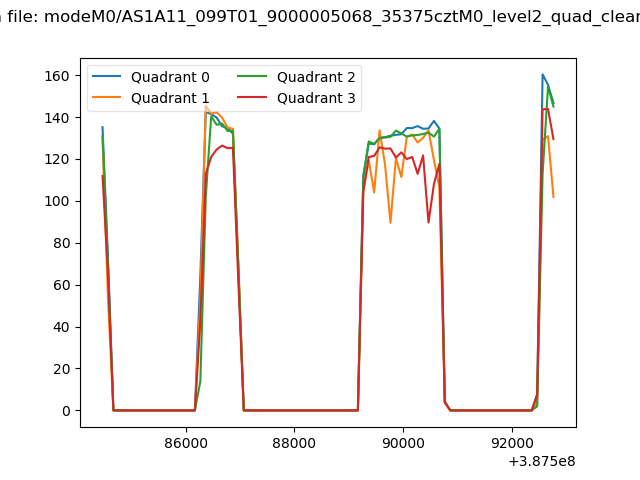 |
|
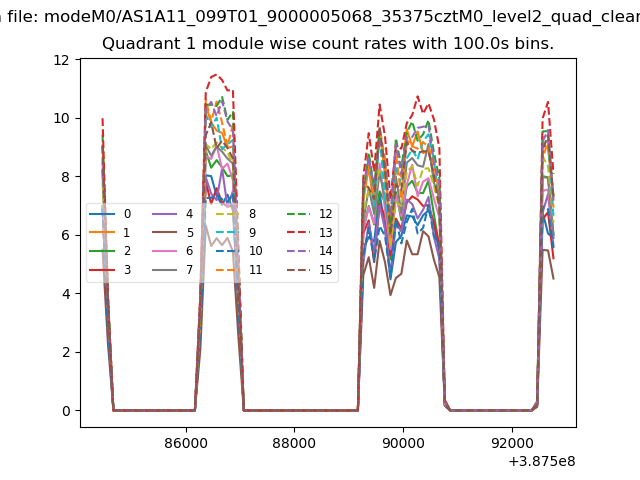
| Module-wise count rates for Quadrant A Data is divided into 100 sec bins |
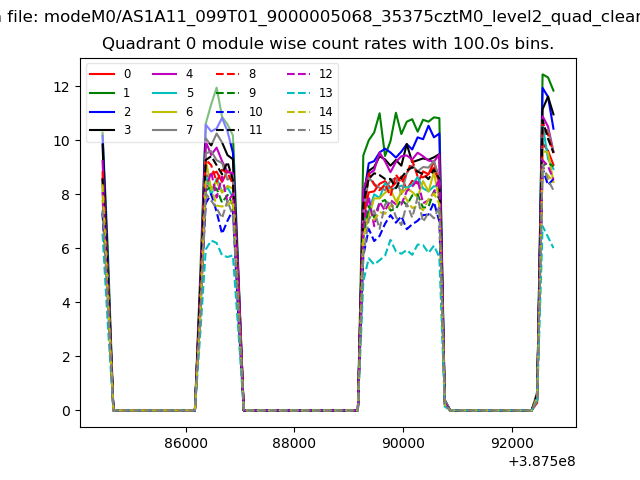 |
 |
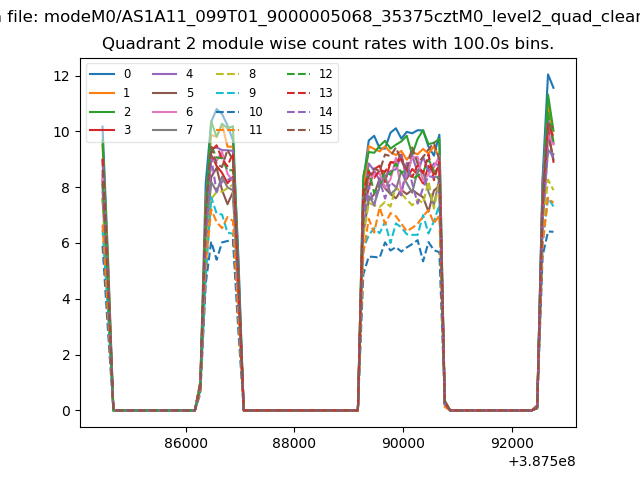
| Module-wise count rates for Quadrant B Data is divided into 100 sec bins |
 |
 |
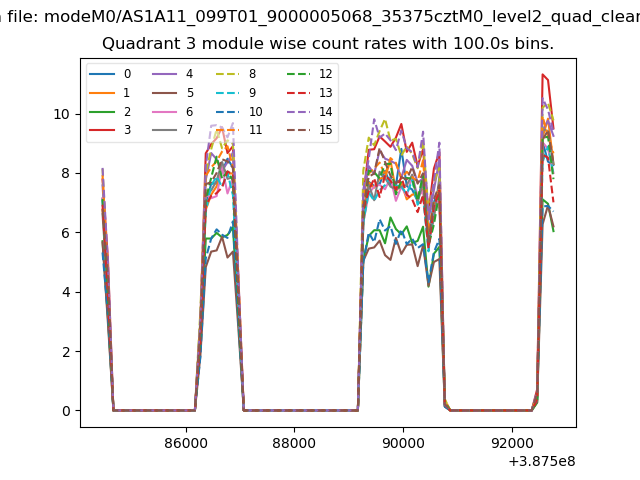
| Module-wise count rates for Quadrant C Data is divided into 100 sec bins |
 |
 |
| Module-wise count rates for Quadrant D Data is divided into 100 sec bins |
 |
 |
| Parameter | Plot |
|---|---|
| CZT HV Monitor | 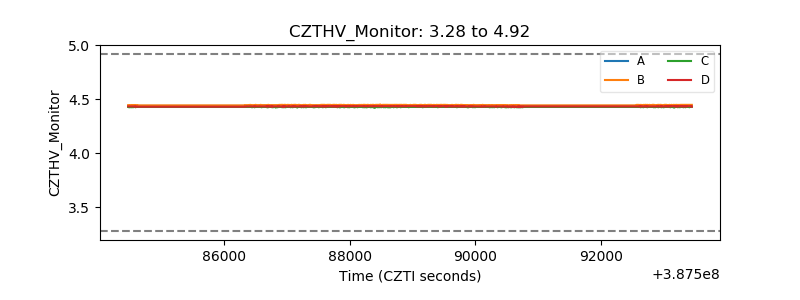 |
| D_VDD | 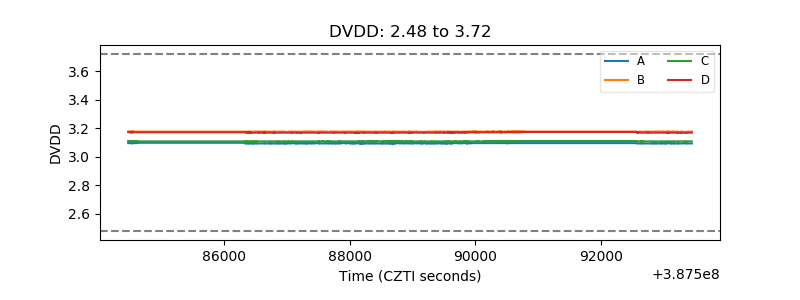 |
| Temperature 1 | 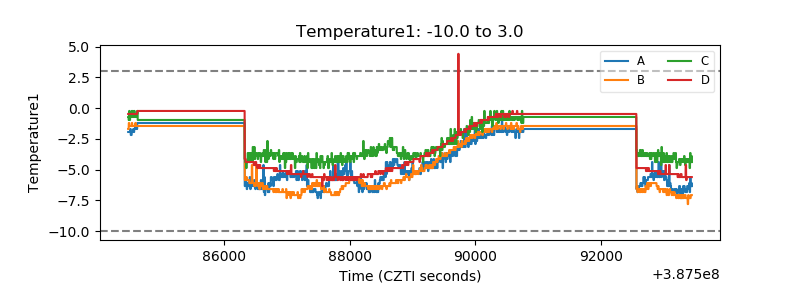 |
| Veto HV Monitor | 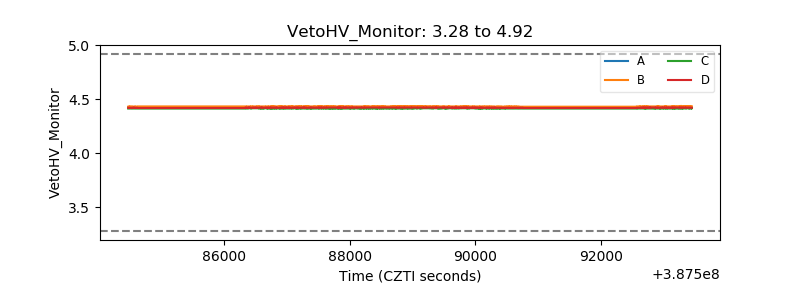 |
| Veto LLD | 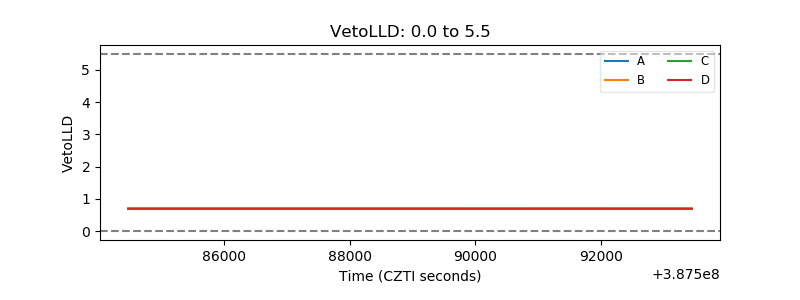 |
| Alpha Counter | 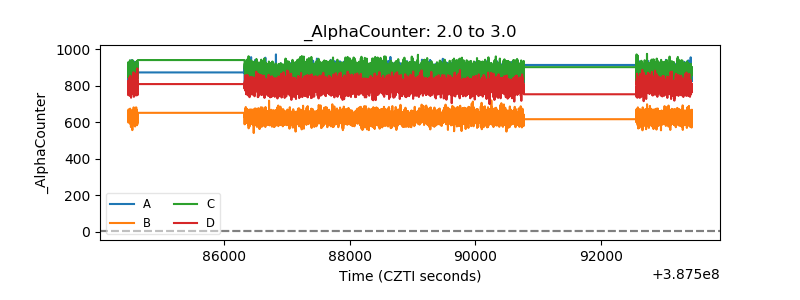 |
| _CPM_Rate | 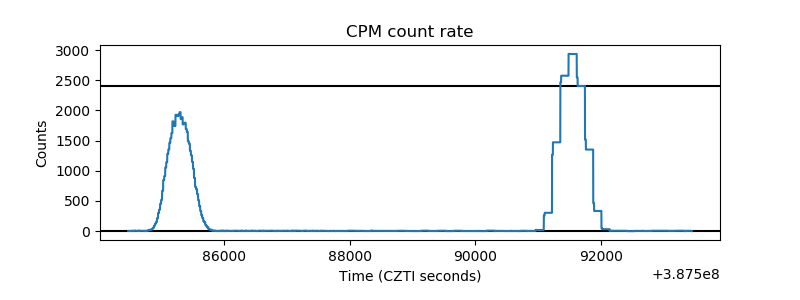 |
| CZT Counter | 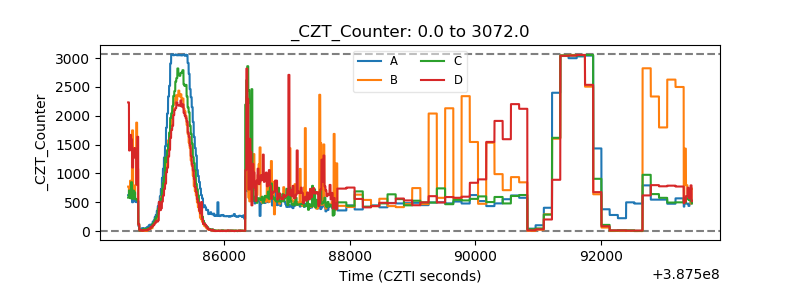 |
| +2.5 Volts monitor | 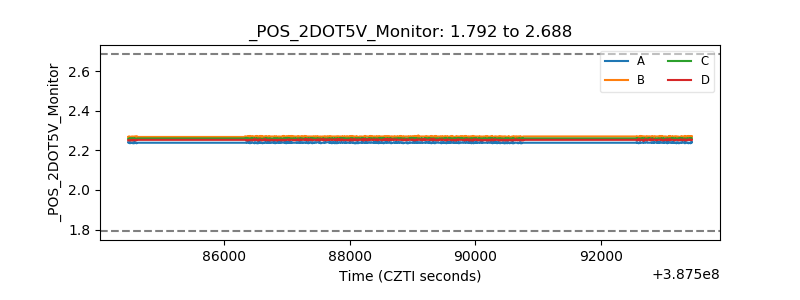 |
| +5 Volts monitor | 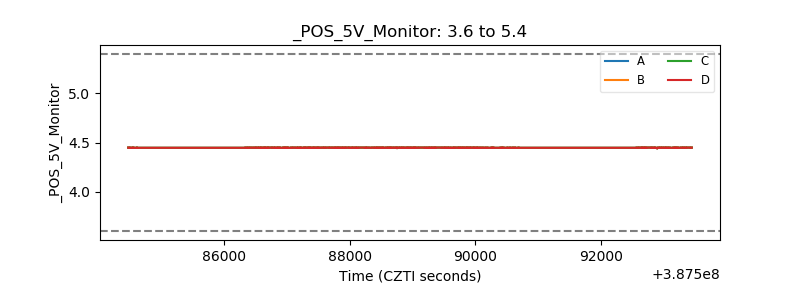 |
| _ROLL_ROT | 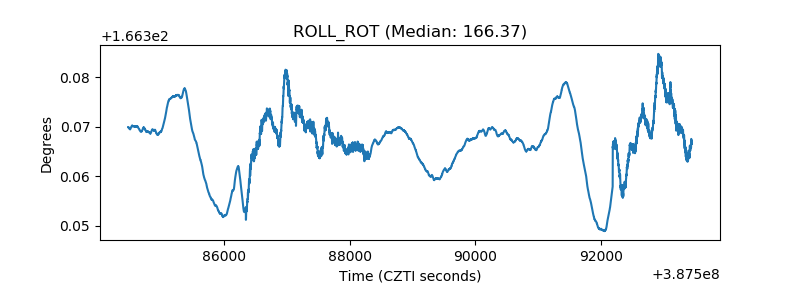 |
| _Roll_DEC | 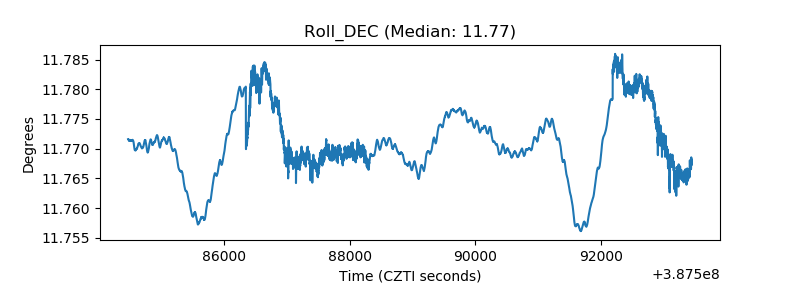 |
| _Roll_RA | 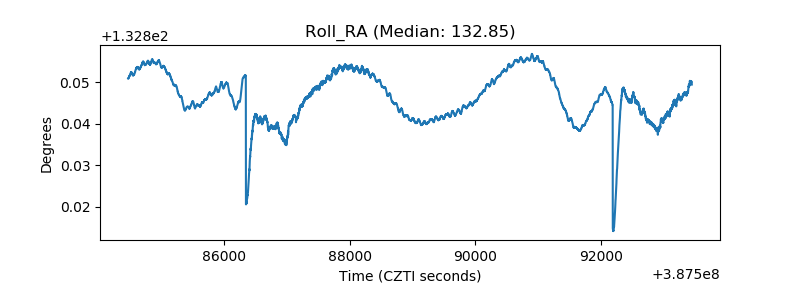 |
| Veto Counter | 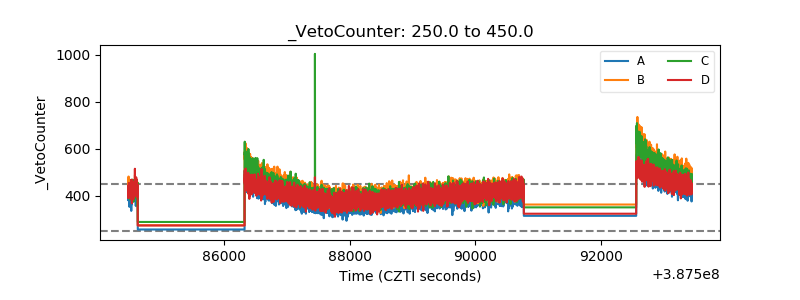 |