| Param | Original file | Final file |
|---|---|---|
| Filename | modeM0/AS1A11_099T01_9000005068_35373cztM0_level2.evt | modeM0/AS1A11_099T01_9000005068_35373cztM0_level2_quad_clean.evt |
| Size (bytes) | 554,497,920 | 62,156,160 |
| Size | 528.8 MB | 59.3 MB |
| Events in quadrant A | 2,646,729 | 393,615 |
| Events in quadrant B | 5,655,904 | 375,892 |
| Events in quadrant C | 3,142,116 | 380,240 |
| Events in quadrant D | 4,980,736 | 351,938 |
| Mode M9 | |||
|---|---|---|---|
| Quadrant | BADHDUFLAG | Total packets | Discarded packets |
| A | 0 | 31 | 0 |
| B | 0 | 31 | 0 |
| C | 0 | 31 | 0 |
| D | 0 | 32 | 0 |
| Mode M0 | |||
|---|---|---|---|
| Quadrant | BADHDUFLAG | Total packets | Discarded packets |
| A | 0 | 11298 | 3 |
| B | 0 | 20471 | 2 |
| C | 0 | 12556 | 2 |
| D | 0 | 18502 | 2 |
| Mode SS | |||
|---|---|---|---|
| Quadrant | BADHDUFLAG | Total packets | Discarded packets |
| A | 0 | 110 | 0 |
| B | 0 | 110 | 0 |
| C | 0 | 110 | 0 |
| D | 0 | 110 | 0 |
| Quadrant | Total seconds | Saturated seconds | Saturation percentage |
|---|---|---|---|
| A | 5428 | 5 | 0.092115% |
| B | 5428 | 968 | 17.833456% |
| C | 5428 | 160 | 2.947679% |
| D | 5428 | 337 | 6.208548% |
Noise dominated data is calculated using 1-second bins in cleaned event files. If a bin has >2000 counts, and if more than 50% of those come from <1% of pixels, then it is considered to be noise-dominated and hence unusable.
| Quadrant | # 1 sec bins | Bins with >0 counts | Bins with >2000 counts | High rate bins dominated by noise | Noise dominated (total time) | Noise dominated (detector-on time) | Marked lightcurve |
|---|---|---|---|---|---|---|---|
| A | 7130 | 5429 | 1 | 1 | 0.01% | 0.02% | 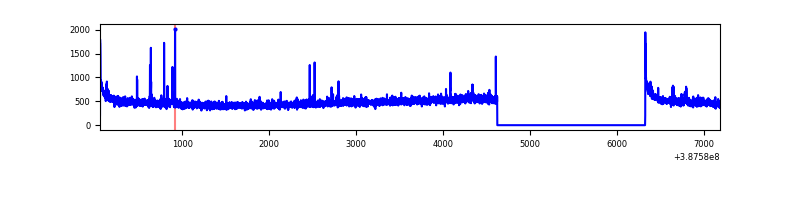 |
| B | 7130 | 5429 | 798 | 798 | 11.19% | 14.70% | 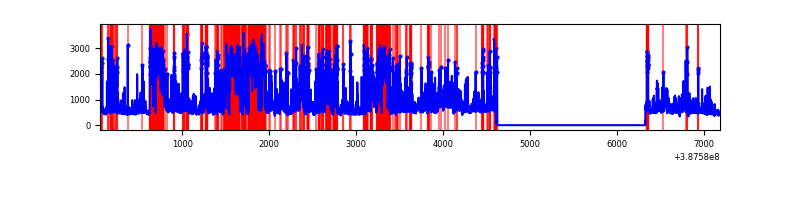 |
| C | 7130 | 5429 | 123 | 123 | 1.73% | 2.27% | 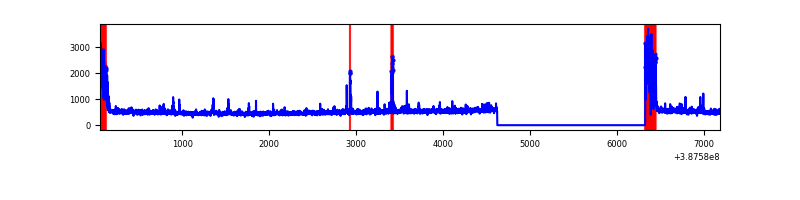 |
| D | 7130 | 5429 | 229 | 229 | 3.21% | 4.22% | 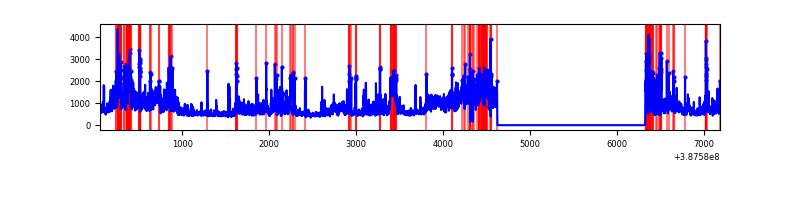 |
Top three noisy pixels from each quadrant. If the there are fewer than three noisy pixels in the level2.evt file, extra rows are filled as -1
| Pixel properties | Quadrant properties | ||||||
|---|---|---|---|---|---|---|---|
| Quadrant | DetID | PixID | Counts | Sigma | Mean | Median | Sigma |
| A | 10 | 83 | 117043 | 893.95 | 638 | 626 | 130.2 |
| A | 9 | 143 | 20752 | 154.55 | 638 | 626 | 130.2 |
| A | 14 | 254 | 15498 | 114.2 | 638 | 626 | 130.2 |
| B | 4 | 251 | 2659709 | 23077.19 | 590 | 573 | 115.2 |
| B | 5 | 172 | 475873 | 4124.87 | 590 | 573 | 115.2 |
| B | 5 | 200 | 60048 | 516.15 | 590 | 573 | 115.2 |
| C | 0 | 10 | 392732 | 2710.07 | 612 | 616 | 144.7 |
| C | 15 | 214 | 223168 | 1538.14 | 612 | 616 | 144.7 |
| C | 3 | 233 | 118460 | 814.47 | 612 | 616 | 144.7 |
| D | 8 | 195 | 1523778 | 10319.06 | 602 | 585 | 147.6 |
| D | 2 | 152 | 291545 | 1971.15 | 602 | 585 | 147.6 |
| D | 13 | 249 | 251561 | 1700.27 | 602 | 585 | 147.6 |
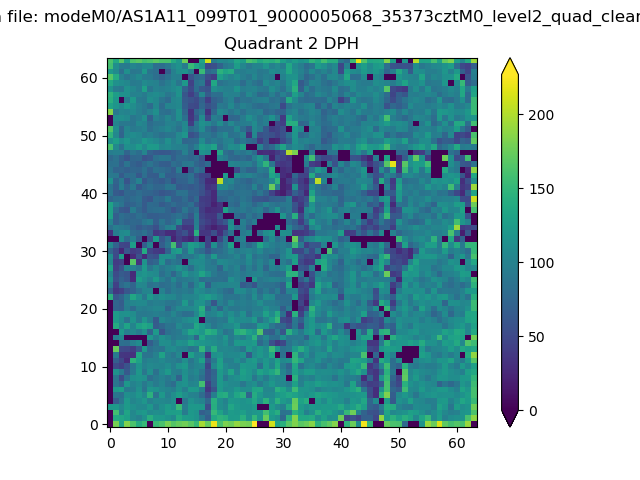
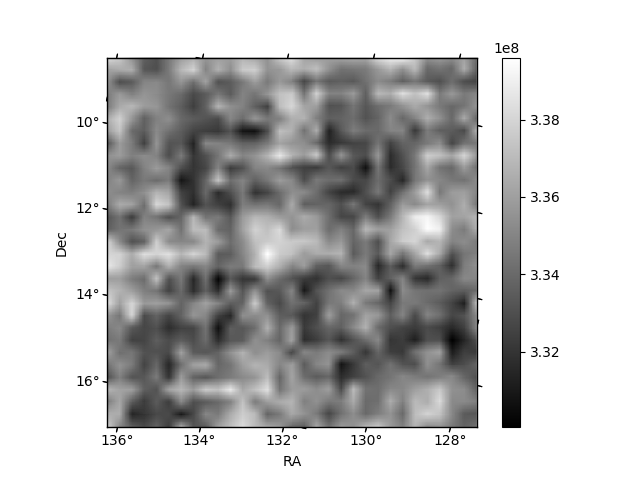
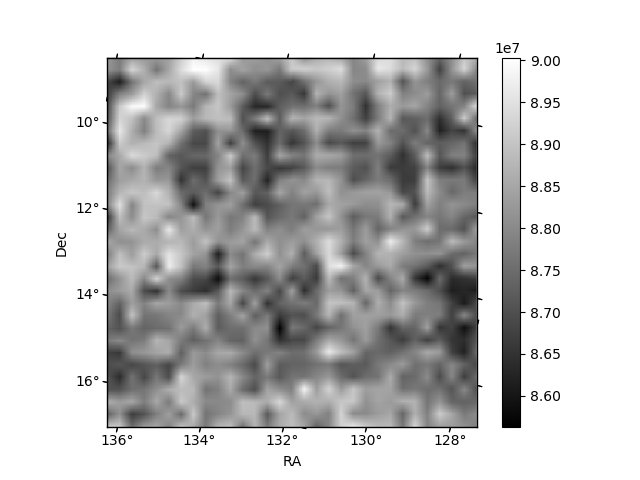
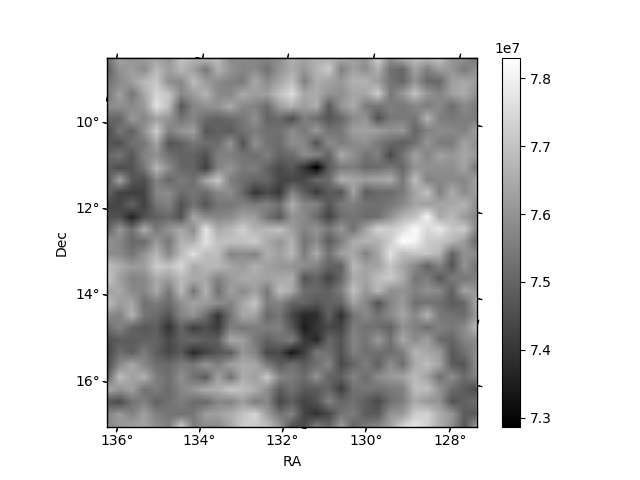
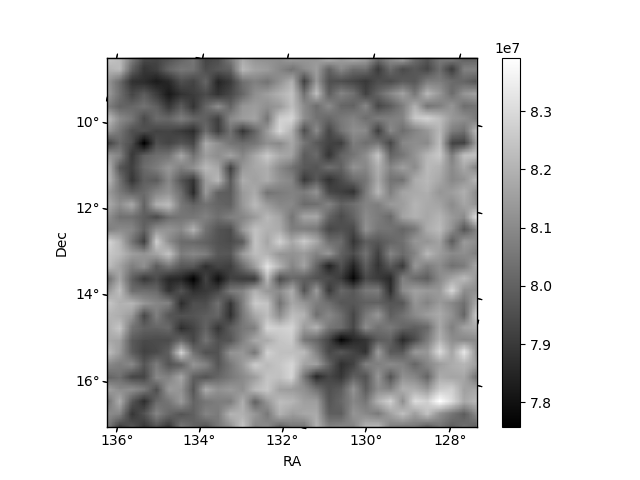
Histogram calculated using DETX and DETY for each event in the final _common_clean file
| Quadrant A | 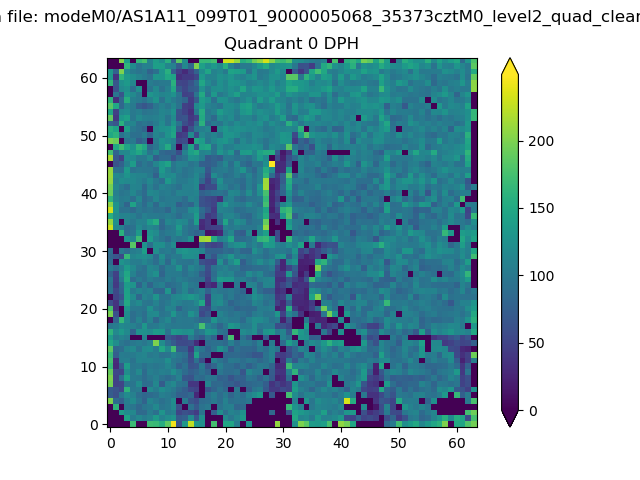 |
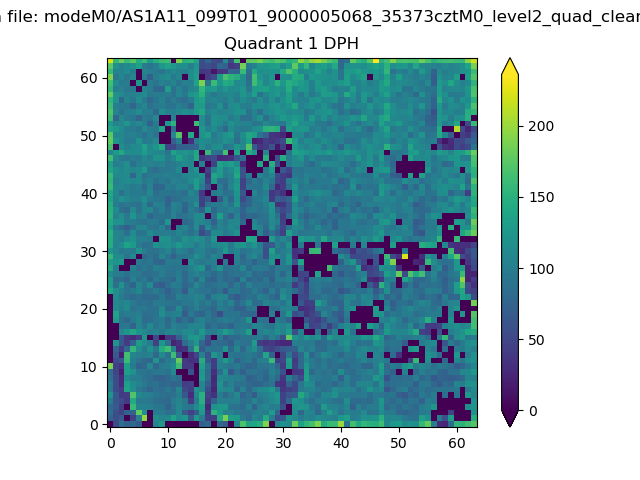 |
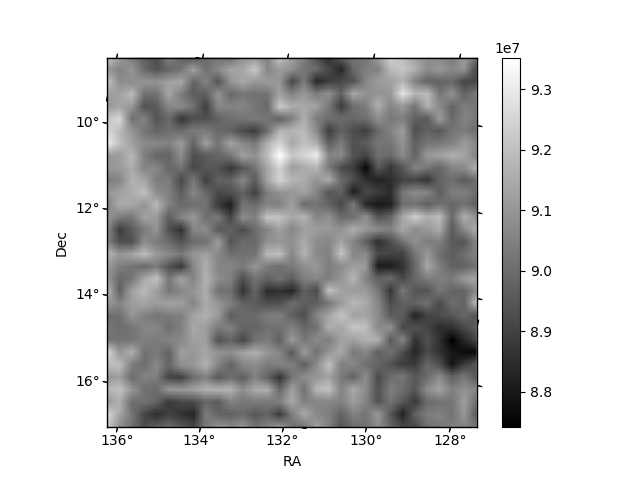
Quadrant B |
|---|---|---|---|
| Quadrant D | 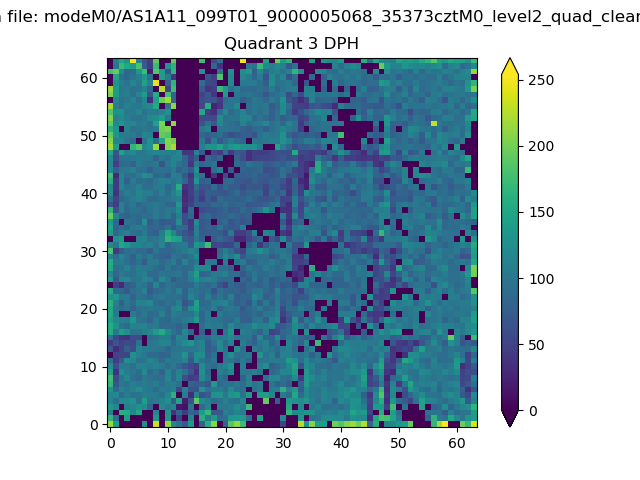 |
 |
Quadrant C |
| Plot type | Count rate plots | Images |
|---|---|---|
| Comparison with Poisson distribution Blue bars denote a histogram of data divided into 1 sec bins. Red curve is a Poisson curve with rate = median count rate of data. |
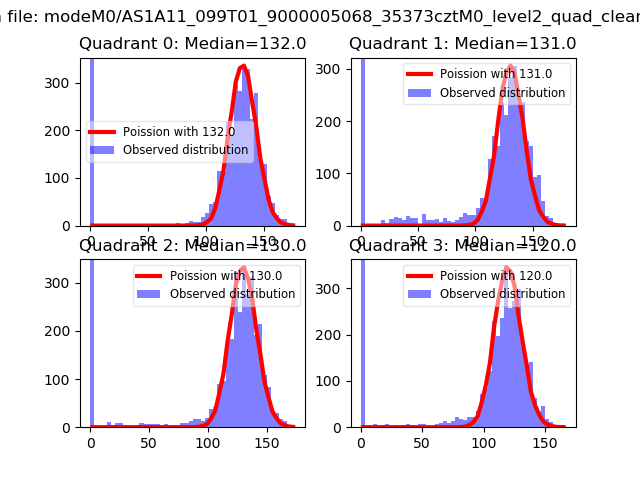 |
 |
| Quadrant-wise count rates Data is divided into 100 sec bins |
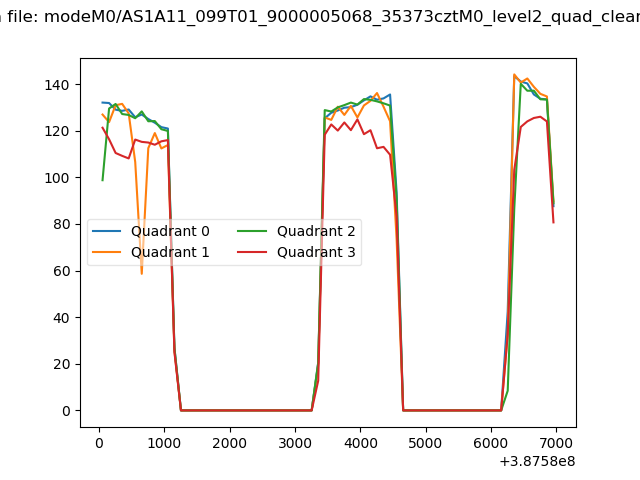 |
|
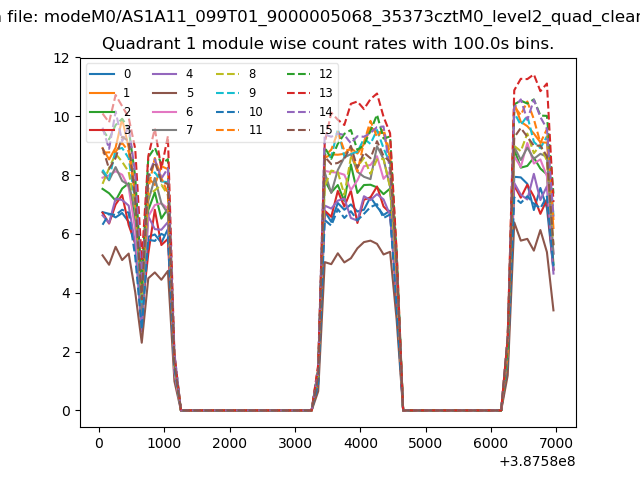
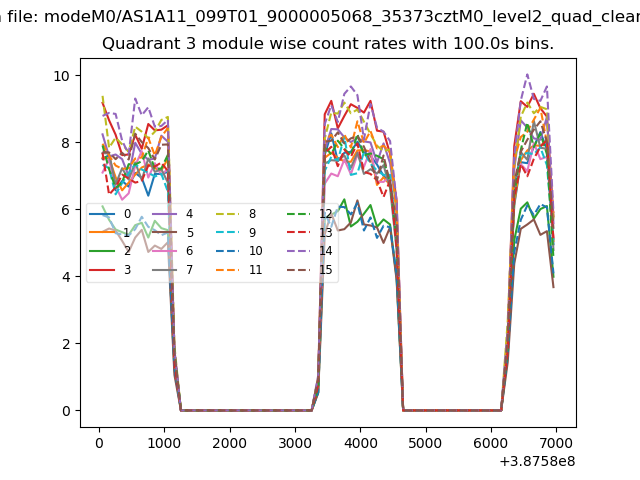
| Module-wise count rates for Quadrant A Data is divided into 100 sec bins |
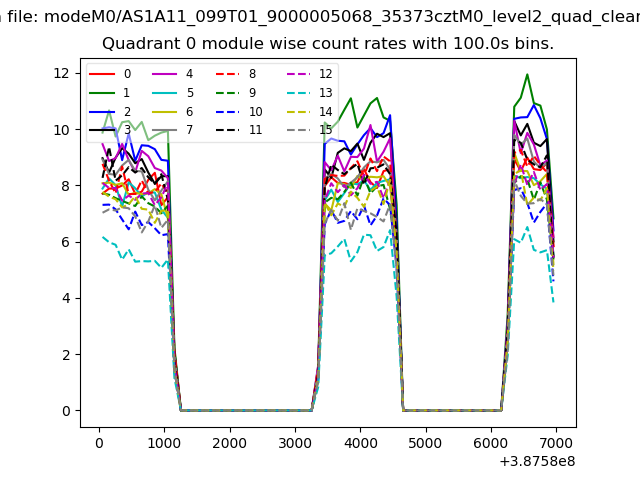 |
 |
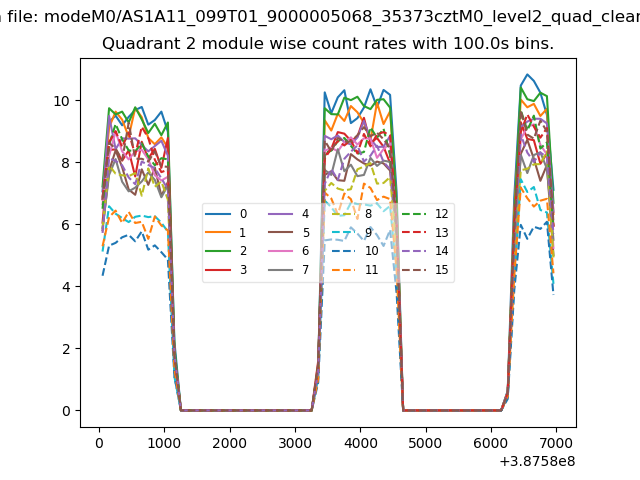
| Module-wise count rates for Quadrant B Data is divided into 100 sec bins |
 |
 |
| Module-wise count rates for Quadrant C Data is divided into 100 sec bins |
 |
 |
| Module-wise count rates for Quadrant D Data is divided into 100 sec bins |
 |
 |
| Parameter | Plot |
|---|---|
| CZT HV Monitor | 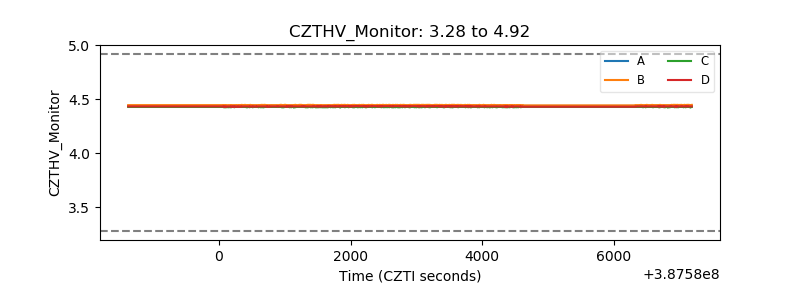 |
| D_VDD | 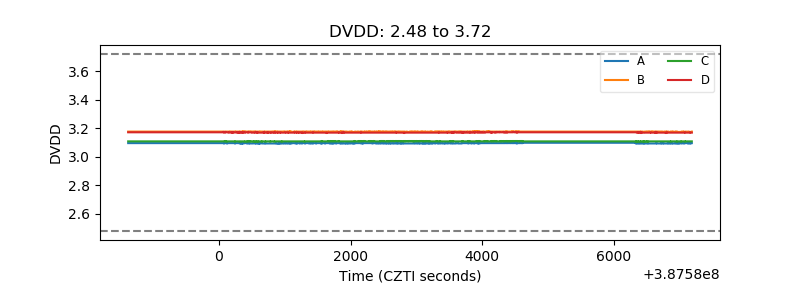 |
| Temperature 1 | 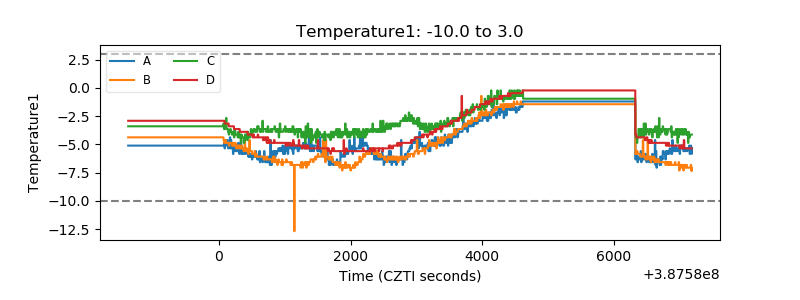 |
| Veto HV Monitor | 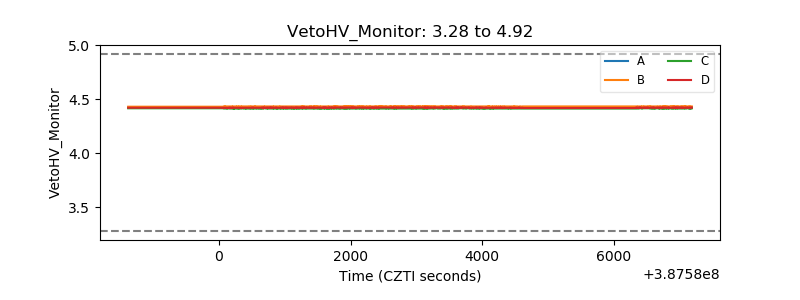 |
| Veto LLD | 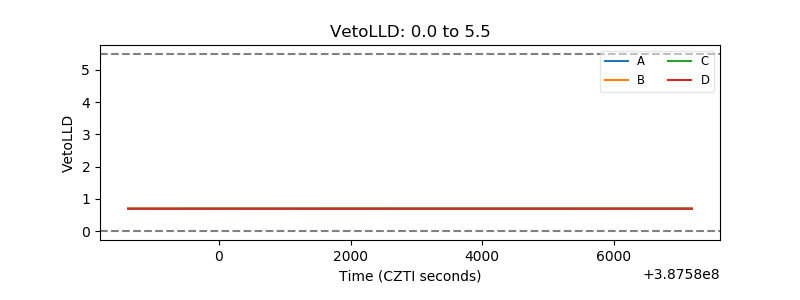 |
| Alpha Counter | 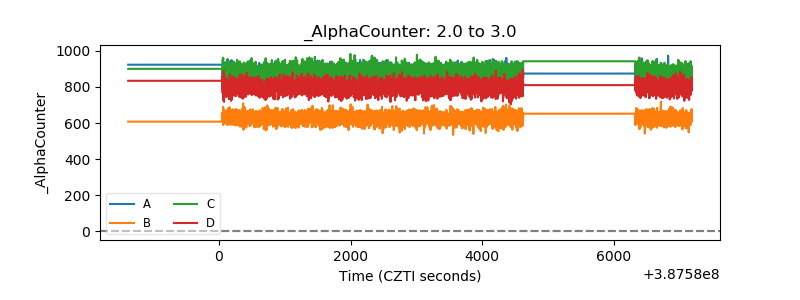 |
| _CPM_Rate | 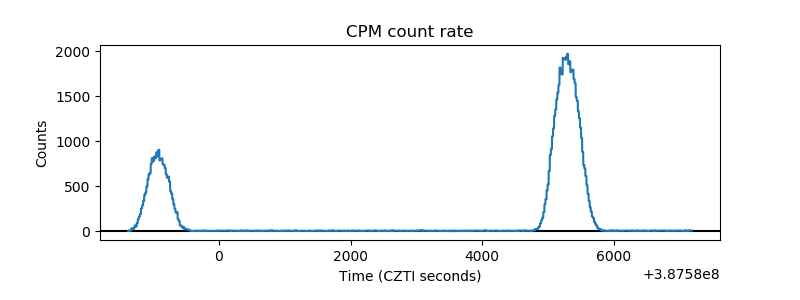 |
| CZT Counter | 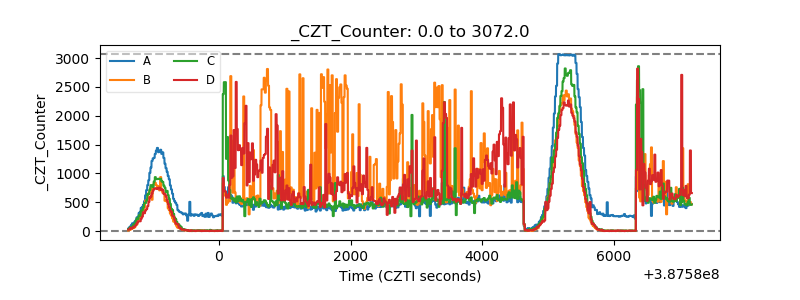 |
| +2.5 Volts monitor | 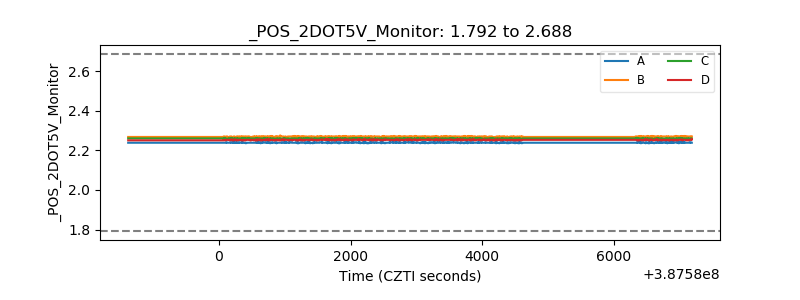 |
| +5 Volts monitor | 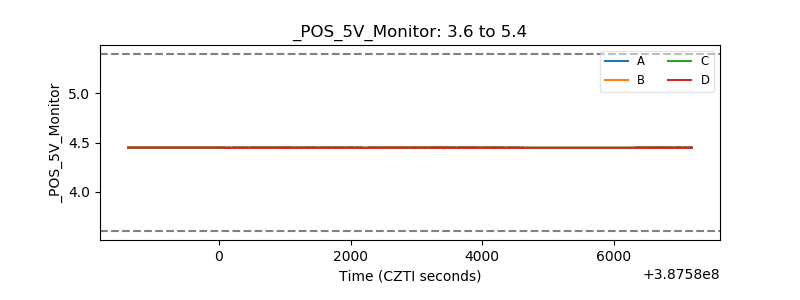 |
| _ROLL_ROT | 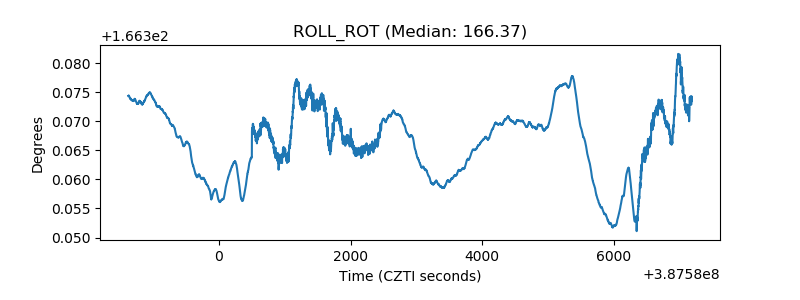 |
| _Roll_DEC | 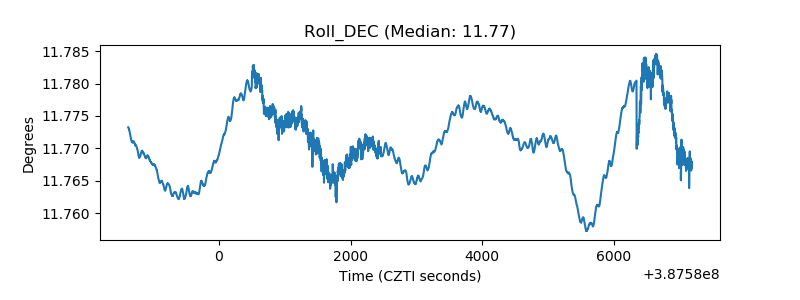 |
| _Roll_RA | 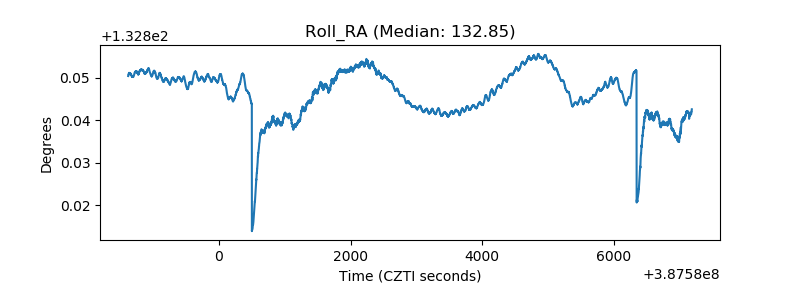 |
| Veto Counter | 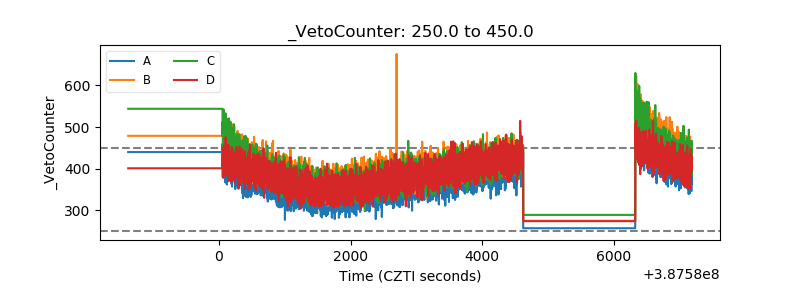 |