| Param | Original file | Final file |
|---|---|---|
| Filename | modeM0/AS1A11_099T01_9000005068_35367cztM0_level2.evt | modeM0/AS1A11_099T01_9000005068_35367cztM0_level2_quad_clean.evt |
| Size (bytes) | 832,559,040 | 72,218,880 |
| Size | 794.0 MB | 68.9 MB |
| Events in quadrant A | 2,998,964 | 557,211 |
| Events in quadrant B | 12,773,306 | 188,186 |
| Events in quadrant C | 3,678,565 | 545,374 |
| Events in quadrant D | 5,388,771 | 505,606 |
| Mode M9 | |||
|---|---|---|---|
| Quadrant | BADHDUFLAG | Total packets | Discarded packets |
| A | 0 | 28 | 0 |
| B | 0 | 28 | 0 |
| C | 0 | 28 | 0 |
| D | 0 | 28 | 0 |
| Mode M0 | |||
|---|---|---|---|
| Quadrant | BADHDUFLAG | Total packets | Discarded packets |
| A | 0 | 12369 | 3 |
| B | 0 | 41734 | 24 |
| C | 0 | 14333 | 5 |
| D | 0 | 20094 | 2 |
| Mode SS | |||
|---|---|---|---|
| Quadrant | BADHDUFLAG | Total packets | Discarded packets |
| A | 0 | 112 | 0 |
| B | 0 | 112 | 0 |
| C | 0 | 112 | 0 |
| D | 0 | 112 | 0 |
| Quadrant | Total seconds | Saturated seconds | Saturation percentage |
|---|---|---|---|
| A | 5548 | 37 | 0.666907% |
| B | 5545 | 4799 | 86.546438% |
| C | 5546 | 113 | 2.037505% |
| D | 5548 | 366 | 6.596972% |
Noise dominated data is calculated using 1-second bins in cleaned event files. If a bin has >2000 counts, and if more than 50% of those come from <1% of pixels, then it is considered to be noise-dominated and hence unusable.
| Quadrant | # 1 sec bins | Bins with >0 counts | Bins with >2000 counts | High rate bins dominated by noise | Noise dominated (total time) | Noise dominated (detector-on time) | Marked lightcurve |
|---|---|---|---|---|---|---|---|
| A | 7131 | 5549 | 14 | 14 | 0.20% | 0.25% | 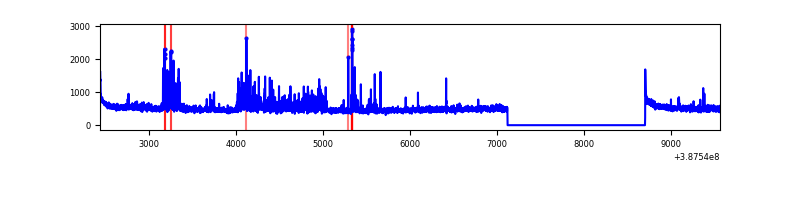 |
| B | 7131 | 5549 | 4318 | 4318 | 60.55% | 77.82% | 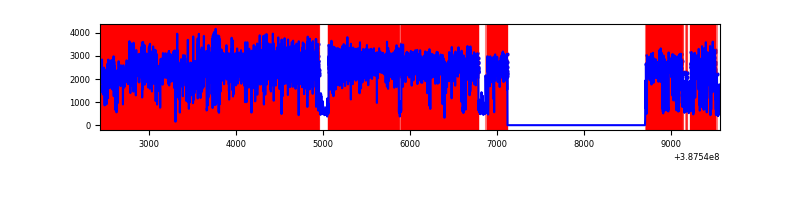 |
| C | 7131 | 5548 | 99 | 99 | 1.39% | 1.78% |  |
| D | 7131 | 5549 | 328 | 328 | 4.60% | 5.91% | 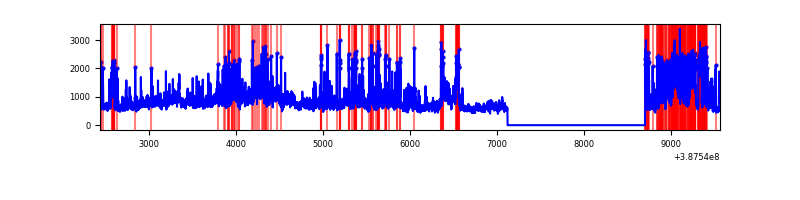 |
Top three noisy pixels from each quadrant. If the there are fewer than three noisy pixels in the level2.evt file, extra rows are filled as -1
| Pixel properties | Quadrant properties | ||||||
|---|---|---|---|---|---|---|---|
| Quadrant | DetID | PixID | Counts | Sigma | Mean | Median | Sigma |
| A | 15 | 169 | 298350 | 2249.12 | 653 | 639 | 132.4 |
| A | 10 | 83 | 119316 | 896.57 | 653 | 639 | 132.4 |
| A | 9 | 143 | 24057 | 176.92 | 653 | 639 | 132.4 |
| B | 4 | 251 | 11444351 | 216827.73 | 268 | 261 | 52.8 |
| B | 5 | 236 | 87523 | 1653.33 | 268 | 261 | 52.8 |
| B | 5 | 172 | 84252 | 1591.35 | 268 | 261 | 52.8 |
| C | 0 | 10 | 424418 | 2890.43 | 627 | 632 | 146.6 |
| C | 9 | 69 | 294707 | 2005.73 | 627 | 632 | 146.6 |
| C | 15 | 214 | 229249 | 1559.28 | 627 | 632 | 146.6 |
| D | 8 | 195 | 1118629 | 7209.17 | 625 | 608 | 155.1 |
| D | 1 | 52 | 744655 | 4797.73 | 625 | 608 | 155.1 |
| D | 12 | 235 | 339233 | 2183.51 | 625 | 608 | 155.1 |
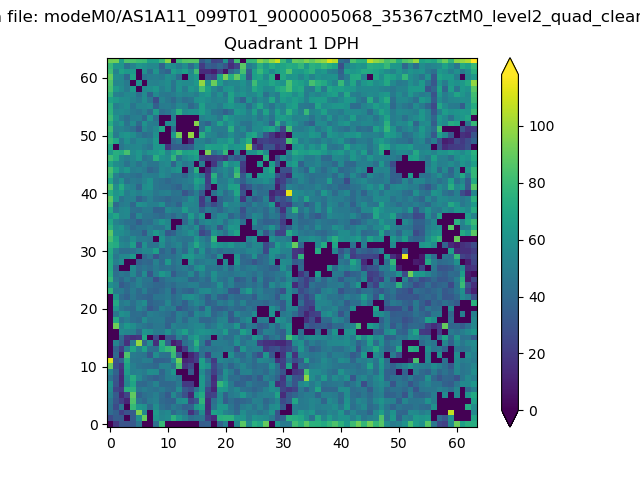
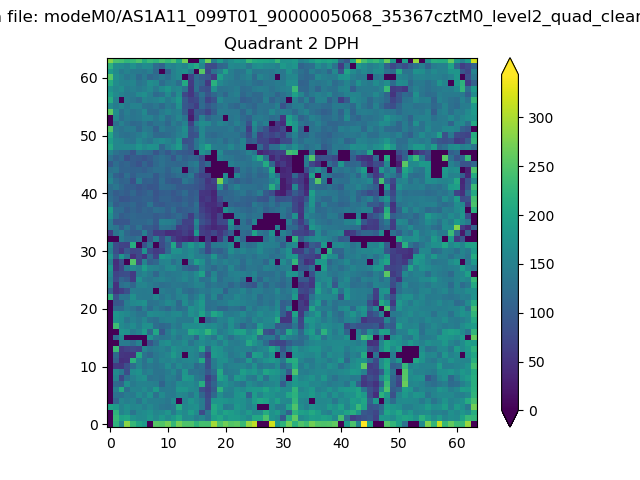
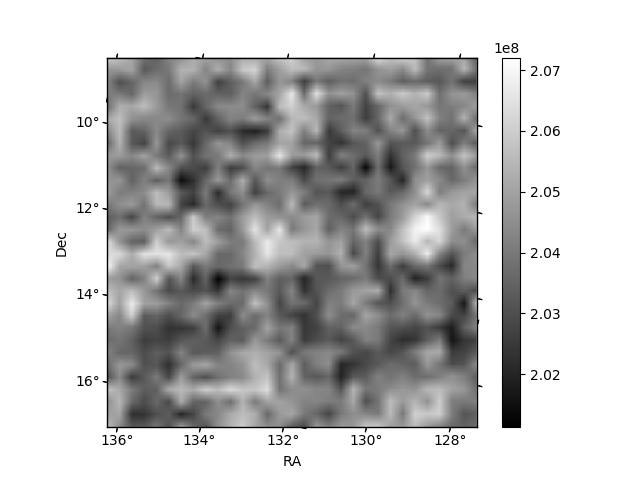
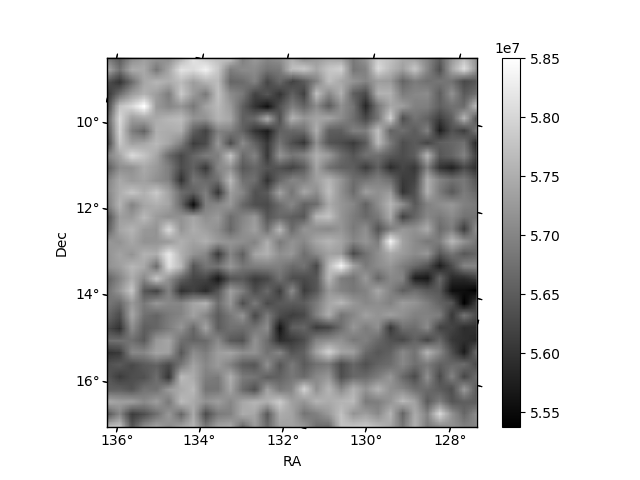
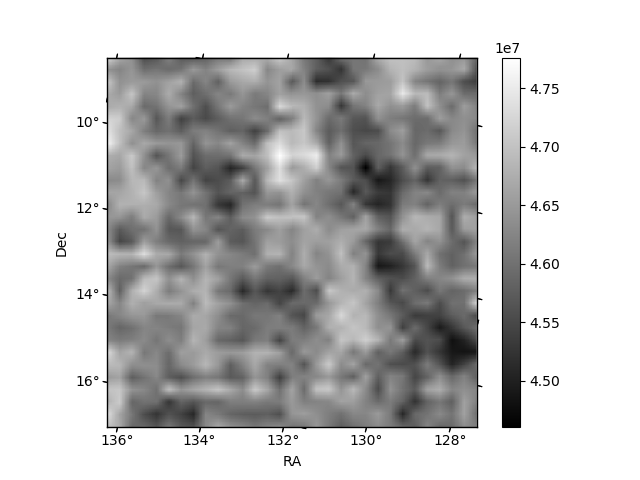
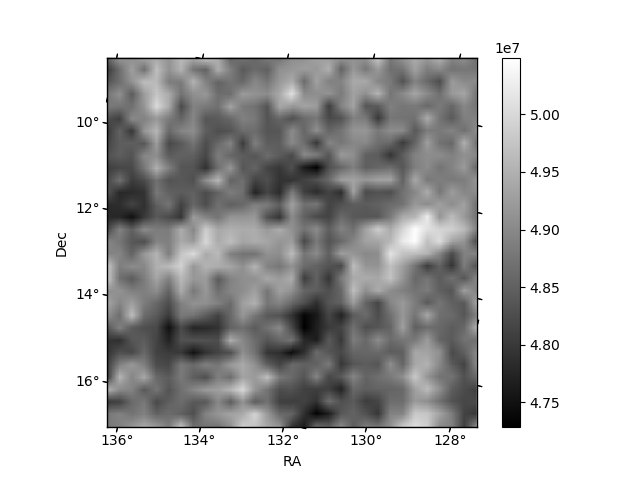
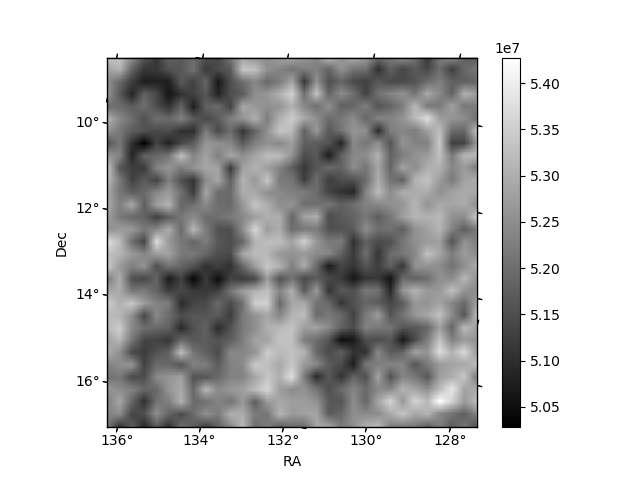
Histogram calculated using DETX and DETY for each event in the final _common_clean file
| Quadrant A | 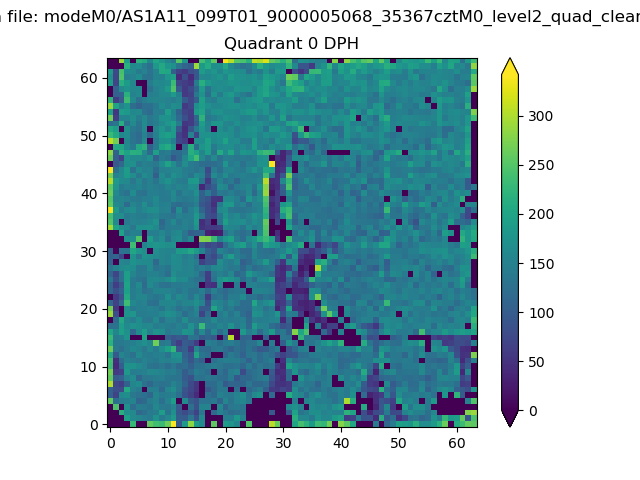 |
 |
Quadrant B |
|---|---|---|---|
| Quadrant D | 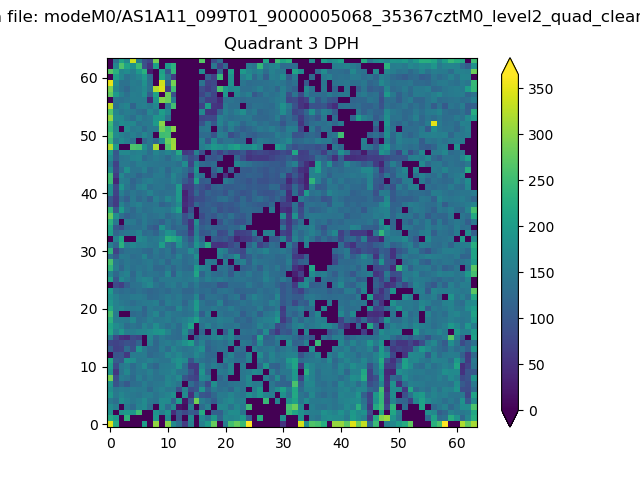 |
 |
Quadrant C |
| Plot type | Count rate plots | Images |
|---|---|---|
| Comparison with Poisson distribution Blue bars denote a histogram of data divided into 1 sec bins. Red curve is a Poisson curve with rate = median count rate of data. |
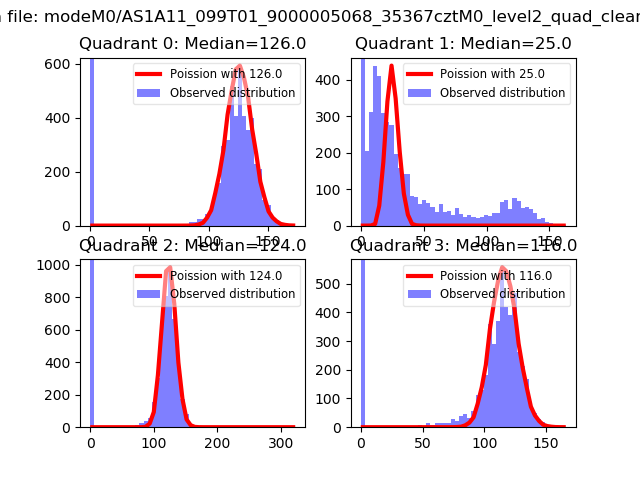 |
 |
| Quadrant-wise count rates Data is divided into 100 sec bins |
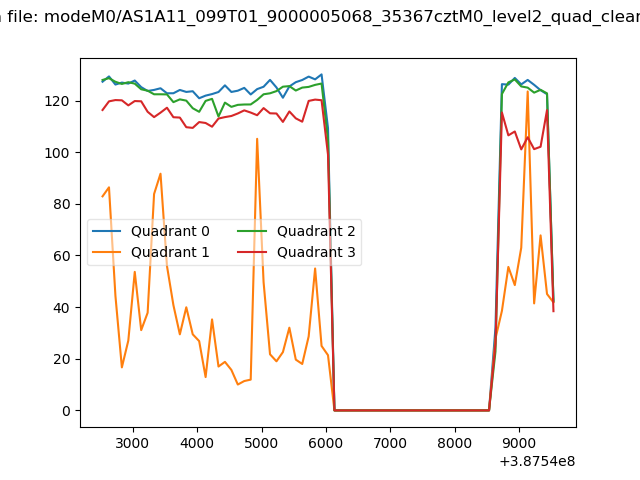 |
|
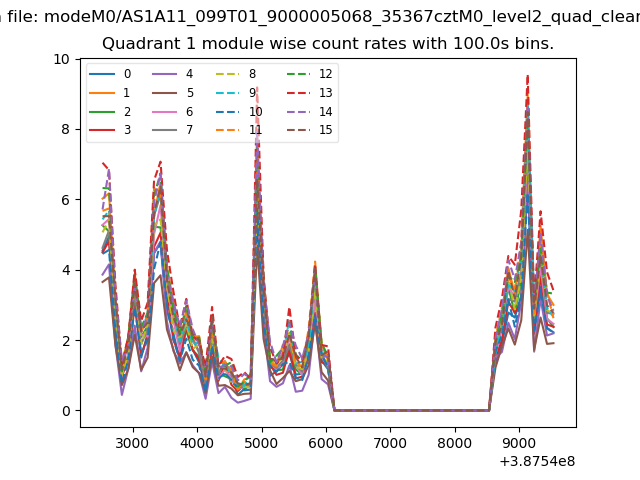
| Module-wise count rates for Quadrant A Data is divided into 100 sec bins |
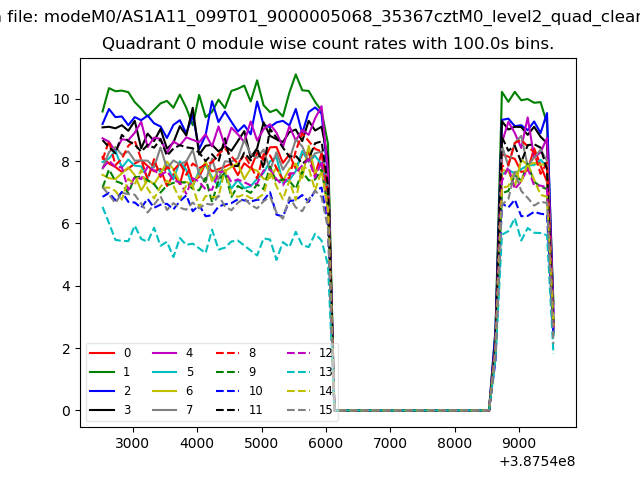 |
 |
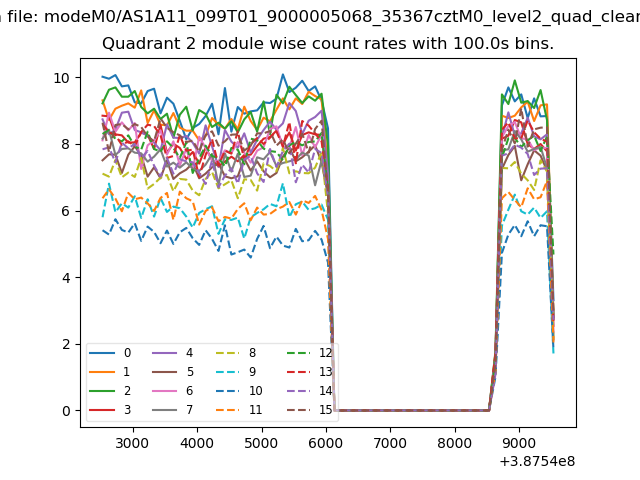
| Module-wise count rates for Quadrant B Data is divided into 100 sec bins |
 |
 |
| Module-wise count rates for Quadrant C Data is divided into 100 sec bins |
 |
 |
| Module-wise count rates for Quadrant D Data is divided into 100 sec bins |
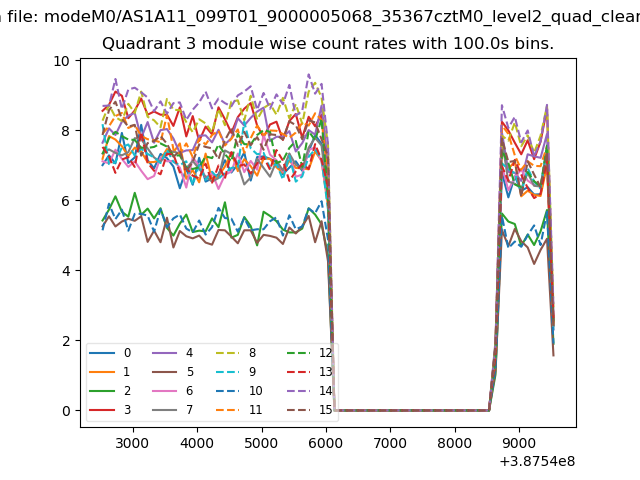 |
 |
| Parameter | Plot |
|---|---|
| CZT HV Monitor | 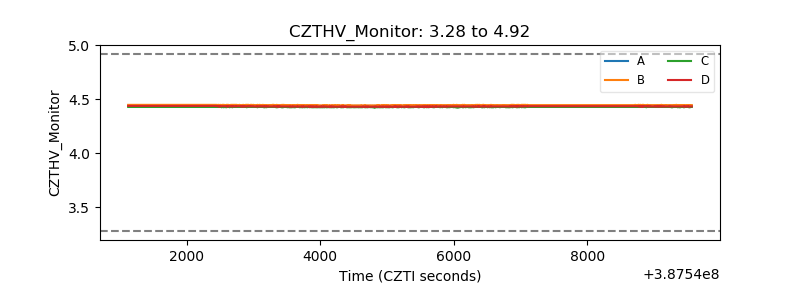 |
| D_VDD | 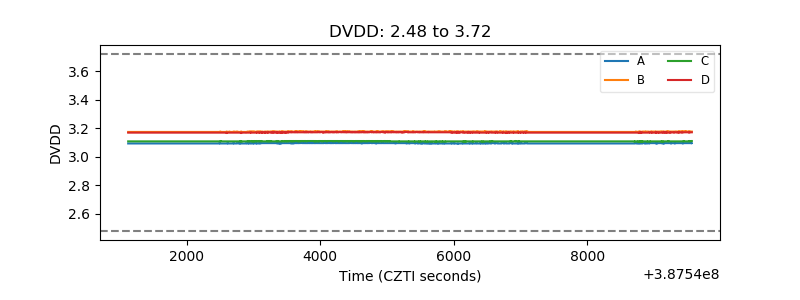 |
| Temperature 1 | 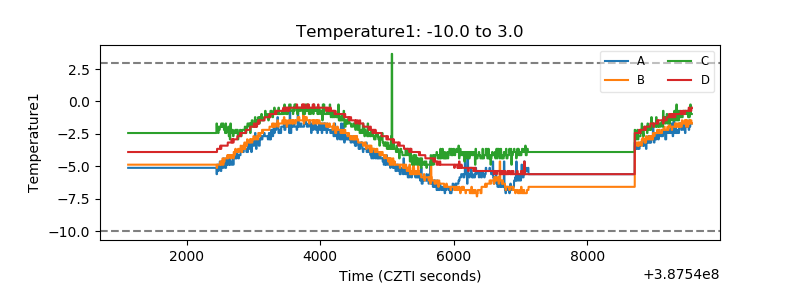 |
| Veto HV Monitor | 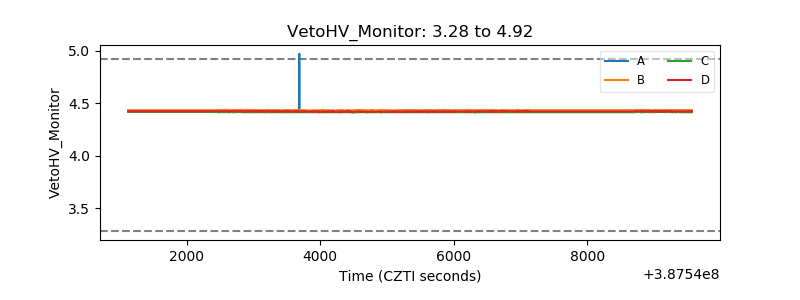 |
| Veto LLD | 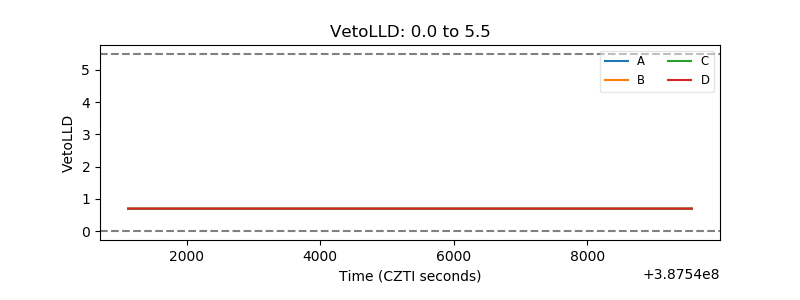 |
| Alpha Counter | 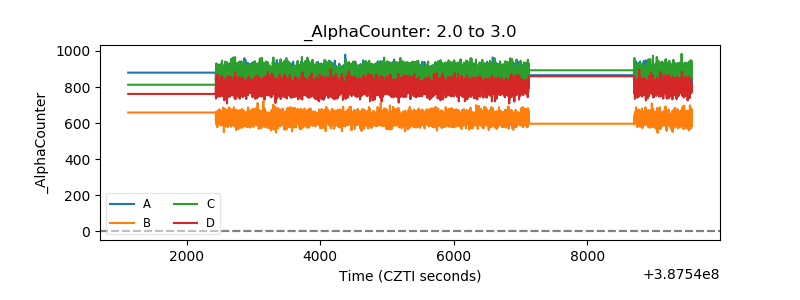 |
| _CPM_Rate | 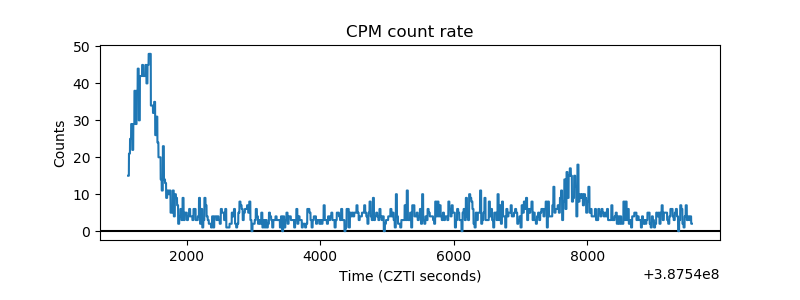 |
| CZT Counter | 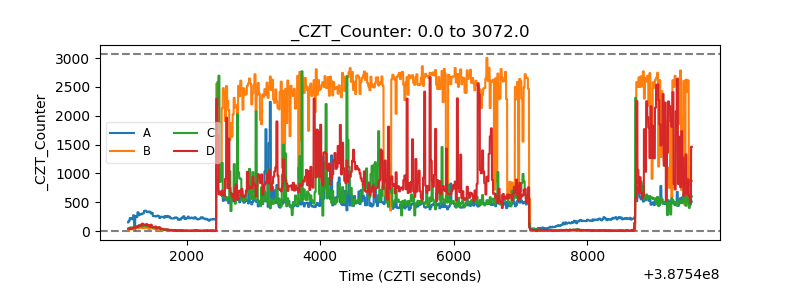 |
| +2.5 Volts monitor | 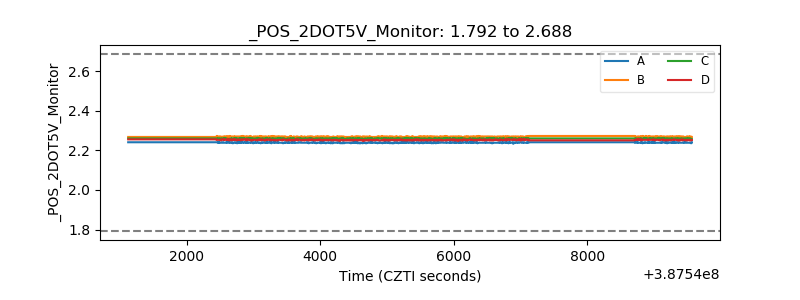 |
| +5 Volts monitor | 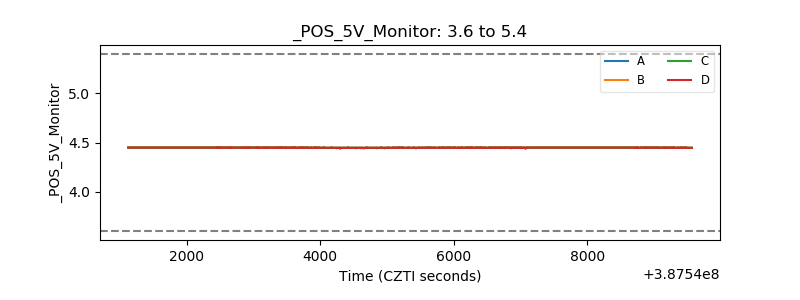 |
| _ROLL_ROT | 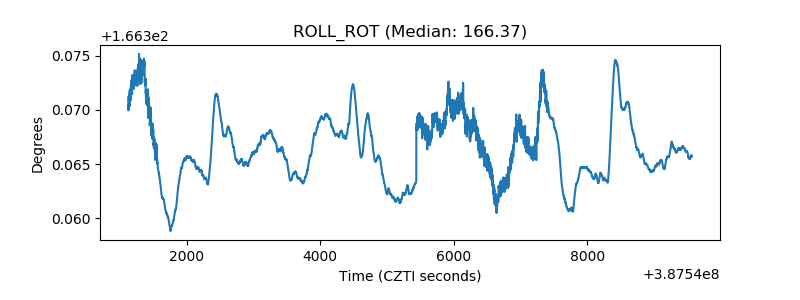 |
| _Roll_DEC | 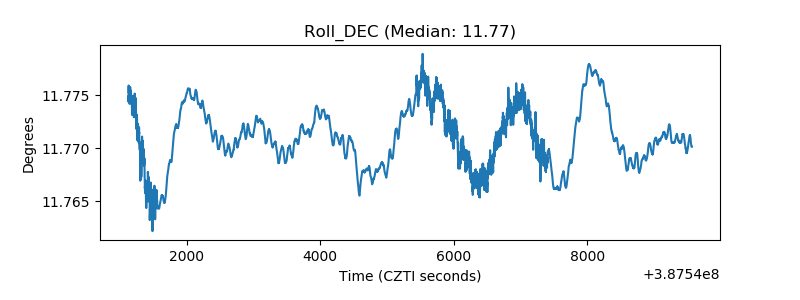 |
| _Roll_RA | 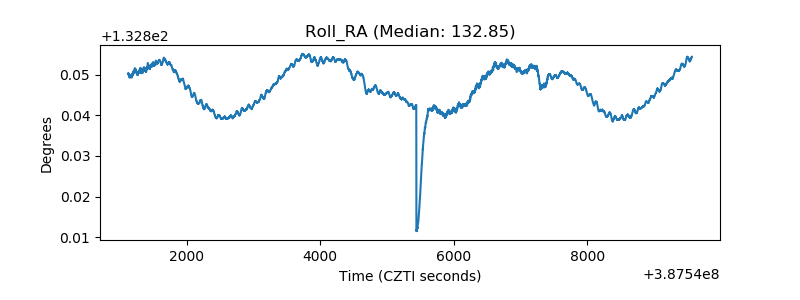 |
| Veto Counter | 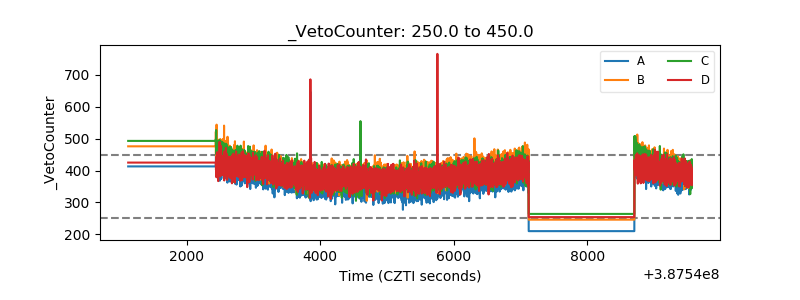 |