| Param | Original file | Final file |
|---|---|---|
| Filename | modeM0/AS1A11_099T01_9000005068_35366cztM0_level2.evt | modeM0/AS1A11_099T01_9000005068_35366cztM0_level2_quad_clean.evt |
| Size (bytes) | 763,721,280 | 72,941,760 |
| Size | 728.3 MB | 69.6 MB |
| Events in quadrant A | 2,726,502 | 558,407 |
| Events in quadrant B | 12,044,826 | 223,659 |
| Events in quadrant C | 3,086,813 | 551,699 |
| Events in quadrant D | 4,920,671 | 509,508 |
| Mode M9 | |||
|---|---|---|---|
| Quadrant | BADHDUFLAG | Total packets | Discarded packets |
| A | 0 | 37 | 0 |
| B | 0 | 37 | 0 |
| C | 0 | 37 | 0 |
| D | 0 | 38 | 0 |
| Mode M0 | |||
|---|---|---|---|
| Quadrant | BADHDUFLAG | Total packets | Discarded packets |
| A | 0 | 11230 | 3 |
| B | 0 | 39250 | 2 |
| C | 0 | 12182 | 2 |
| D | 0 | 18504 | 2 |
| Mode SS | |||
|---|---|---|---|
| Quadrant | BADHDUFLAG | Total packets | Discarded packets |
| A | 0 | 104 | 0 |
| B | 0 | 104 | 0 |
| C | 0 | 104 | 0 |
| D | 0 | 104 | 0 |
| Quadrant | Total seconds | Saturated seconds | Saturation percentage |
|---|---|---|---|
| A | 5189 | 40 | 0.770861% |
| B | 5189 | 4480 | 86.336481% |
| C | 5189 | 148 | 2.852187% |
| D | 5189 | 243 | 4.682983% |
Noise dominated data is calculated using 1-second bins in cleaned event files. If a bin has >2000 counts, and if more than 50% of those come from <1% of pixels, then it is considered to be noise-dominated and hence unusable.
| Quadrant | # 1 sec bins | Bins with >0 counts | Bins with >2000 counts | High rate bins dominated by noise | Noise dominated (total time) | Noise dominated (detector-on time) | Marked lightcurve |
|---|---|---|---|---|---|---|---|
| A | 7102 | 5190 | 28 | 28 | 0.39% | 0.54% | 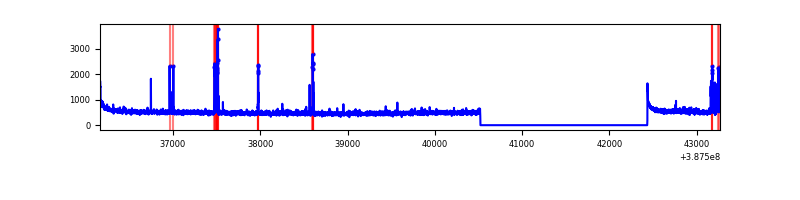 |
| B | 7102 | 5190 | 4063 | 4063 | 57.21% | 78.29% | 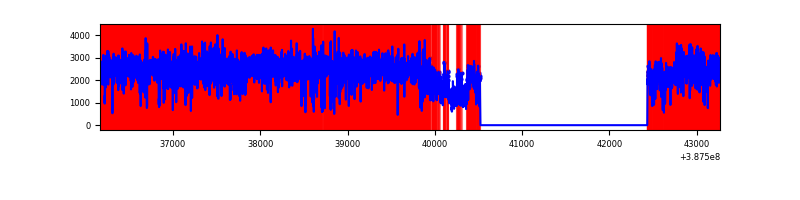 |
| C | 7102 | 5190 | 114 | 114 | 1.61% | 2.20% | 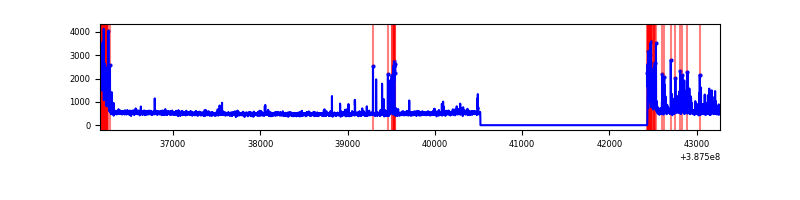 |
| D | 7102 | 5190 | 244 | 244 | 3.44% | 4.70% | 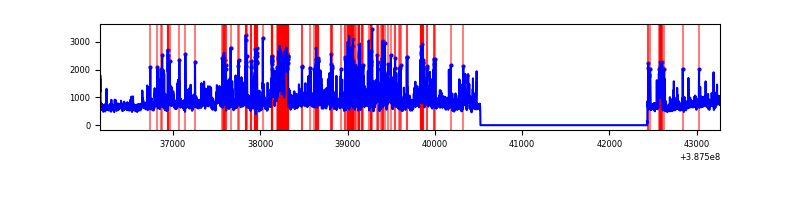 |
Top three noisy pixels from each quadrant. If the there are fewer than three noisy pixels in the level2.evt file, extra rows are filled as -1
| Pixel properties | Quadrant properties | ||||||
|---|---|---|---|---|---|---|---|
| Quadrant | DetID | PixID | Counts | Sigma | Mean | Median | Sigma |
| A | 10 | 83 | 114386 | 898.21 | 626 | 613 | 126.7 |
| A | 15 | 169 | 95944 | 752.61 | 626 | 613 | 126.7 |
| A | 9 | 143 | 67017 | 524.24 | 626 | 613 | 126.7 |
| B | 4 | 251 | 10497930 | 182299.64 | 293 | 286 | 57.6 |
| B | 5 | 172 | 181969 | 3155.06 | 293 | 286 | 57.6 |
| B | 5 | 236 | 84448 | 1461.54 | 293 | 286 | 57.6 |
| C | 0 | 10 | 480412 | 3423.93 | 594 | 599 | 140.1 |
| C | 15 | 214 | 214349 | 1525.31 | 594 | 599 | 140.1 |
| C | 3 | 233 | 50998 | 359.65 | 594 | 599 | 140.1 |
| D | 8 | 195 | 1085459 | 7333.72 | 599 | 583 | 147.9 |
| D | 12 | 235 | 389018 | 2625.81 | 599 | 583 | 147.9 |
| D | 7 | 80 | 333874 | 2253.03 | 599 | 583 | 147.9 |
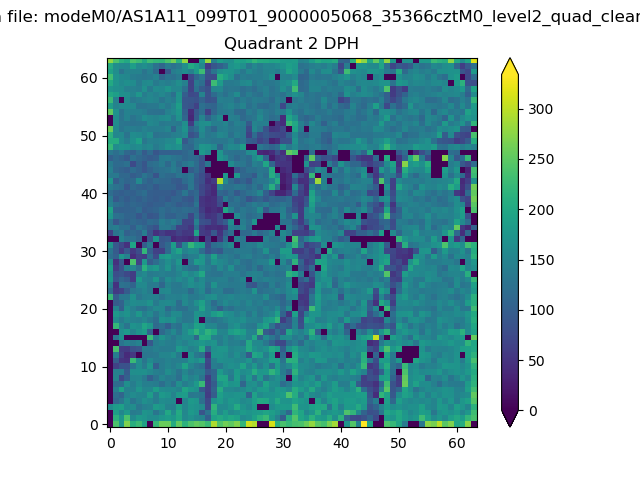
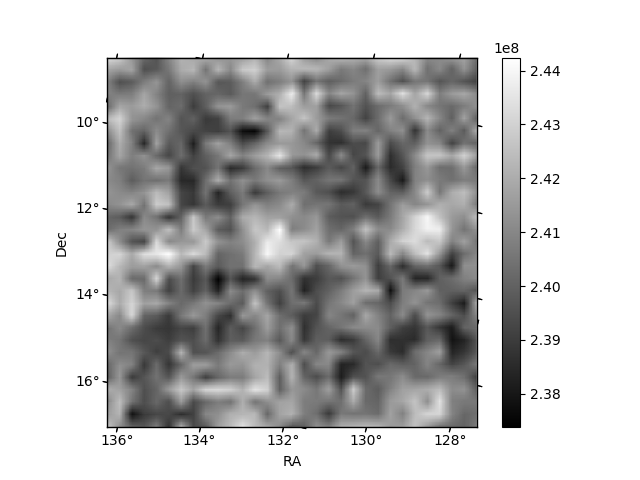
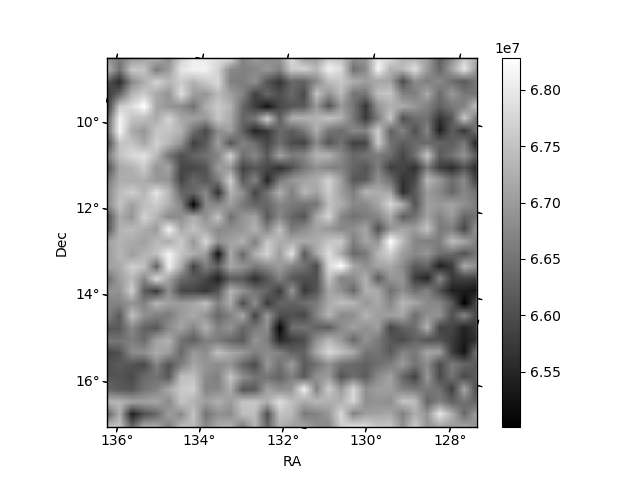
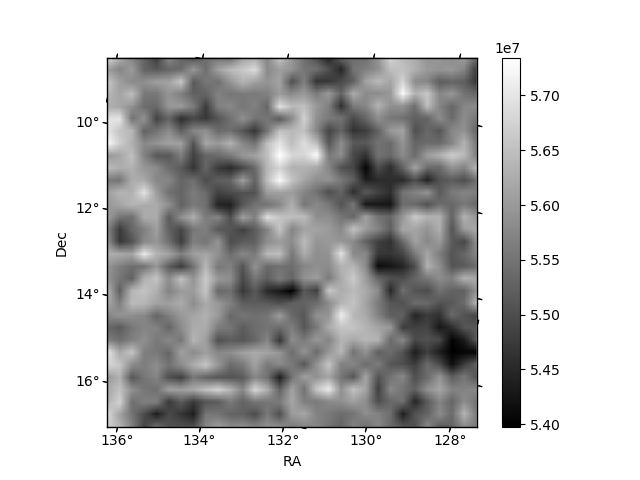
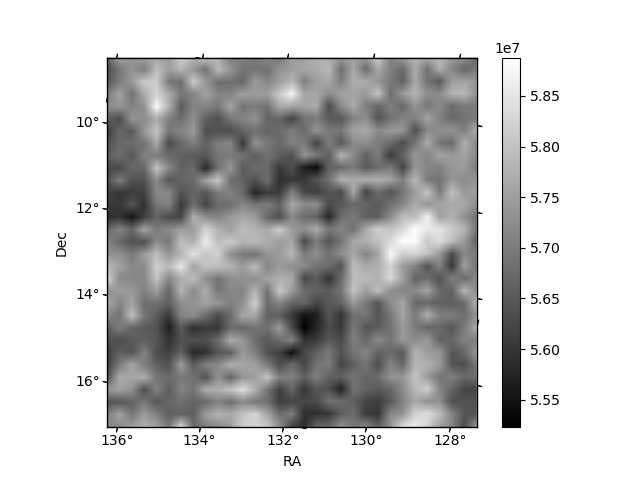
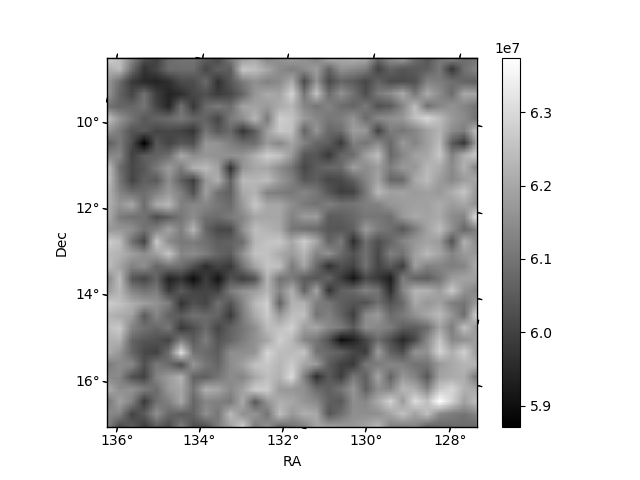
Histogram calculated using DETX and DETY for each event in the final _common_clean file
| Quadrant A | 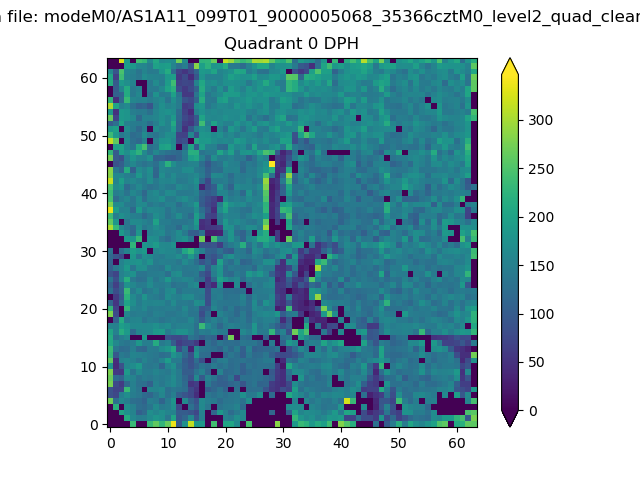 |
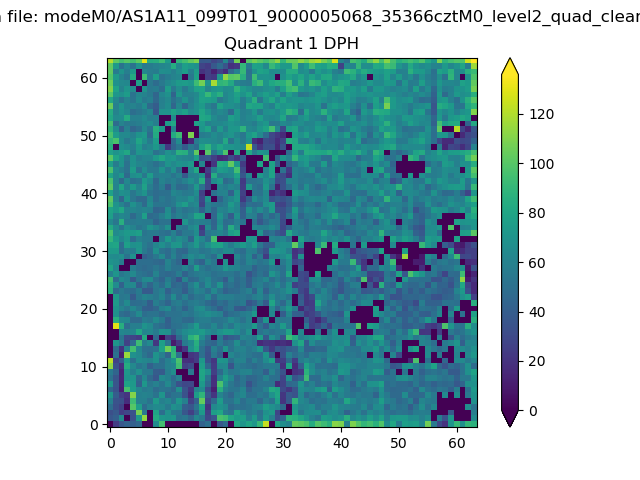 |
Quadrant B |
|---|---|---|---|
| Quadrant D | 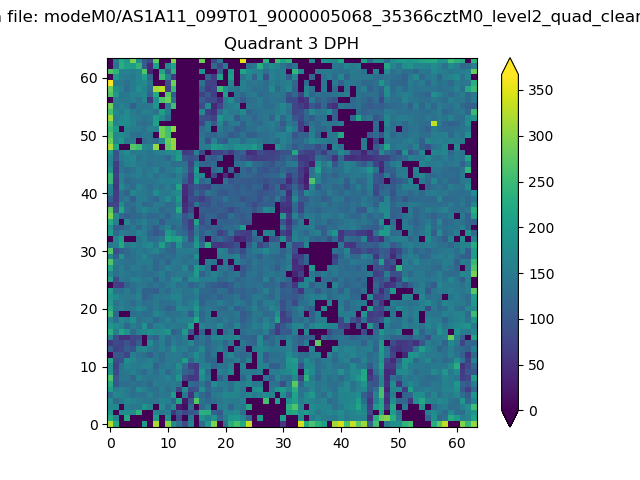 |
 |
Quadrant C |
| Plot type | Count rate plots | Images |
|---|---|---|
| Comparison with Poisson distribution Blue bars denote a histogram of data divided into 1 sec bins. Red curve is a Poisson curve with rate = median count rate of data. |
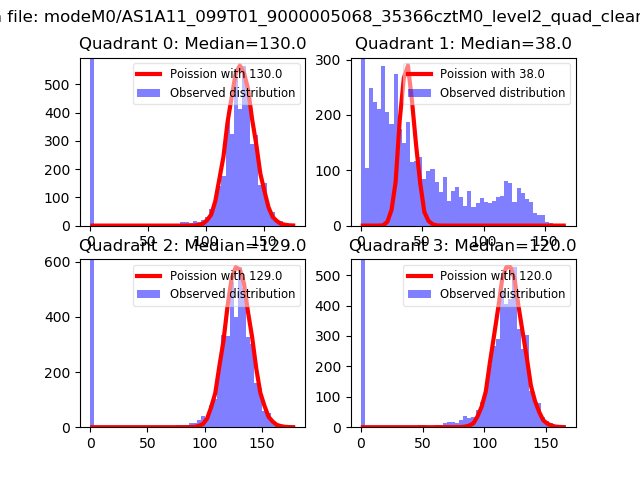 |
 |
| Quadrant-wise count rates Data is divided into 100 sec bins |
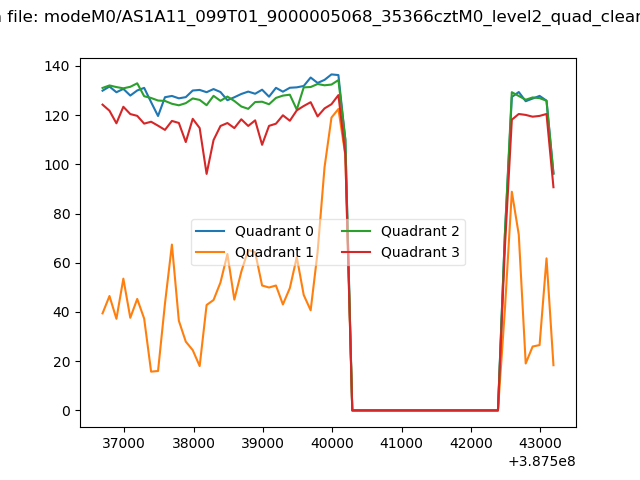 |
|
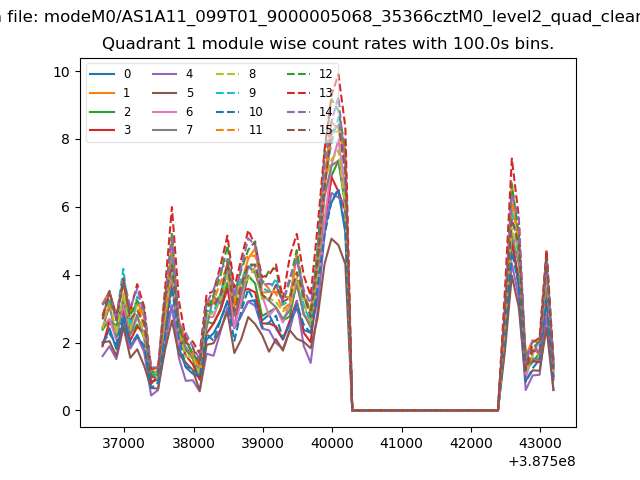
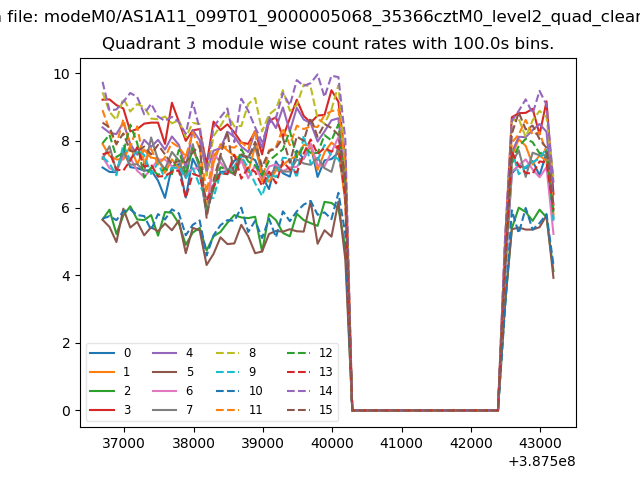
| Module-wise count rates for Quadrant A Data is divided into 100 sec bins |
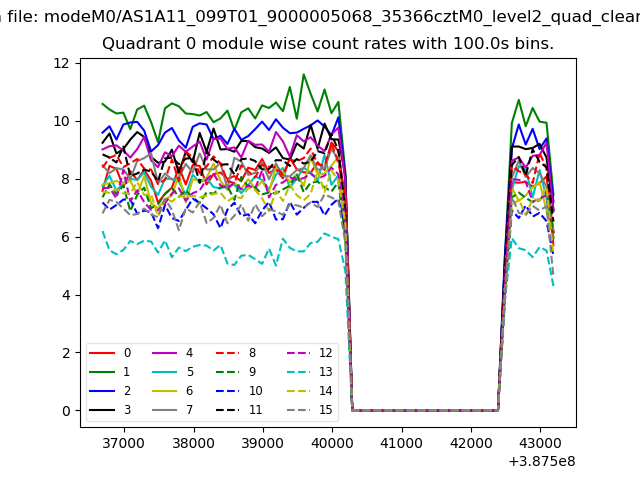 |
 |
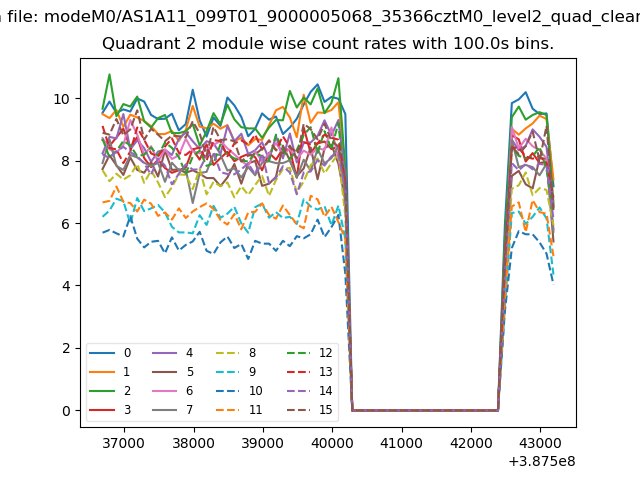
| Module-wise count rates for Quadrant B Data is divided into 100 sec bins |
 |
 |
| Module-wise count rates for Quadrant C Data is divided into 100 sec bins |
 |
 |
| Module-wise count rates for Quadrant D Data is divided into 100 sec bins |
 |
 |
| Parameter | Plot |
|---|---|
| CZT HV Monitor | 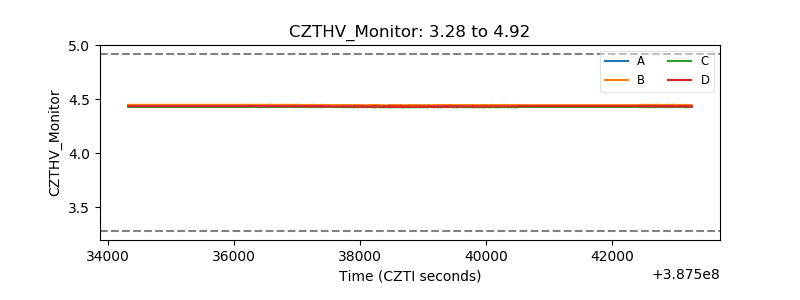 |
| D_VDD | 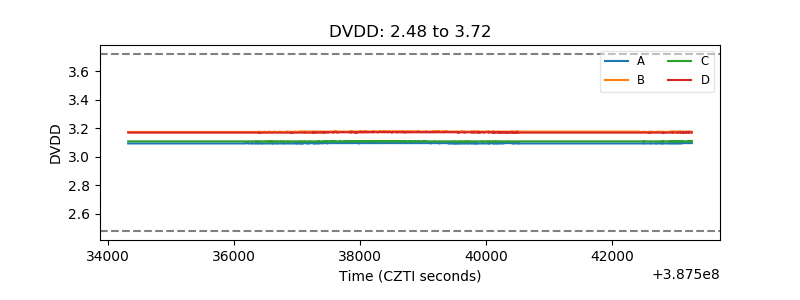 |
| Temperature 1 | 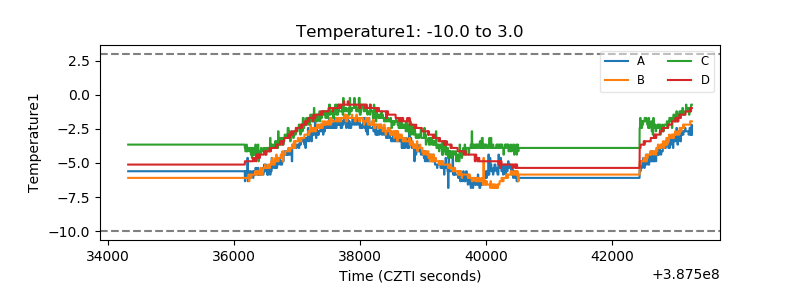 |
| Veto HV Monitor | 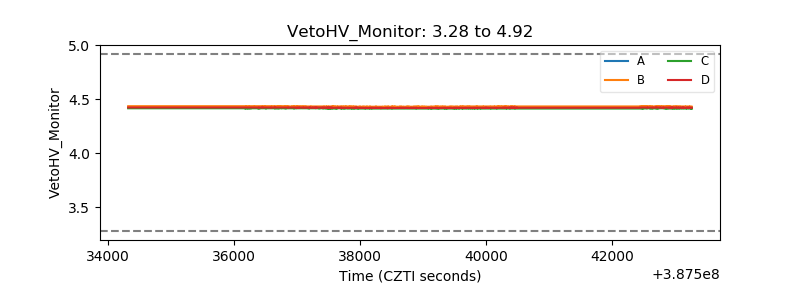 |
| Veto LLD | 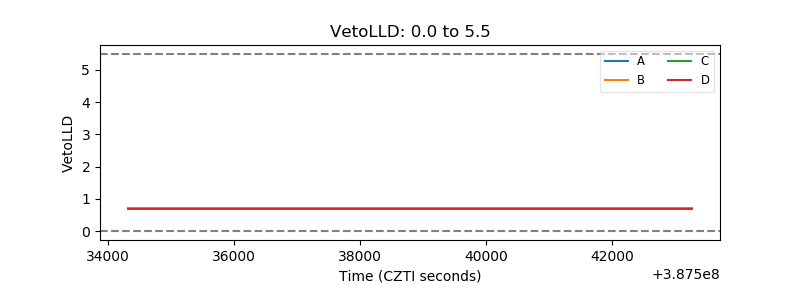 |
| Alpha Counter | 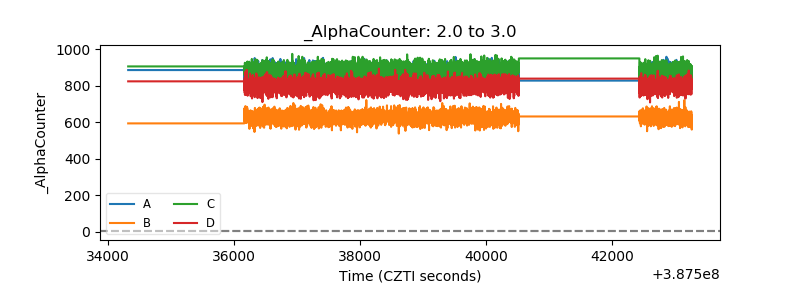 |
| _CPM_Rate | 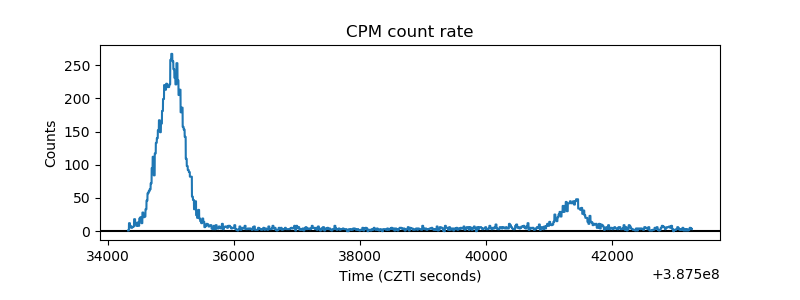 |
| CZT Counter | 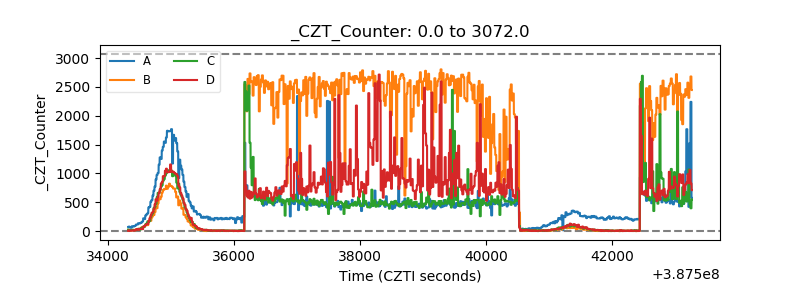 |
| +2.5 Volts monitor | 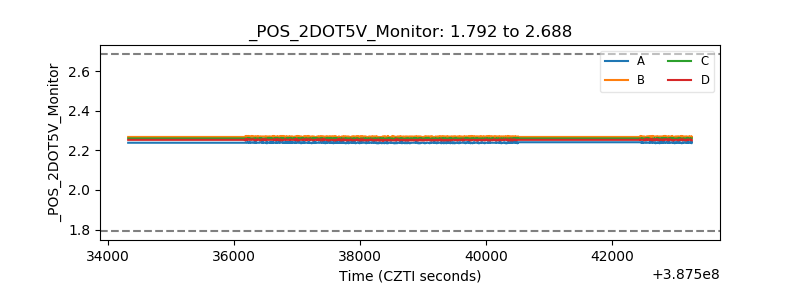 |
| +5 Volts monitor | 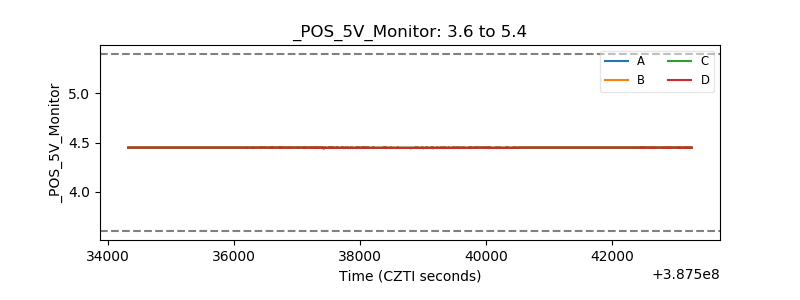 |
| _ROLL_ROT | 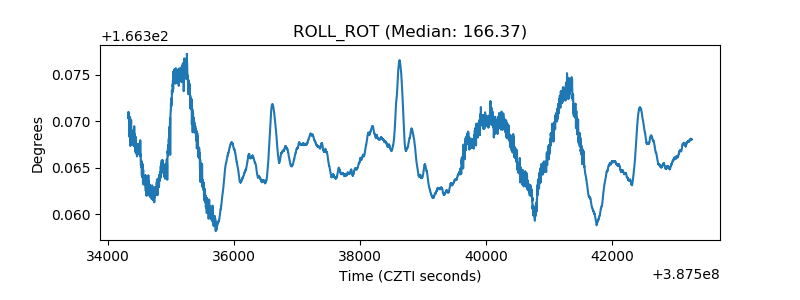 |
| _Roll_DEC |  |
| _Roll_RA | 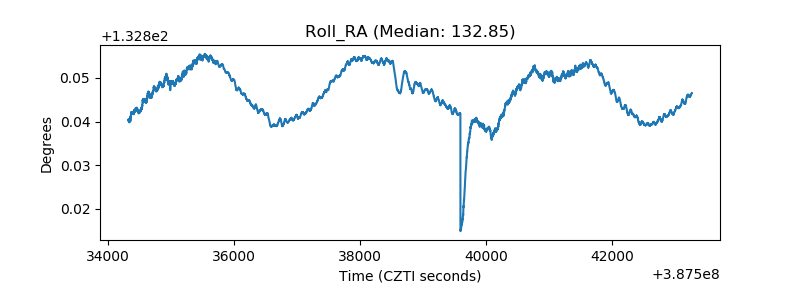 |
| Veto Counter | 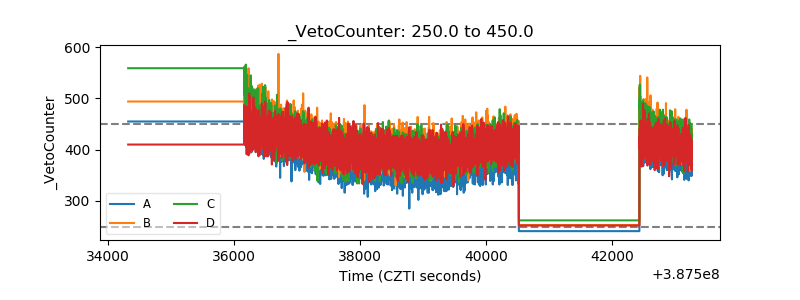 |