| Param | Original file | Final file |
|---|---|---|
| Filename | modeM0/AS1A11_099T01_9000005068_35364cztM0_level2.evt | modeM0/AS1A11_099T01_9000005068_35364cztM0_level2_quad_clean.evt |
| Size (bytes) | 558,279,360 | 59,241,600 |
| Size | 532.4 MB | 56.5 MB |
| Events in quadrant A | 2,741,006 | 390,333 |
| Events in quadrant B | 6,847,372 | 334,460 |
| Events in quadrant C | 3,109,058 | 378,905 |
| Events in quadrant D | 3,883,814 | 351,226 |
| Mode M9 | |||
|---|---|---|---|
| Quadrant | BADHDUFLAG | Total packets | Discarded packets |
| A | 0 | 29 | 0 |
| B | 0 | 29 | 0 |
| C | 0 | 29 | 0 |
| D | 0 | 30 | 0 |
| Mode M0 | |||
|---|---|---|---|
| Quadrant | BADHDUFLAG | Total packets | Discarded packets |
| A | 0 | 10799 | 3 |
| B | 0 | 23746 | 2 |
| C | 0 | 11972 | 2 |
| D | 0 | 15042 | 2 |
| Mode SS | |||
|---|---|---|---|
| Quadrant | BADHDUFLAG | Total packets | Discarded packets |
| A | 0 | 98 | 0 |
| B | 0 | 98 | 0 |
| C | 0 | 98 | 0 |
| D | 0 | 98 | 0 |
| Quadrant | Total seconds | Saturated seconds | Saturation percentage |
|---|---|---|---|
| A | 4820 | 42 | 0.871369% |
| B | 4820 | 1591 | 33.008299% |
| C | 4820 | 174 | 3.609959% |
| D | 4820 | 146 | 3.029046% |
Noise dominated data is calculated using 1-second bins in cleaned event files. If a bin has >2000 counts, and if more than 50% of those come from <1% of pixels, then it is considered to be noise-dominated and hence unusable.
| Quadrant | # 1 sec bins | Bins with >0 counts | Bins with >2000 counts | High rate bins dominated by noise | Noise dominated (total time) | Noise dominated (detector-on time) | Marked lightcurve |
|---|---|---|---|---|---|---|---|
| A | 6972 | 4821 | 26 | 26 | 0.37% | 0.54% | 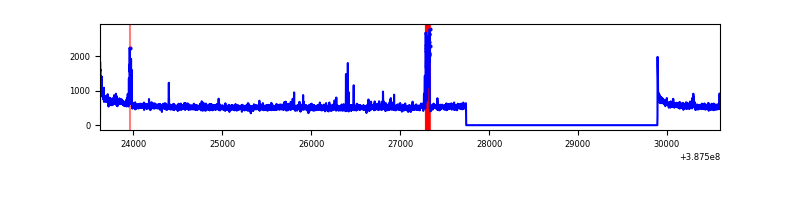 |
| B | 6972 | 4821 | 1259 | 1259 | 18.06% | 26.11% | 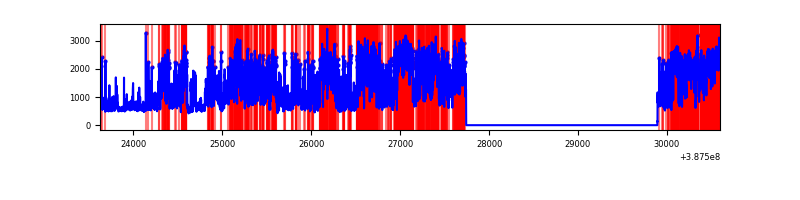 |
| C | 6972 | 4821 | 139 | 139 | 1.99% | 2.88% | 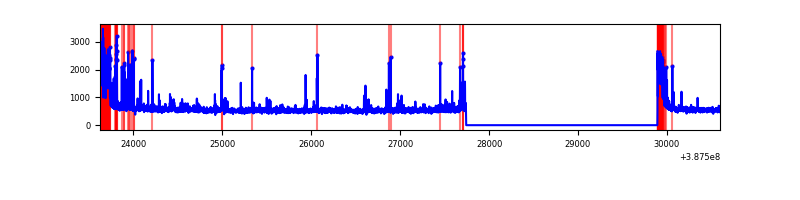 |
| D | 6972 | 4821 | 152 | 152 | 2.18% | 3.15% | 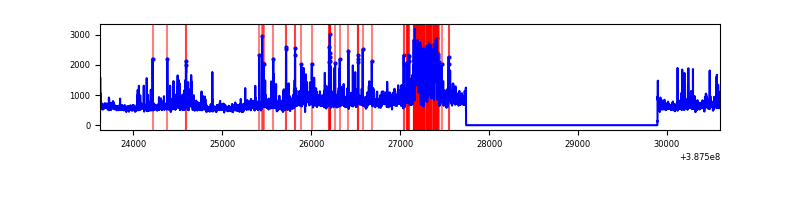 |
Top three noisy pixels from each quadrant. If the there are fewer than three noisy pixels in the level2.evt file, extra rows are filled as -1
| Pixel properties | Quadrant properties | ||||||
|---|---|---|---|---|---|---|---|
| Quadrant | DetID | PixID | Counts | Sigma | Mean | Median | Sigma |
| A | 10 | 83 | 110513 | 871.95 | 630 | 620 | 126.0 |
| A | 9 | 143 | 100509 | 792.58 | 630 | 620 | 126.0 |
| A | 15 | 169 | 78885 | 621.0 | 630 | 620 | 126.0 |
| B | 4 | 251 | 4384696 | 41071.16 | 562 | 548 | 106.7 |
| B | 5 | 172 | 133729 | 1247.65 | 562 | 548 | 106.7 |
| B | 4 | 232 | 33883 | 312.29 | 562 | 548 | 106.7 |
| C | 0 | 10 | 585105 | 4318.84 | 592 | 598 | 135.3 |
| C | 15 | 214 | 202220 | 1489.76 | 592 | 598 | 135.3 |
| C | 3 | 233 | 6355 | 42.54 | 592 | 598 | 135.3 |
| D | 8 | 195 | 616053 | 4165.63 | 598 | 580 | 147.8 |
| D | 12 | 233 | 340891 | 2303.28 | 598 | 580 | 147.8 |
| D | 2 | 152 | 168659 | 1137.58 | 598 | 580 | 147.8 |
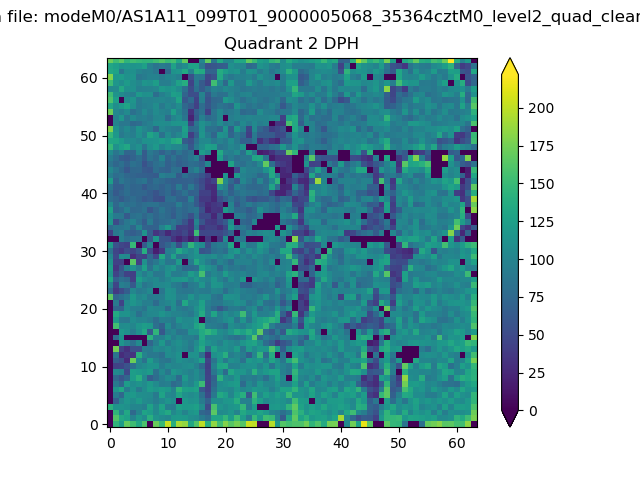
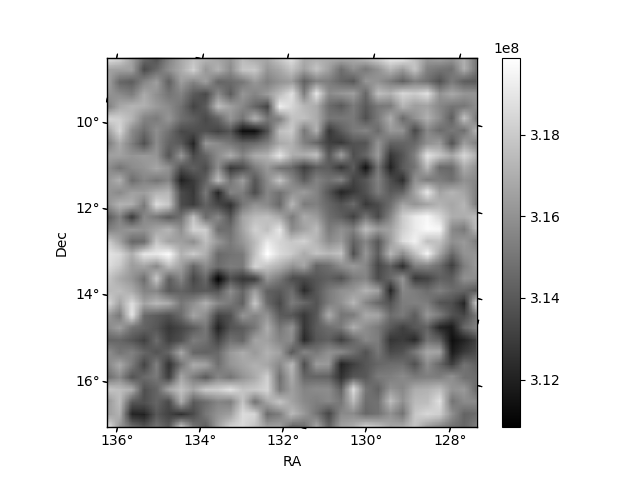
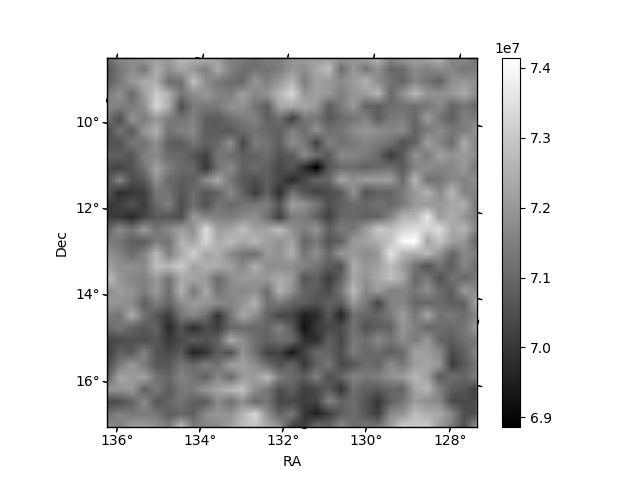
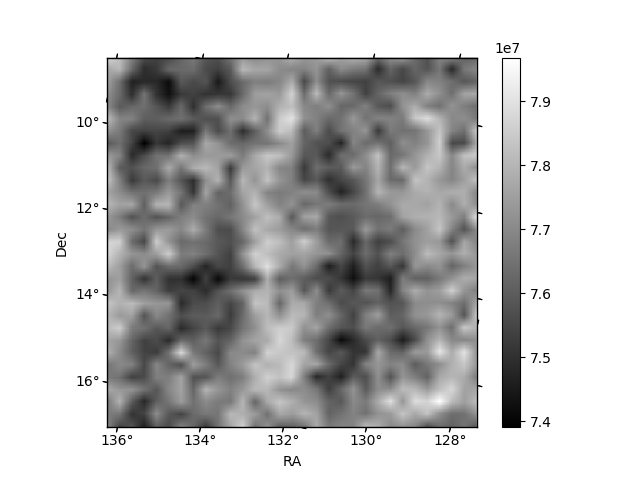
Histogram calculated using DETX and DETY for each event in the final _common_clean file
| Quadrant A | 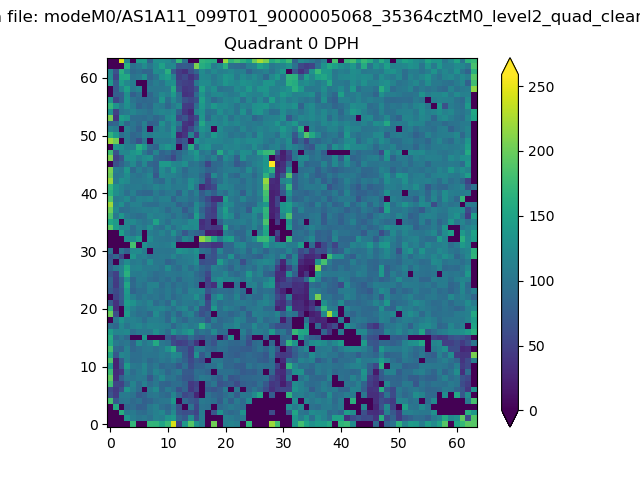 |
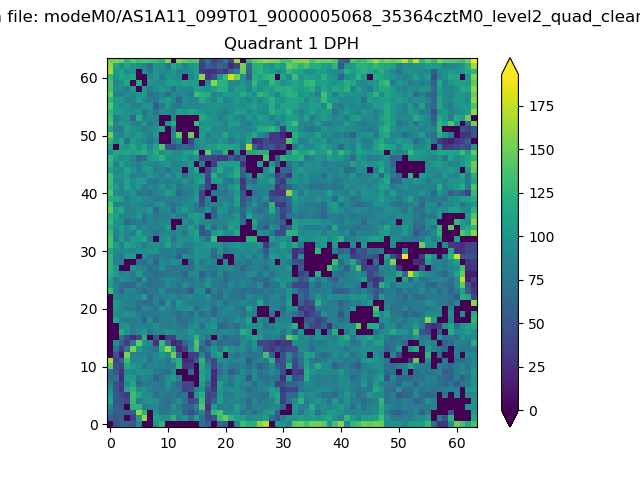 |
Quadrant B |
|---|---|---|---|
| Quadrant D | 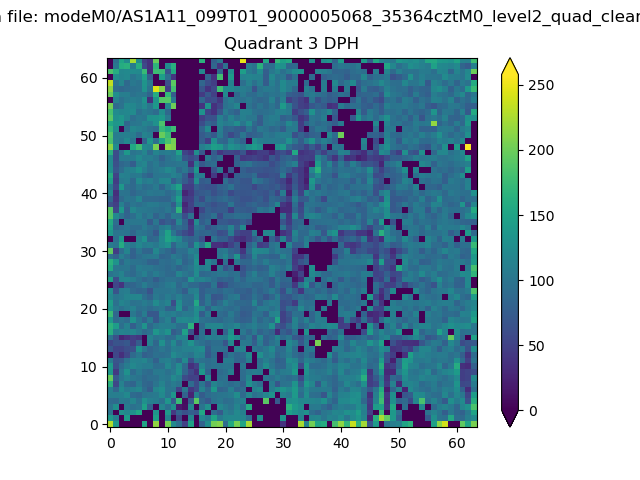 |
 |
Quadrant C |
| Plot type | Count rate plots | Images |
|---|---|---|
| Comparison with Poisson distribution Blue bars denote a histogram of data divided into 1 sec bins. Red curve is a Poisson curve with rate = median count rate of data. |
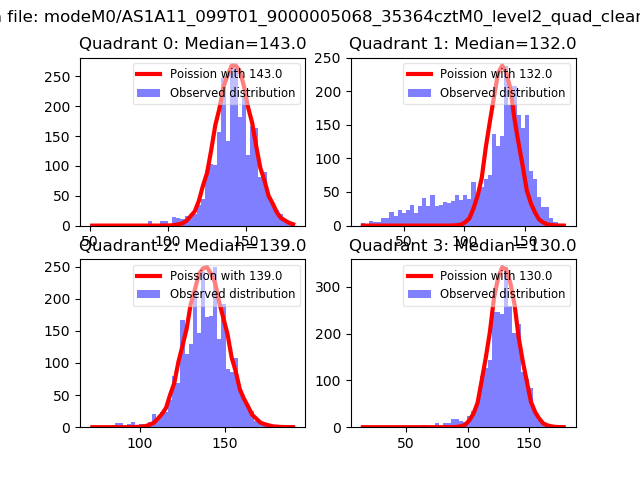 |
 |
| Quadrant-wise count rates Data is divided into 100 sec bins |
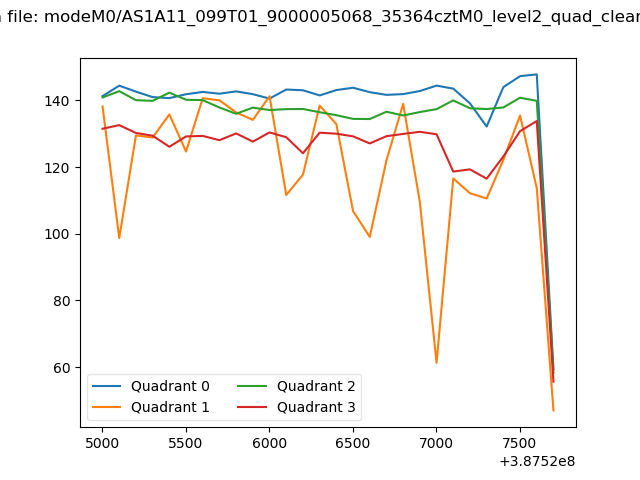 |
|
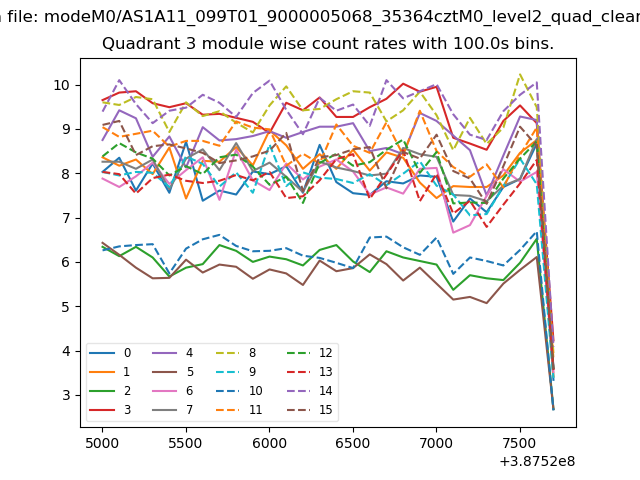
| Module-wise count rates for Quadrant A Data is divided into 100 sec bins |
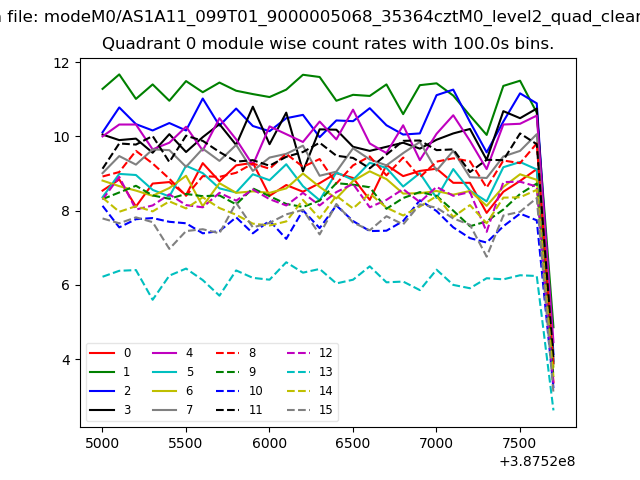 |
 |
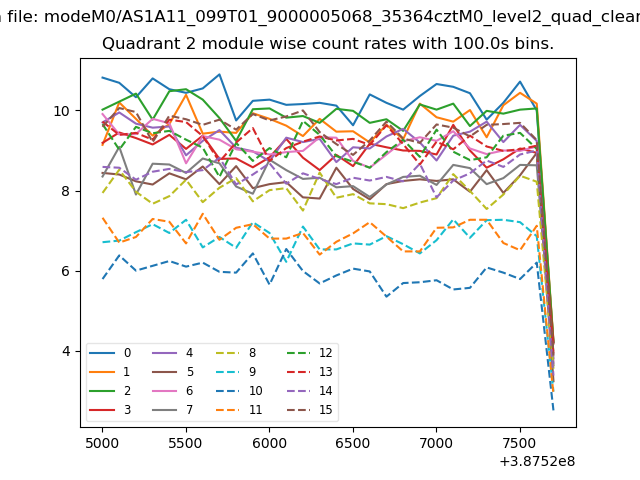
| Module-wise count rates for Quadrant B Data is divided into 100 sec bins |
 |
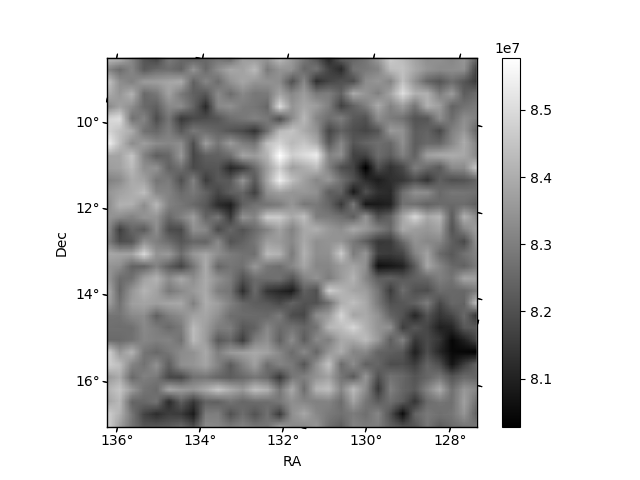 |
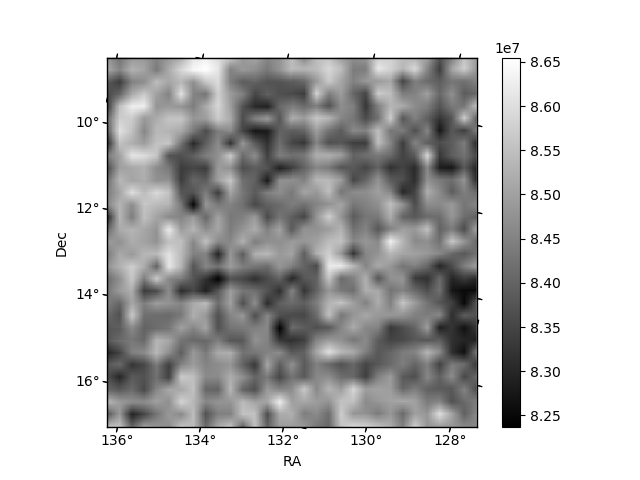
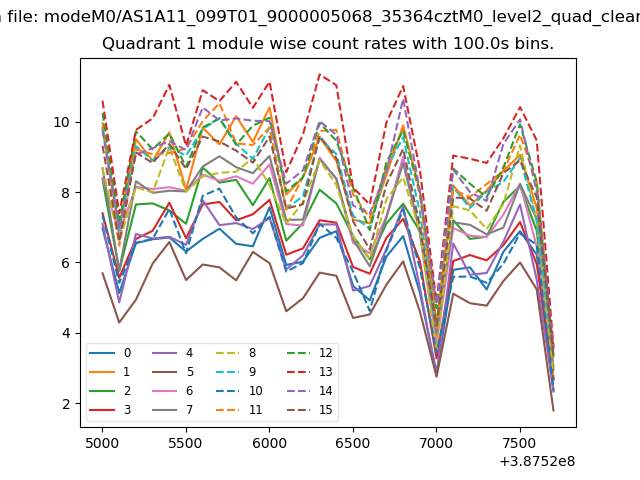
| Module-wise count rates for Quadrant C Data is divided into 100 sec bins |
 |
 |
| Module-wise count rates for Quadrant D Data is divided into 100 sec bins |
 |
 |
| Parameter | Plot |
|---|---|
| CZT HV Monitor | 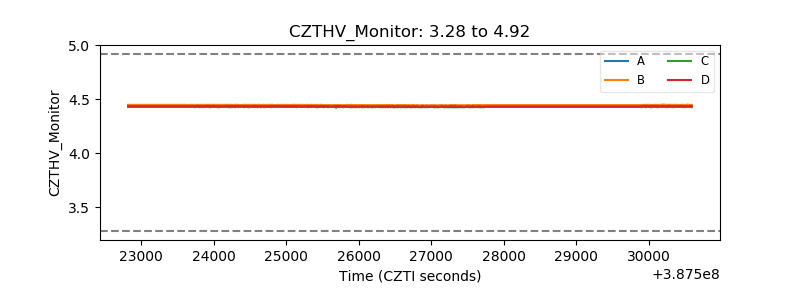 |
| D_VDD | 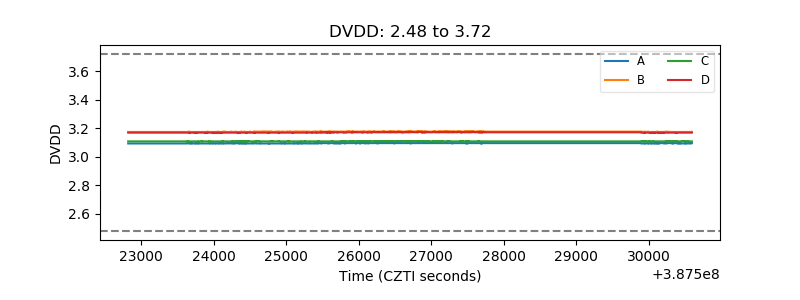 |
| Temperature 1 | 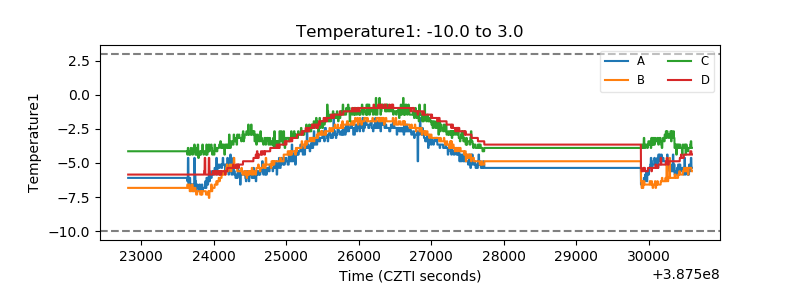 |
| Veto HV Monitor | 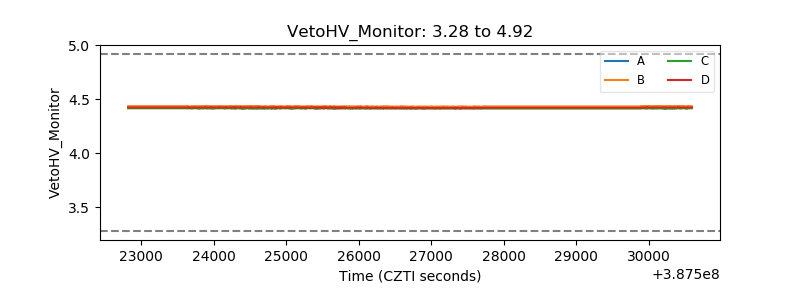 |
| Veto LLD | 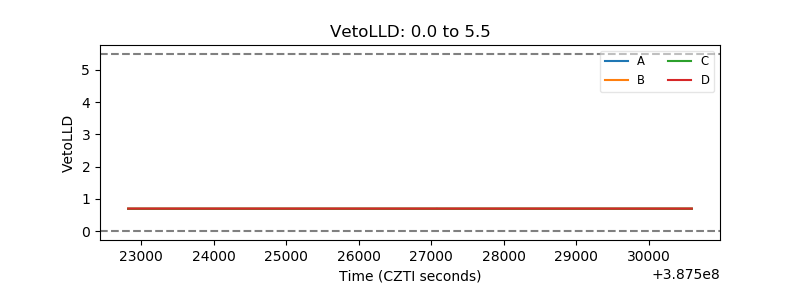 |
| Alpha Counter | 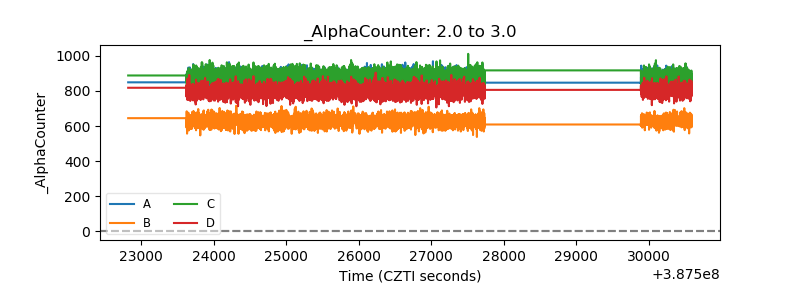 |
| _CPM_Rate | 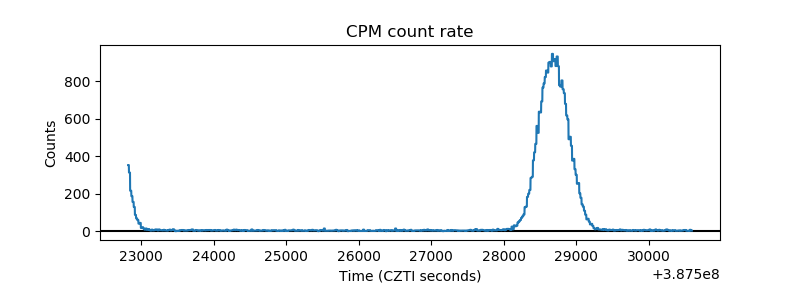 |
| CZT Counter | 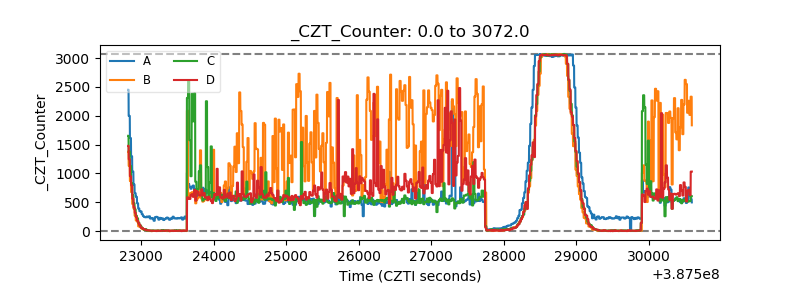 |
| +2.5 Volts monitor | 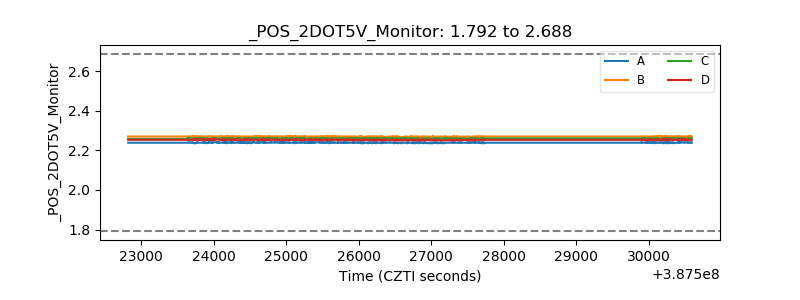 |
| +5 Volts monitor | 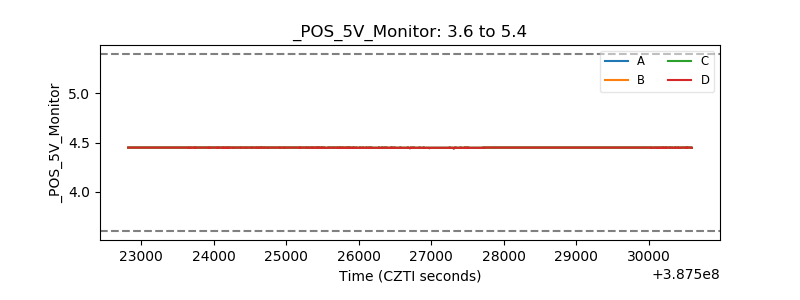 |
| _ROLL_ROT | 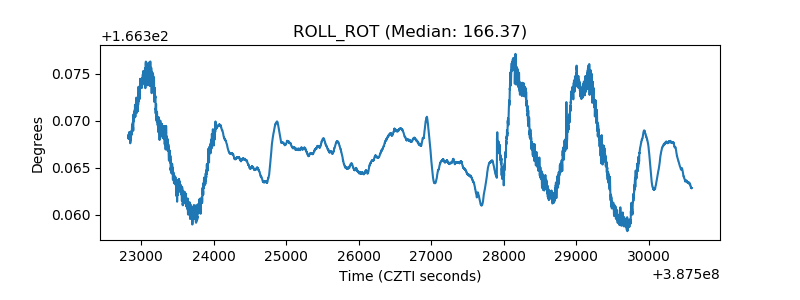 |
| _Roll_DEC | 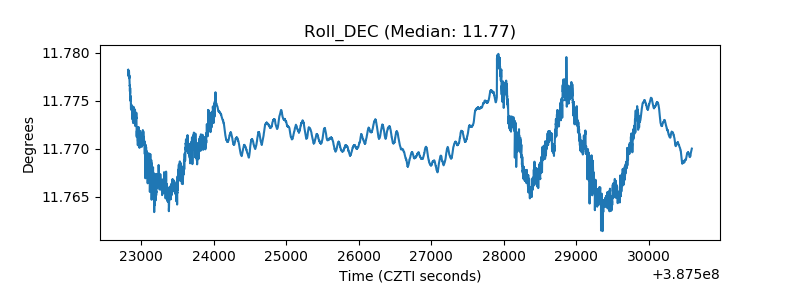 |
| _Roll_RA | 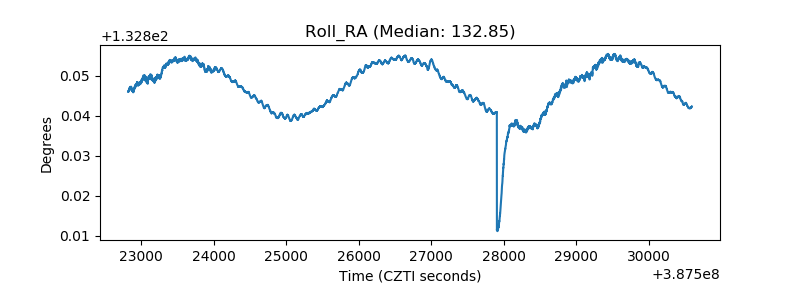 |
| Veto Counter | 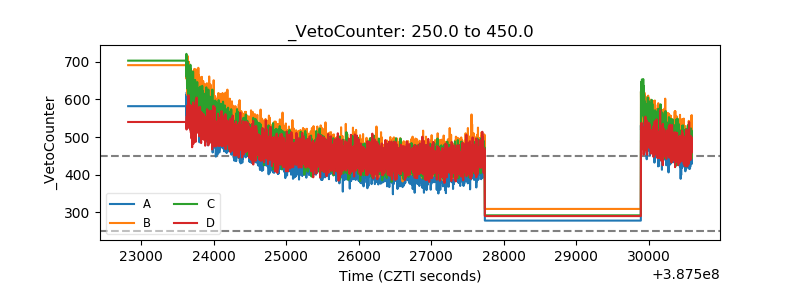 |