| Param | Original file | Final file |
|---|---|---|
| Filename | modeM0/AS1A11_099T01_9000005068_35363cztM0_level2.evt | modeM0/AS1A11_099T01_9000005068_35363cztM0_level2_quad_clean.evt |
| Size (bytes) | 560,217,600 | 52,562,880 |
| Size | 534.3 MB | 50.1 MB |
| Events in quadrant A | 3,133,057 | 337,798 |
| Events in quadrant B | 6,472,233 | 269,484 |
| Events in quadrant C | 3,180,903 | 331,212 |
| Events in quadrant D | 3,840,071 | 300,007 |
| Mode M9 | |||
|---|---|---|---|
| Quadrant | BADHDUFLAG | Total packets | Discarded packets |
| A | 0 | 34 | 0 |
| B | 0 | 34 | 0 |
| C | 0 | 34 | 0 |
| D | 0 | 35 | 0 |
| Mode M0 | |||
|---|---|---|---|
| Quadrant | BADHDUFLAG | Total packets | Discarded packets |
| A | 0 | 12745 | 3 |
| B | 0 | 22756 | 2 |
| C | 0 | 12202 | 2 |
| D | 0 | 14921 | 2 |
| Mode SS | |||
|---|---|---|---|
| Quadrant | BADHDUFLAG | Total packets | Discarded packets |
| A | 0 | 102 | 0 |
| B | 0 | 102 | 0 |
| C | 0 | 102 | 0 |
| D | 0 | 102 | 0 |
| Quadrant | Total seconds | Saturated seconds | Saturation percentage |
|---|---|---|---|
| A | 5024 | 26 | 0.517516% |
| B | 5024 | 1415 | 28.164809% |
| C | 5024 | 194 | 3.861465% |
| D | 5024 | 160 | 3.184713% |
Noise dominated data is calculated using 1-second bins in cleaned event files. If a bin has >2000 counts, and if more than 50% of those come from <1% of pixels, then it is considered to be noise-dominated and hence unusable.
| Quadrant | # 1 sec bins | Bins with >0 counts | Bins with >2000 counts | High rate bins dominated by noise | Noise dominated (total time) | Noise dominated (detector-on time) | Marked lightcurve |
|---|---|---|---|---|---|---|---|
| A | 7116 | 5025 | 13 | 13 | 0.18% | 0.26% | 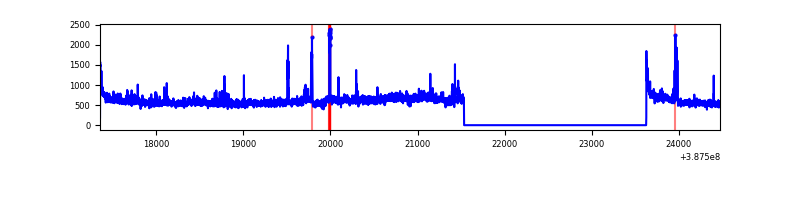 |
| B | 7116 | 5025 | 1109 | 1109 | 15.58% | 22.07% | 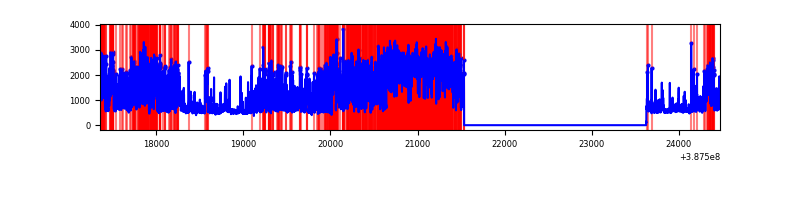 |
| C | 7116 | 5025 | 142 | 142 | 2.00% | 2.83% | 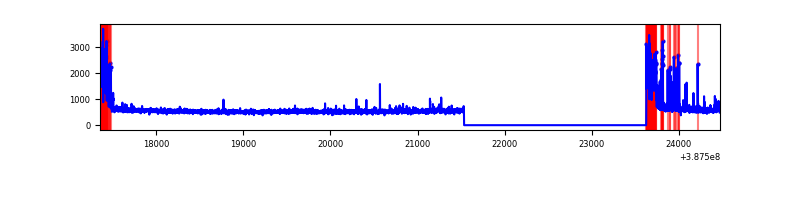 |
| D | 7116 | 5025 | 146 | 146 | 2.05% | 2.91% | 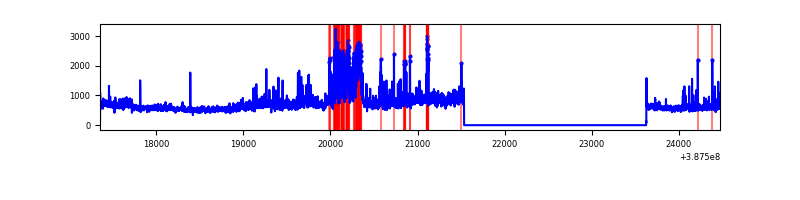 |
Top three noisy pixels from each quadrant. If the there are fewer than three noisy pixels in the level2.evt file, extra rows are filled as -1
| Pixel properties | Quadrant properties | ||||||
|---|---|---|---|---|---|---|---|
| Quadrant | DetID | PixID | Counts | Sigma | Mean | Median | Sigma |
| A | 15 | 169 | 423876 | 3174.97 | 665 | 654 | 133.3 |
| A | 10 | 83 | 109689 | 817.97 | 665 | 654 | 133.3 |
| A | 13 | 6 | 15602 | 112.14 | 665 | 654 | 133.3 |
| B | 4 | 251 | 3625046 | 32226.49 | 593 | 580 | 112.5 |
| B | 5 | 172 | 247183 | 2192.64 | 593 | 580 | 112.5 |
| B | 5 | 236 | 199817 | 1771.49 | 593 | 580 | 112.5 |
| C | 0 | 10 | 534467 | 3718.89 | 624 | 630 | 143.5 |
| C | 15 | 214 | 207800 | 1443.22 | 624 | 630 | 143.5 |
| C | 3 | 233 | 4921 | 29.89 | 624 | 630 | 143.5 |
| D | 8 | 195 | 774524 | 5012.0 | 626 | 609 | 154.4 |
| D | 12 | 233 | 297859 | 1925.04 | 626 | 609 | 154.4 |
| D | 2 | 152 | 107090 | 689.59 | 626 | 609 | 154.4 |
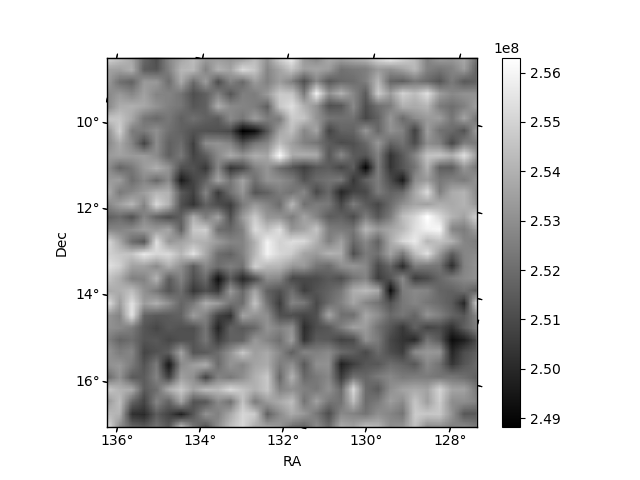
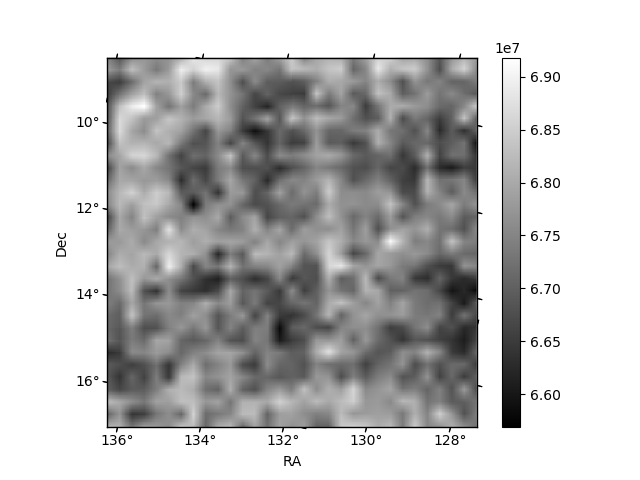
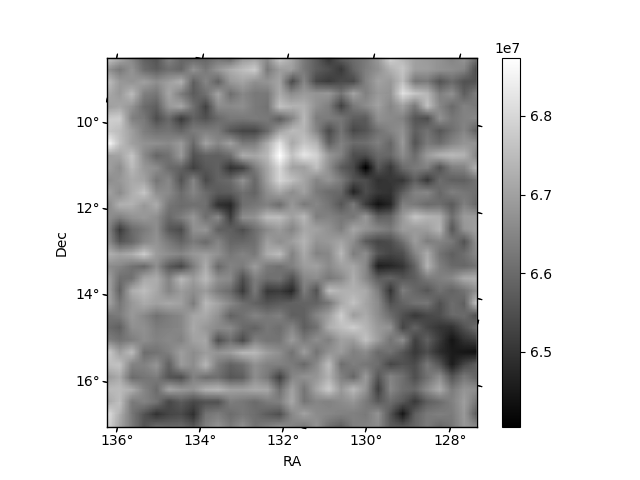
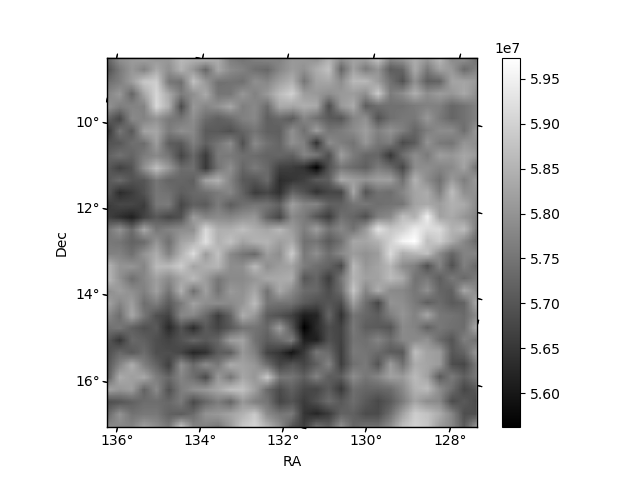
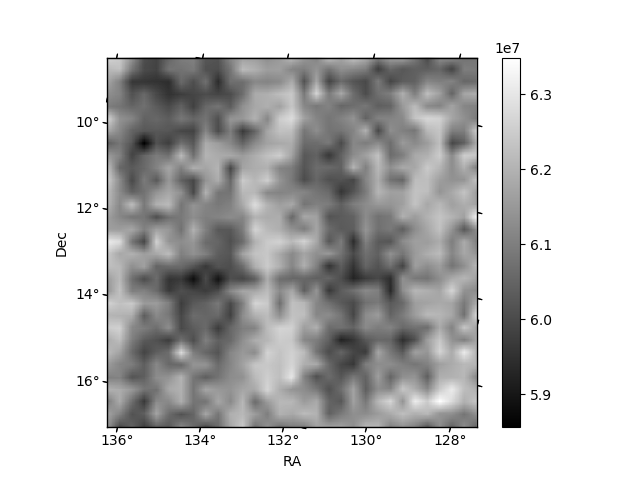
Histogram calculated using DETX and DETY for each event in the final _common_clean file
| Quadrant A | 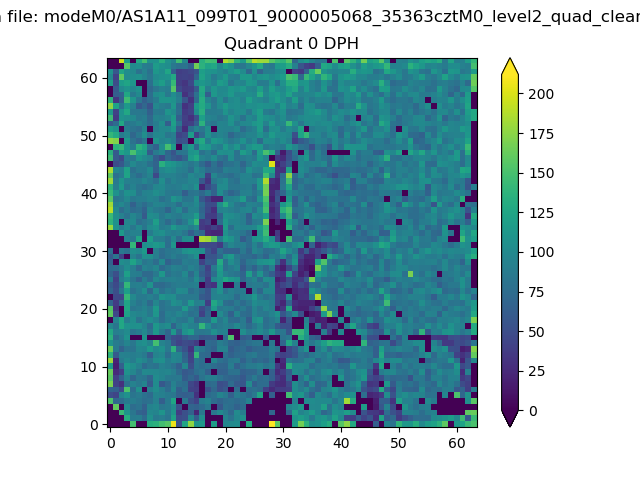 |
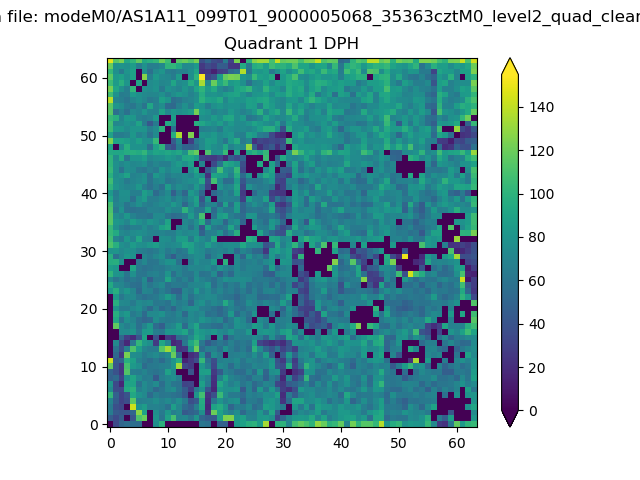 |
Quadrant B |
|---|---|---|---|
| Quadrant D | 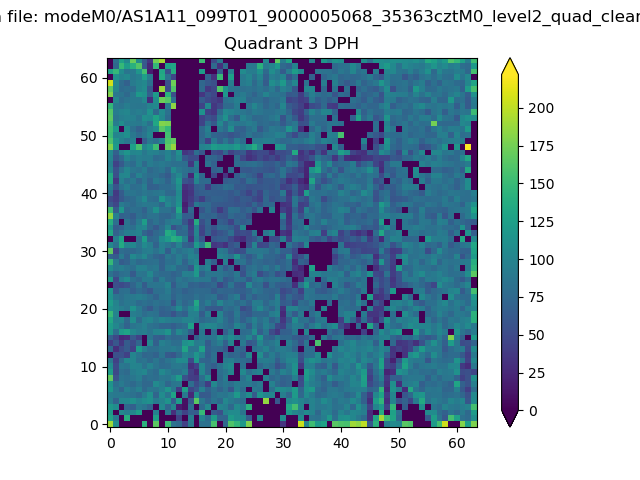 |
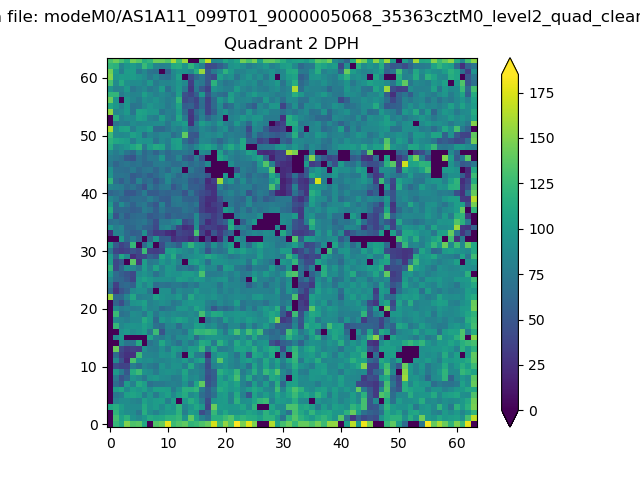 |
Quadrant C |
| Plot type | Count rate plots | Images |
|---|---|---|
| Comparison with Poisson distribution Blue bars denote a histogram of data divided into 1 sec bins. Red curve is a Poisson curve with rate = median count rate of data. |
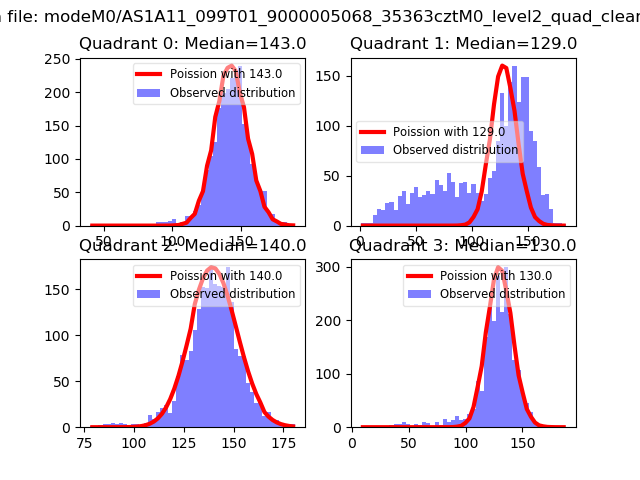 |
 |
| Quadrant-wise count rates Data is divided into 100 sec bins |
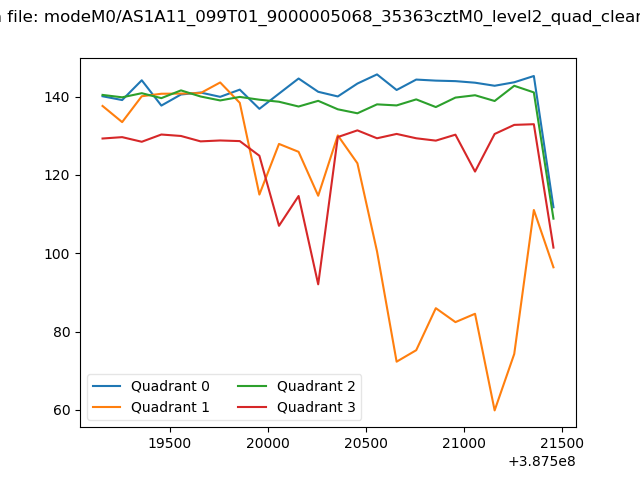 |
|
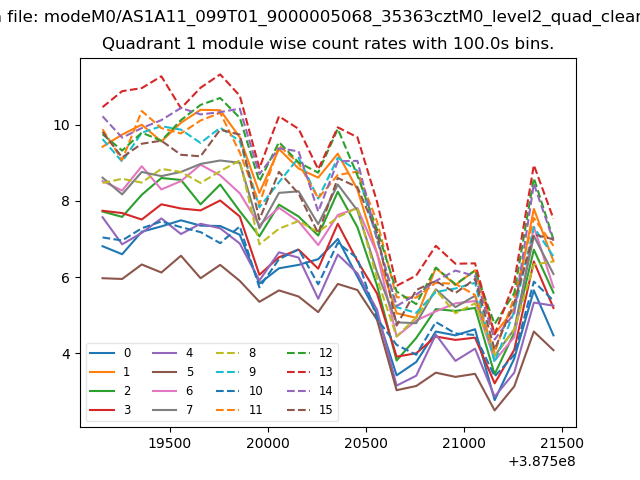
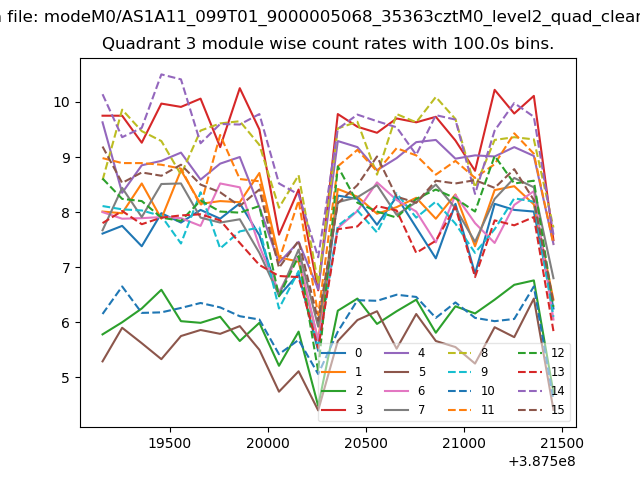
| Module-wise count rates for Quadrant A Data is divided into 100 sec bins |
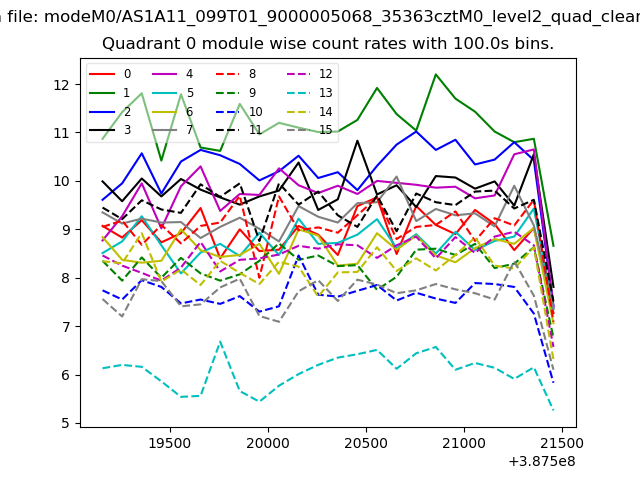 |
 |
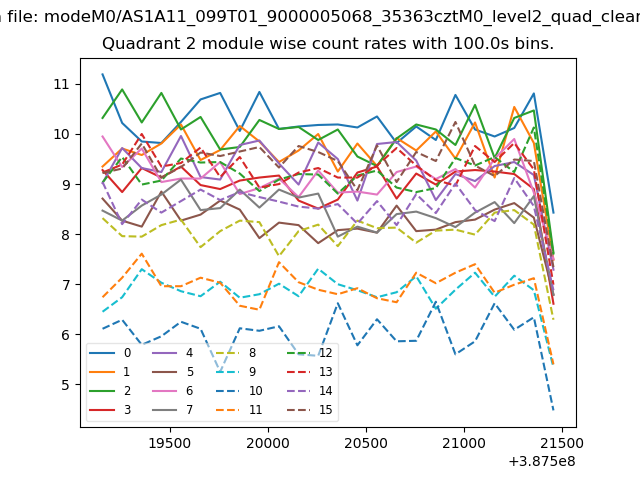
| Module-wise count rates for Quadrant B Data is divided into 100 sec bins |
 |
 |
| Module-wise count rates for Quadrant C Data is divided into 100 sec bins |
 |
 |
| Module-wise count rates for Quadrant D Data is divided into 100 sec bins |
 |
 |
| Parameter | Plot |
|---|---|
| CZT HV Monitor | 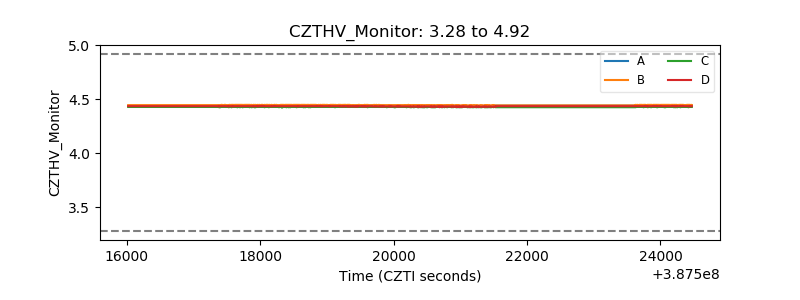 |
| D_VDD | 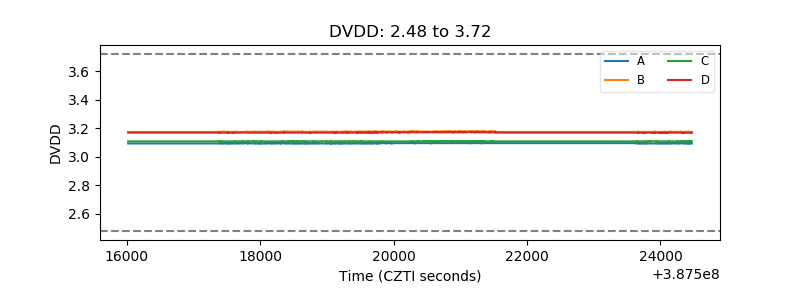 |
| Temperature 1 | 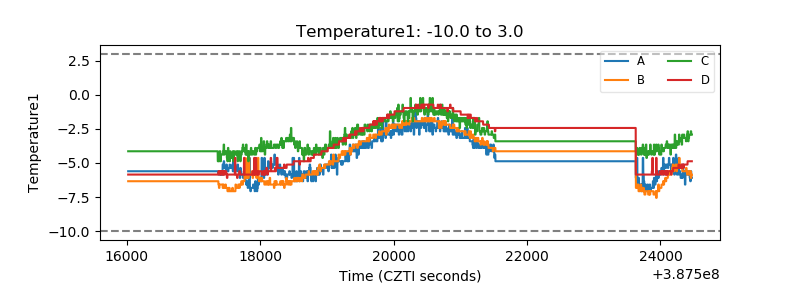 |
| Veto HV Monitor | 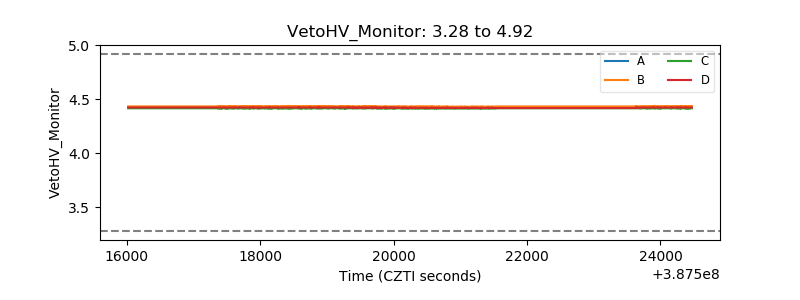 |
| Veto LLD | 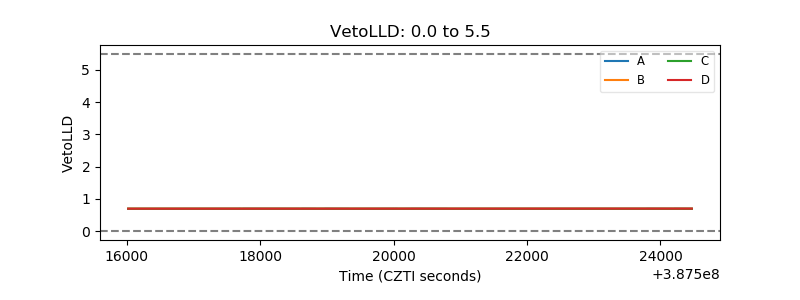 |
| Alpha Counter | 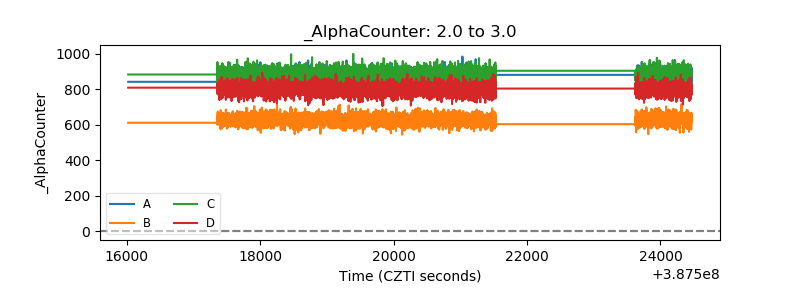 |
| _CPM_Rate | 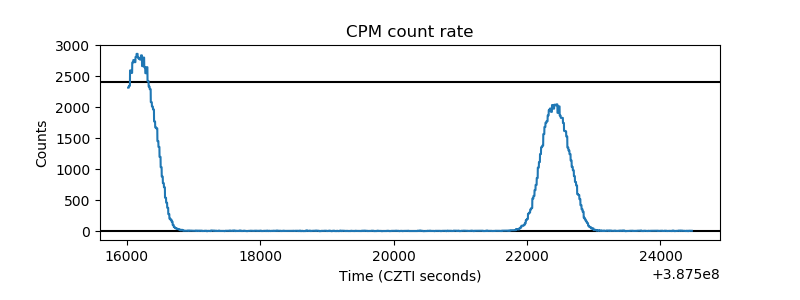 |
| CZT Counter | 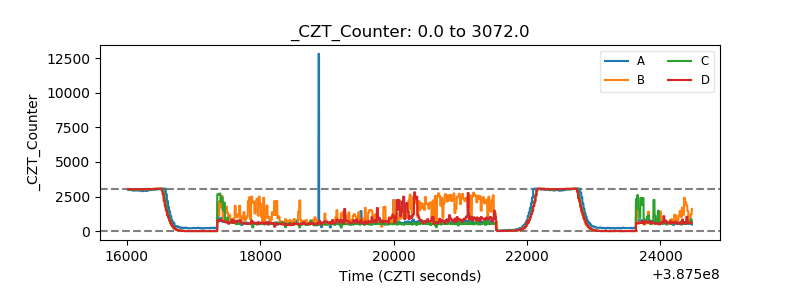 |
| +2.5 Volts monitor | 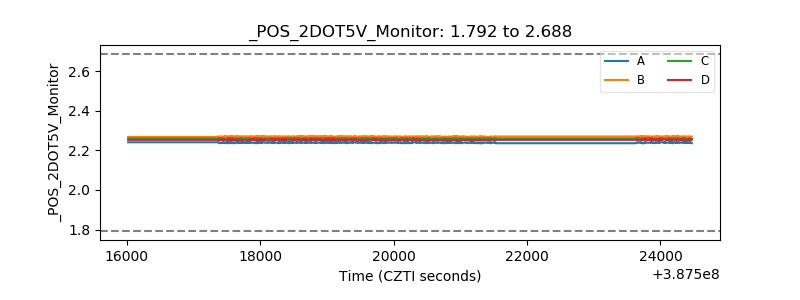 |
| +5 Volts monitor | 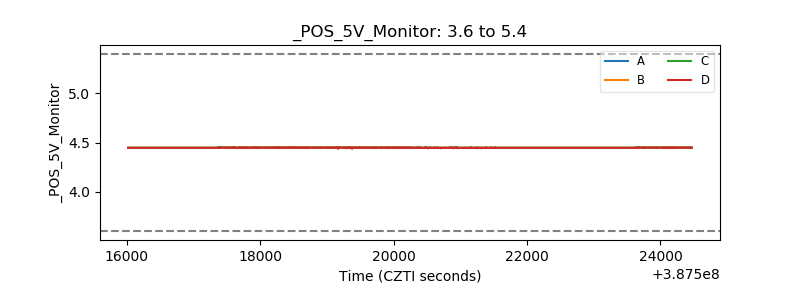 |
| _ROLL_ROT | 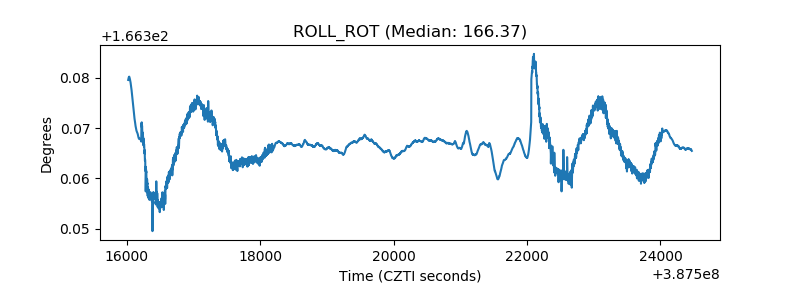 |
| _Roll_DEC | 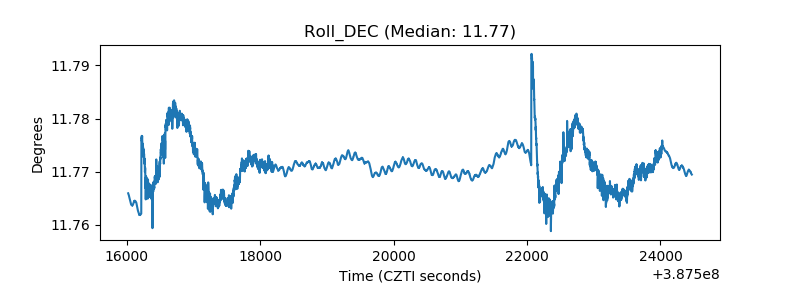 |
| _Roll_RA | 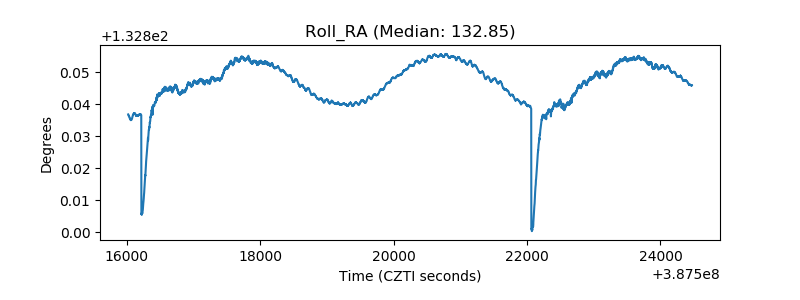 |
| Veto Counter | 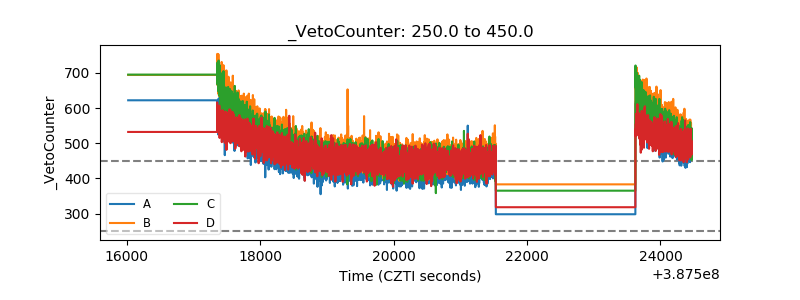 |