| Param | Original file | Final file |
|---|---|---|
| Filename | modeM0/AS1A11_099T01_9000005068_35362cztM0_level2.evt | modeM0/AS1A11_099T01_9000005068_35362cztM0_level2_quad_clean.evt |
| Size (bytes) | 608,293,440 | 44,568,000 |
| Size | 580.1 MB | 42.5 MB |
| Events in quadrant A | 2,782,492 | 282,970 |
| Events in quadrant B | 8,230,769 | 165,871 |
| Events in quadrant C | 3,133,198 | 278,498 |
| Events in quadrant D | 3,922,663 | 255,612 |
| Mode M9 | |||
|---|---|---|---|
| Quadrant | BADHDUFLAG | Total packets | Discarded packets |
| A | 0 | 26 | 0 |
| B | 0 | 26 | 0 |
| C | 0 | 26 | 0 |
| D | 0 | 27 | 0 |
| Mode M0 | |||
|---|---|---|---|
| Quadrant | BADHDUFLAG | Total packets | Discarded packets |
| A | 0 | 11205 | 3 |
| B | 0 | 28094 | 2 |
| C | 0 | 12069 | 2 |
| D | 0 | 15250 | 2 |
| Mode SS | |||
|---|---|---|---|
| Quadrant | BADHDUFLAG | Total packets | Discarded packets |
| A | 0 | 106 | 0 |
| B | 0 | 106 | 0 |
| C | 0 | 106 | 0 |
| D | 0 | 106 | 0 |
| Quadrant | Total seconds | Saturated seconds | Saturation percentage |
|---|---|---|---|
| A | 5218 | 8 | 0.153315% |
| B | 5218 | 2196 | 42.085090% |
| C | 5218 | 159 | 3.047144% |
| D | 5218 | 131 | 2.510540% |
Noise dominated data is calculated using 1-second bins in cleaned event files. If a bin has >2000 counts, and if more than 50% of those come from <1% of pixels, then it is considered to be noise-dominated and hence unusable.
| Quadrant | # 1 sec bins | Bins with >0 counts | Bins with >2000 counts | High rate bins dominated by noise | Noise dominated (total time) | Noise dominated (detector-on time) | Marked lightcurve |
|---|---|---|---|---|---|---|---|
| A | 7221 | 5219 | 1 | 1 | 0.01% | 0.02% | 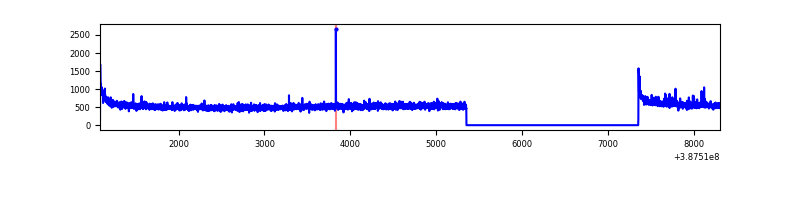 |
| B | 7221 | 5219 | 1697 | 1697 | 23.50% | 32.52% | 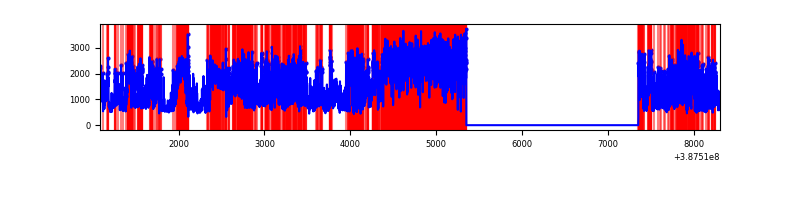 |
| C | 7221 | 5219 | 122 | 122 | 1.69% | 2.34% | 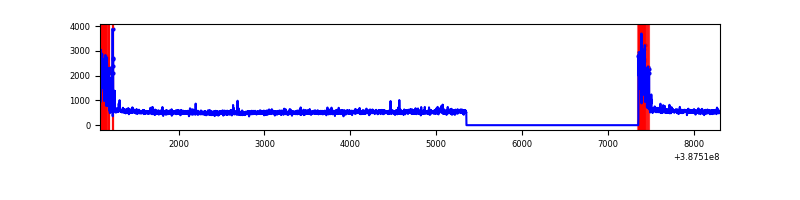 |
| D | 7221 | 5219 | 119 | 119 | 1.65% | 2.28% | 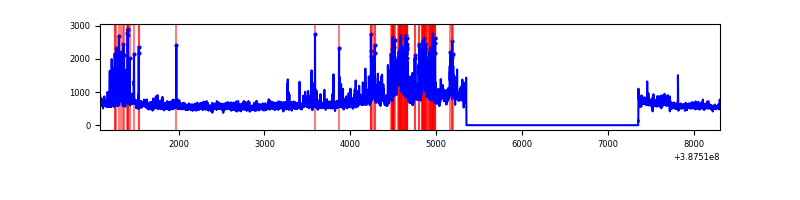 |
Top three noisy pixels from each quadrant. If the there are fewer than three noisy pixels in the level2.evt file, extra rows are filled as -1
| Pixel properties | Quadrant properties | ||||||
|---|---|---|---|---|---|---|---|
| Quadrant | DetID | PixID | Counts | Sigma | Mean | Median | Sigma |
| A | 10 | 83 | 112127 | 820.62 | 678 | 667 | 135.8 |
| A | 15 | 169 | 25534 | 183.08 | 678 | 667 | 135.8 |
| A | 13 | 6 | 11682 | 81.1 | 678 | 667 | 135.8 |
| B | 4 | 251 | 5038117 | 48948.93 | 539 | 526 | 102.9 |
| B | 5 | 236 | 784527 | 7617.93 | 539 | 526 | 102.9 |
| B | 5 | 172 | 234774 | 2276.13 | 539 | 526 | 102.9 |
| C | 0 | 10 | 357856 | 2418.11 | 639 | 644 | 147.7 |
| C | 15 | 214 | 216350 | 1460.2 | 639 | 644 | 147.7 |
| C | 9 | 187 | 56311 | 376.83 | 639 | 644 | 147.7 |
| D | 8 | 195 | 794311 | 5040.68 | 641 | 624 | 157.5 |
| D | 12 | 233 | 299075 | 1895.45 | 641 | 624 | 157.5 |
| D | 2 | 250 | 84934 | 535.45 | 641 | 624 | 157.5 |
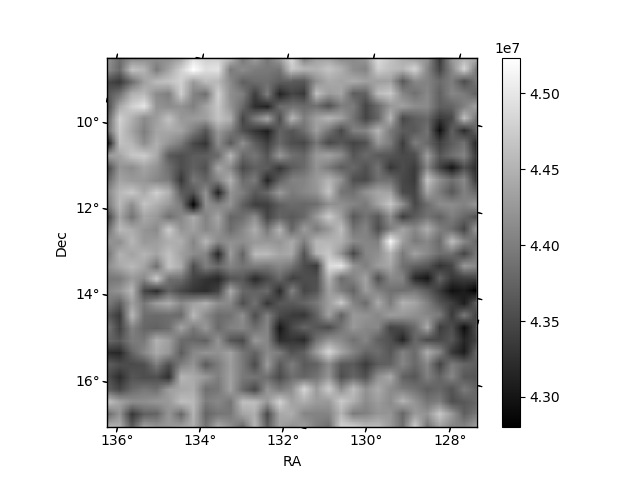
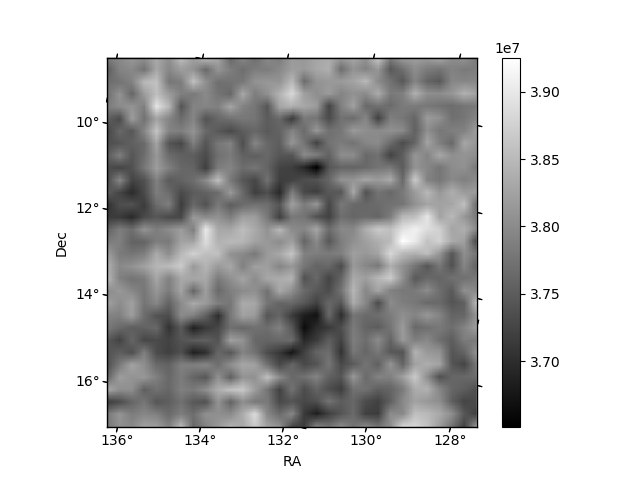
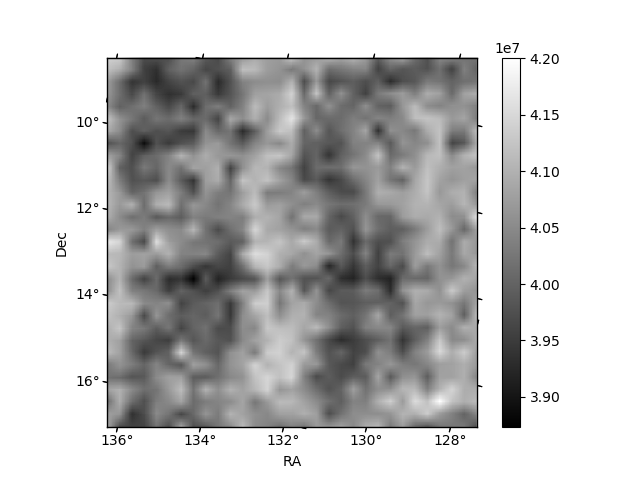
Histogram calculated using DETX and DETY for each event in the final _common_clean file
| Quadrant A | 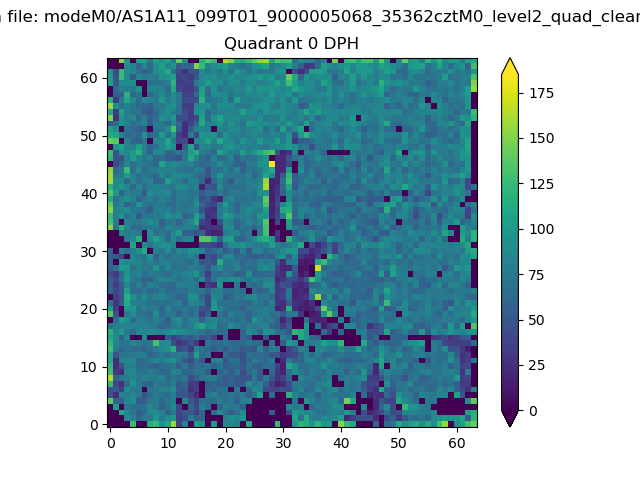 |
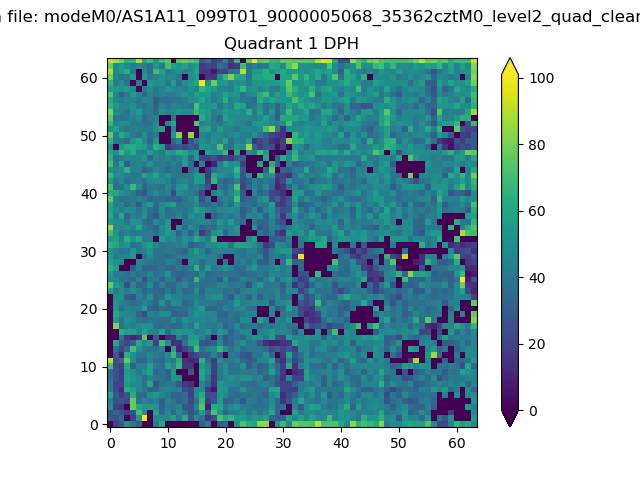 |
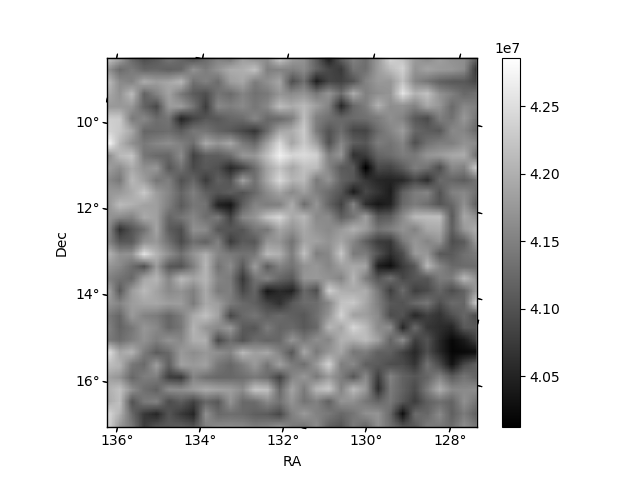
Quadrant B |
|---|---|---|---|
| Quadrant D | 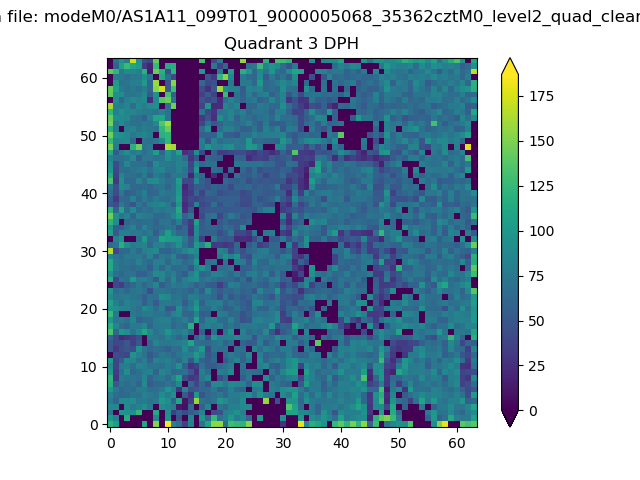 |
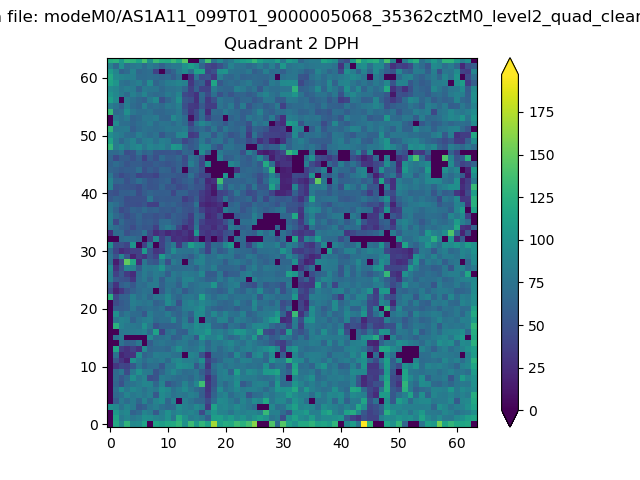 |
Quadrant C |
| Plot type | Count rate plots | Images |
|---|---|---|
| Comparison with Poisson distribution Blue bars denote a histogram of data divided into 1 sec bins. Red curve is a Poisson curve with rate = median count rate of data. |
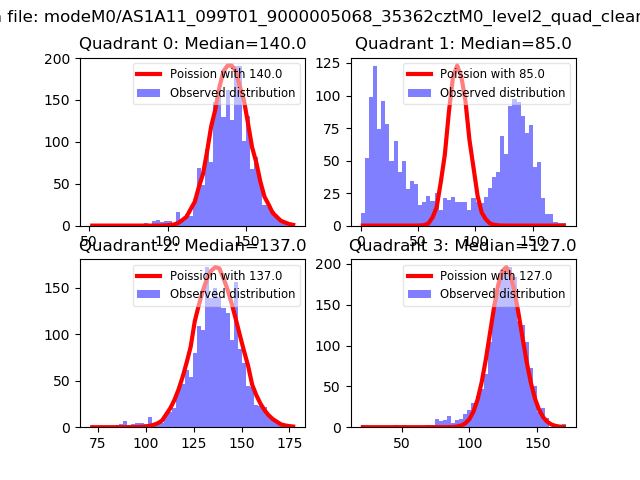 |
 |
| Quadrant-wise count rates Data is divided into 100 sec bins |
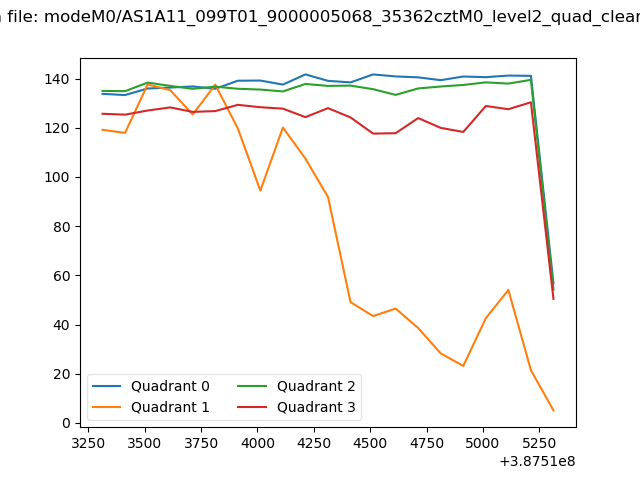 |
|
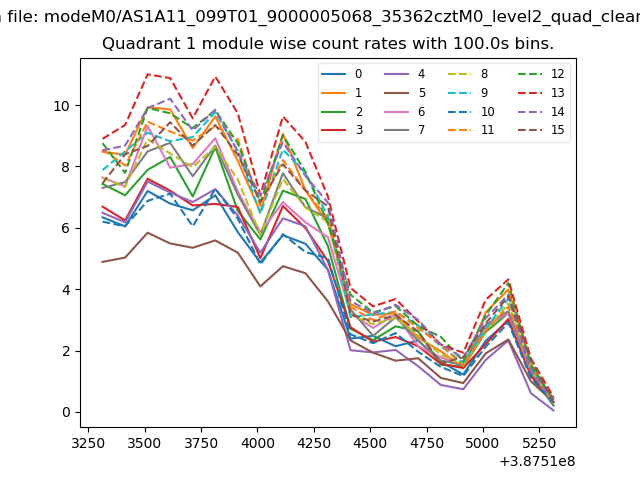
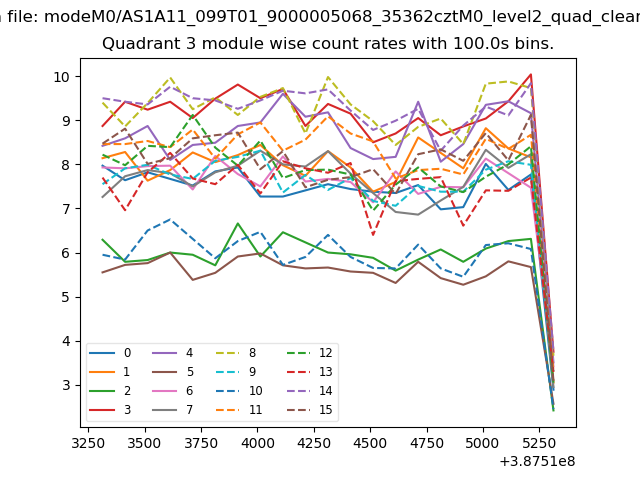
| Module-wise count rates for Quadrant A Data is divided into 100 sec bins |
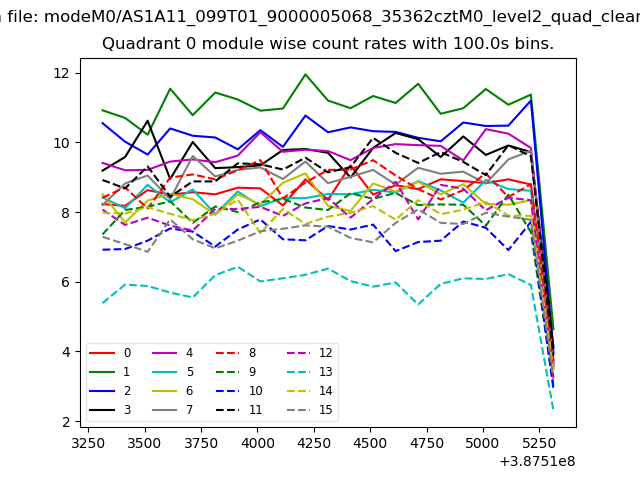 |
 |
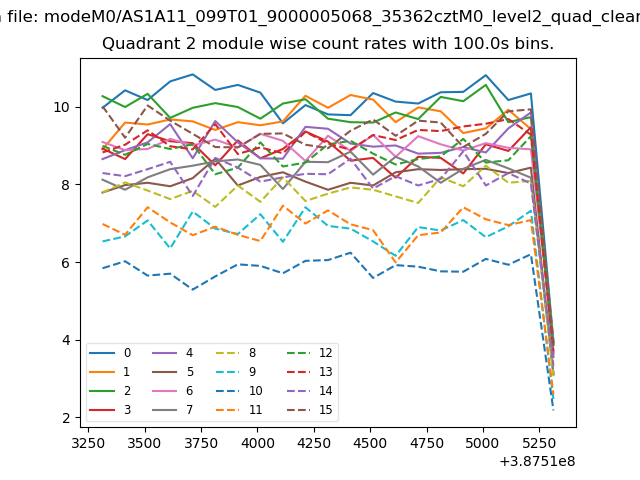
| Module-wise count rates for Quadrant B Data is divided into 100 sec bins |
 |
 |
| Module-wise count rates for Quadrant C Data is divided into 100 sec bins |
 |
 |
| Module-wise count rates for Quadrant D Data is divided into 100 sec bins |
 |
 |
| Parameter | Plot |
|---|---|
| CZT HV Monitor | 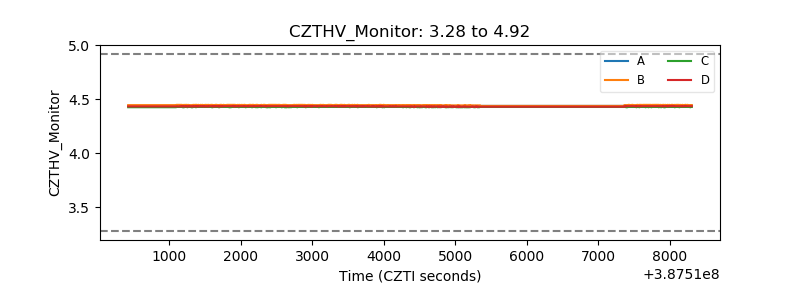 |
| D_VDD | 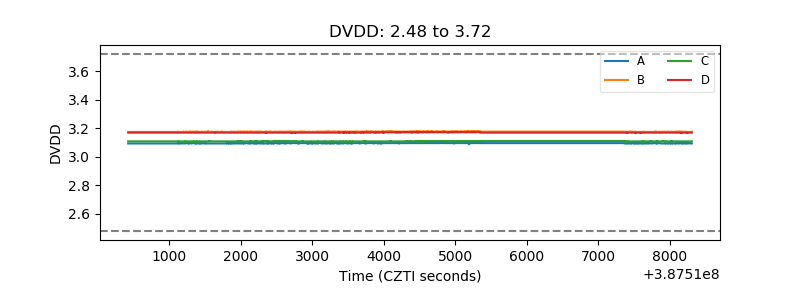 |
| Temperature 1 | 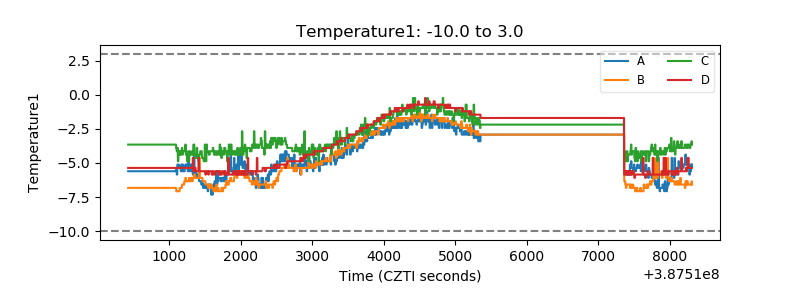 |
| Veto HV Monitor | 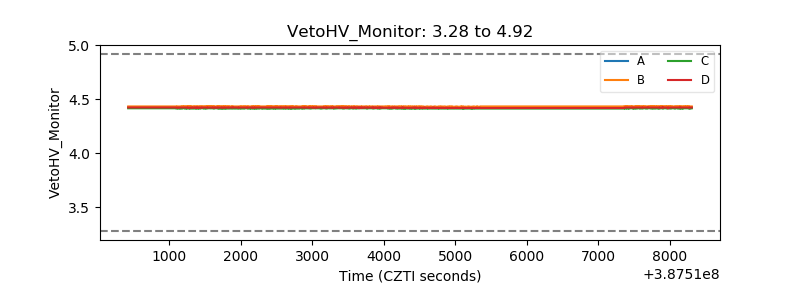 |
| Veto LLD | 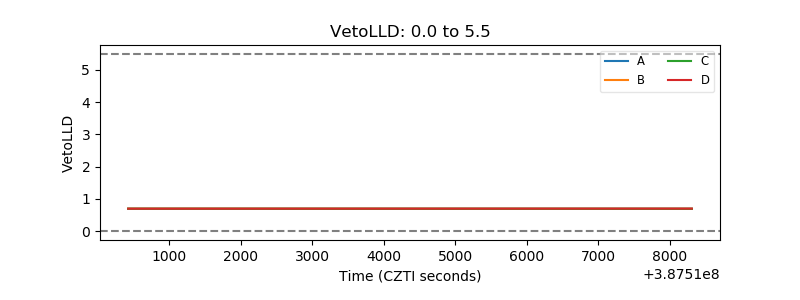 |
| Alpha Counter | 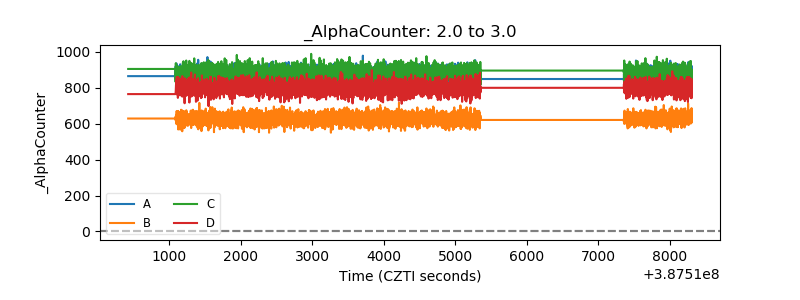 |
| _CPM_Rate | 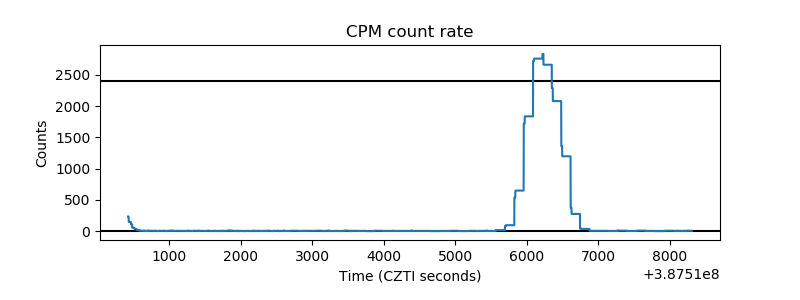 |
| CZT Counter | 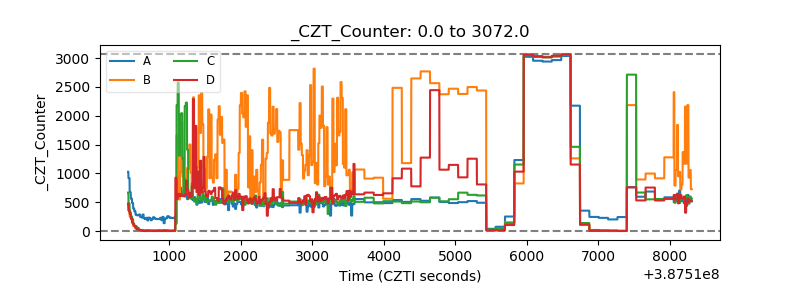 |
| +2.5 Volts monitor | 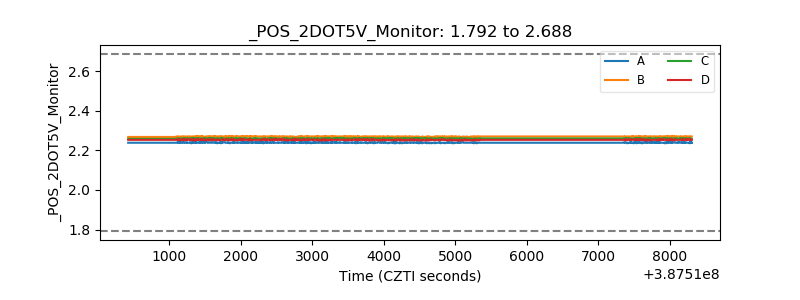 |
| +5 Volts monitor | 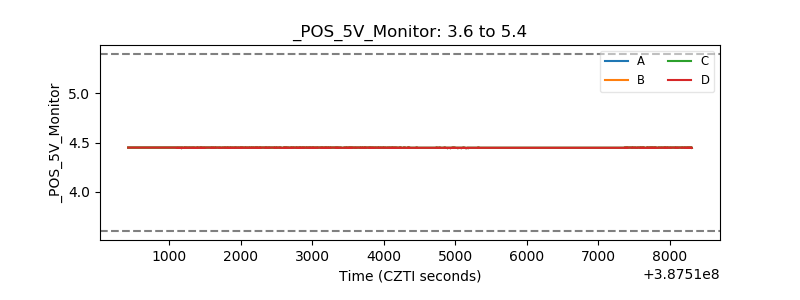 |
| _ROLL_ROT | 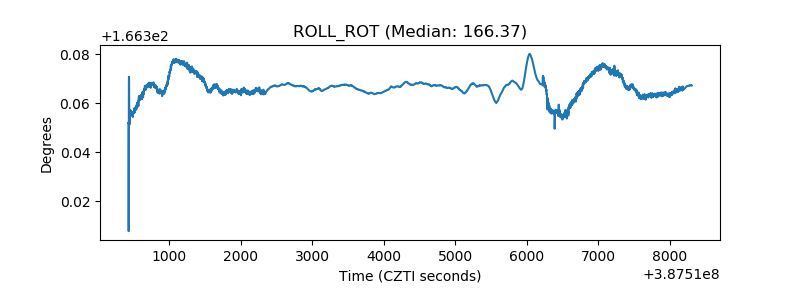 |
| _Roll_DEC | 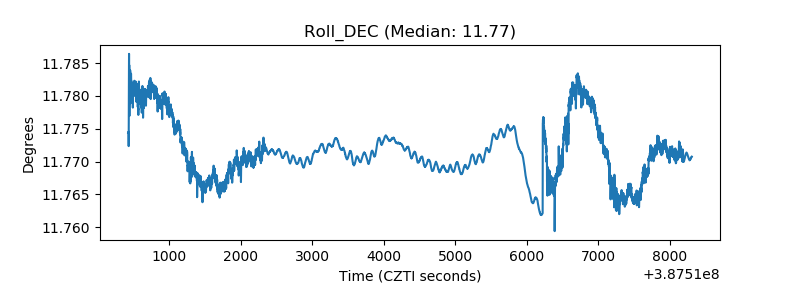 |
| _Roll_RA | 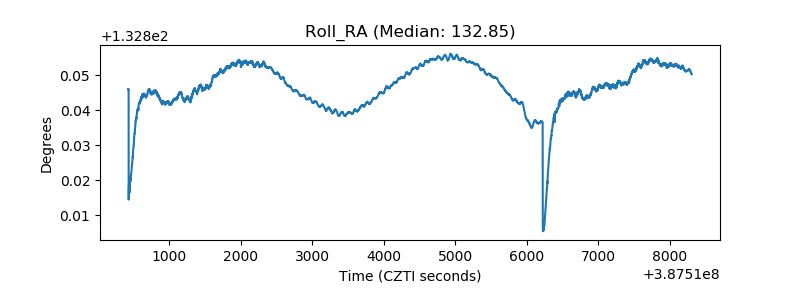 |
| Veto Counter | 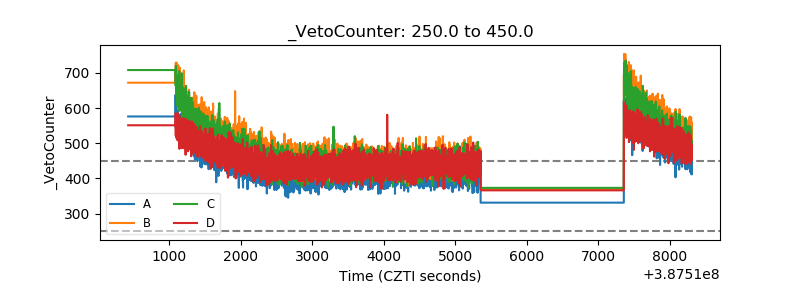 |