| Param | Original file | Final file |
|---|---|---|
| Filename | modeM0/AS1A11_099T01_9000005068_35361cztM0_level2.evt | modeM0/AS1A11_099T01_9000005068_35361cztM0_level2_quad_clean.evt |
| Size (bytes) | 632,016,000 | 47,018,880 |
| Size | 602.7 MB | 44.8 MB |
| Events in quadrant A | 3,641,955 | 280,312 |
| Events in quadrant B | 8,674,847 | 226,380 |
| Events in quadrant C | 3,102,621 | 279,556 |
| Events in quadrant D | 3,364,825 | 267,671 |
| Mode M9 | |||
|---|---|---|---|
| Quadrant | BADHDUFLAG | Total packets | Discarded packets |
| A | 0 | 29 | 0 |
| B | 0 | 29 | 0 |
| C | 0 | 29 | 0 |
| D | 0 | 30 | 0 |
| Mode M0 | |||
|---|---|---|---|
| Quadrant | BADHDUFLAG | Total packets | Discarded packets |
| A | 0 | 14065 | 3 |
| B | 0 | 29463 | 2 |
| C | 0 | 12098 | 2 |
| D | 0 | 13647 | 2 |
| Mode SS | |||
|---|---|---|---|
| Quadrant | BADHDUFLAG | Total packets | Discarded packets |
| A | 0 | 108 | 0 |
| B | 0 | 108 | 0 |
| C | 0 | 108 | 0 |
| D | 0 | 108 | 0 |
| Quadrant | Total seconds | Saturated seconds | Saturation percentage |
|---|---|---|---|
| A | 5264 | 342 | 6.496960% |
| B | 5264 | 2375 | 45.117781% |
| C | 5264 | 147 | 2.792553% |
| D | 5264 | 77 | 1.462766% |
Noise dominated data is calculated using 1-second bins in cleaned event files. If a bin has >2000 counts, and if more than 50% of those come from <1% of pixels, then it is considered to be noise-dominated and hence unusable.
| Quadrant | # 1 sec bins | Bins with >0 counts | Bins with >2000 counts | High rate bins dominated by noise | Noise dominated (total time) | Noise dominated (detector-on time) | Marked lightcurve |
|---|---|---|---|---|---|---|---|
| A | 7146 | 5265 | 286 | 286 | 4.00% | 5.43% | 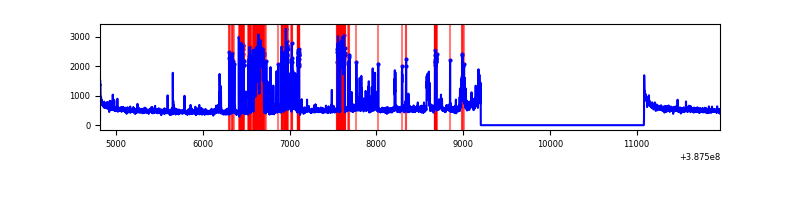 |
| B | 7146 | 5265 | 2013 | 2013 | 28.17% | 38.23% | 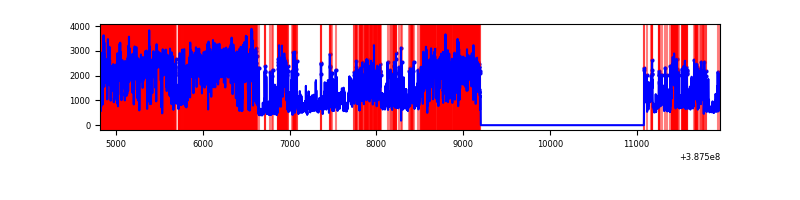 |
| C | 7146 | 5265 | 126 | 126 | 1.76% | 2.39% | 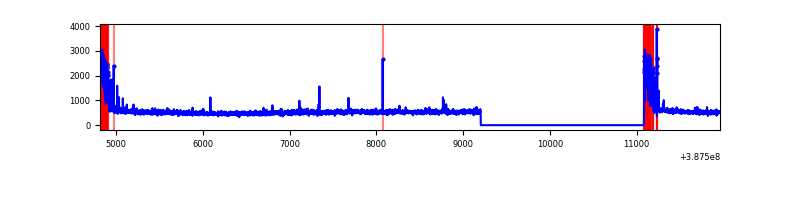 |
| D | 7146 | 5265 | 55 | 55 | 0.77% | 1.04% | 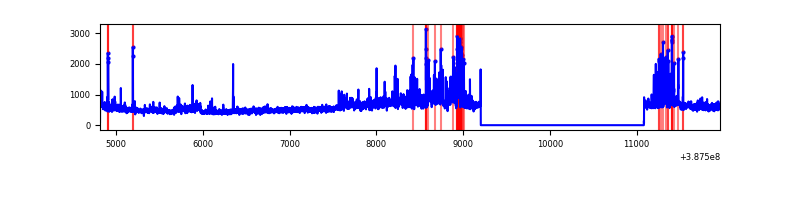 |
Top three noisy pixels from each quadrant. If the there are fewer than three noisy pixels in the level2.evt file, extra rows are filled as -1
| Pixel properties | Quadrant properties | ||||||
|---|---|---|---|---|---|---|---|
| Quadrant | DetID | PixID | Counts | Sigma | Mean | Median | Sigma |
| A | 15 | 169 | 1040136 | 8073.57 | 639 | 628 | 128.8 |
| A | 10 | 83 | 107462 | 829.75 | 639 | 628 | 128.8 |
| A | 13 | 6 | 12357 | 91.1 | 639 | 628 | 128.8 |
| B | 4 | 251 | 5902553 | 58758.02 | 521 | 509 | 100.4 |
| B | 5 | 236 | 373634 | 3714.66 | 521 | 509 | 100.4 |
| B | 5 | 172 | 261553 | 2598.83 | 521 | 509 | 100.4 |
| C | 0 | 10 | 363740 | 2513.64 | 623 | 629 | 144.5 |
| C | 15 | 214 | 219204 | 1513.09 | 623 | 629 | 144.5 |
| C | 9 | 187 | 58345 | 399.54 | 623 | 629 | 144.5 |
| D | 8 | 195 | 535165 | 3448.42 | 624 | 606 | 155.0 |
| D | 10 | 118 | 109985 | 705.6 | 624 | 606 | 155.0 |
| D | 2 | 250 | 82692 | 529.53 | 624 | 606 | 155.0 |
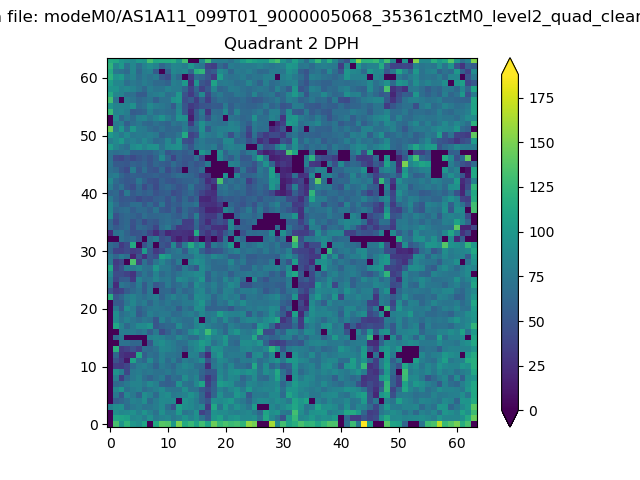
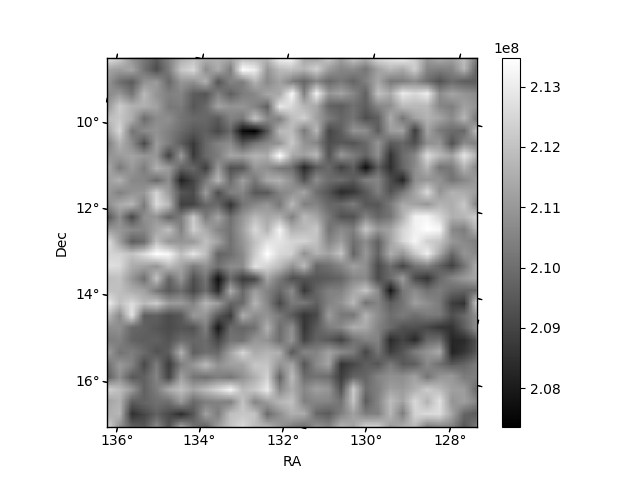
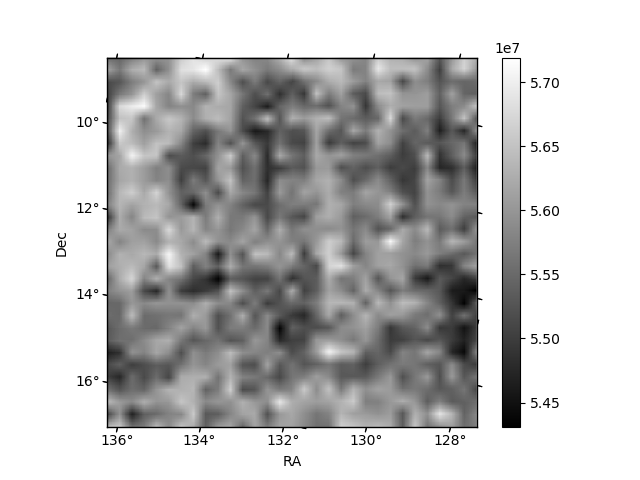
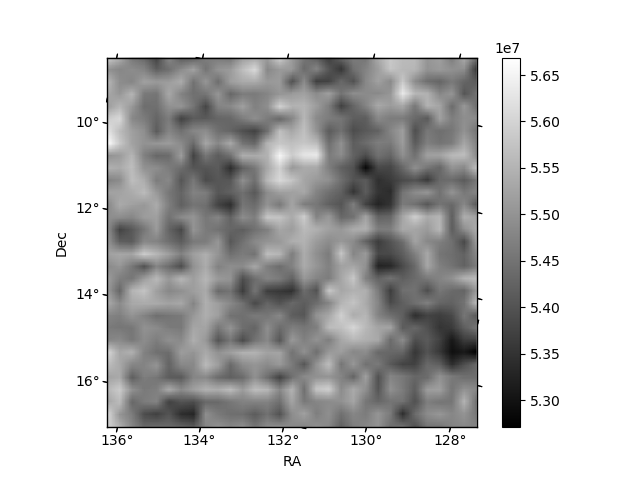
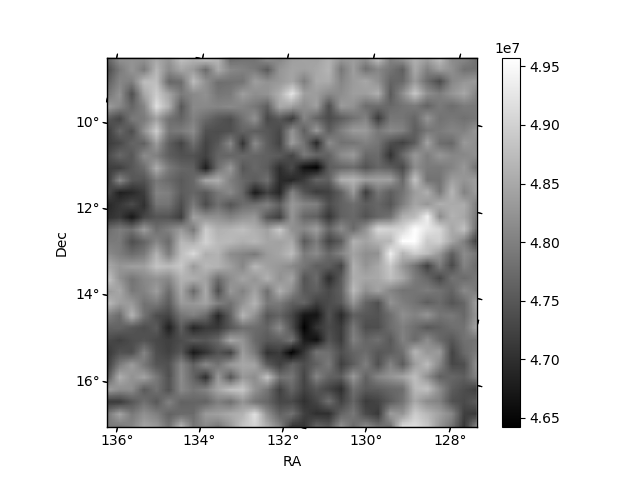
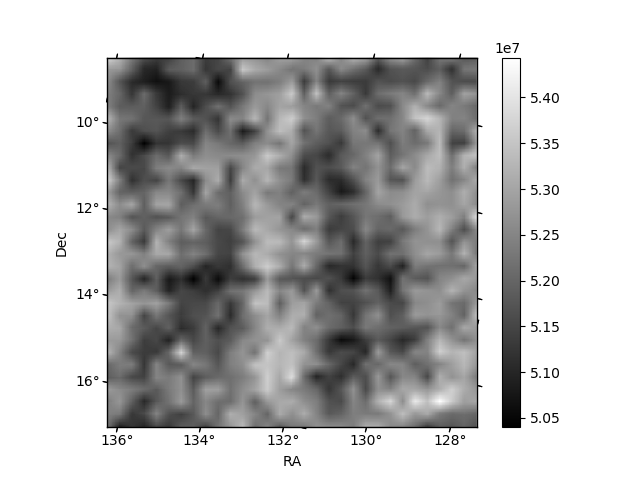
Histogram calculated using DETX and DETY for each event in the final _common_clean file
| Quadrant A | 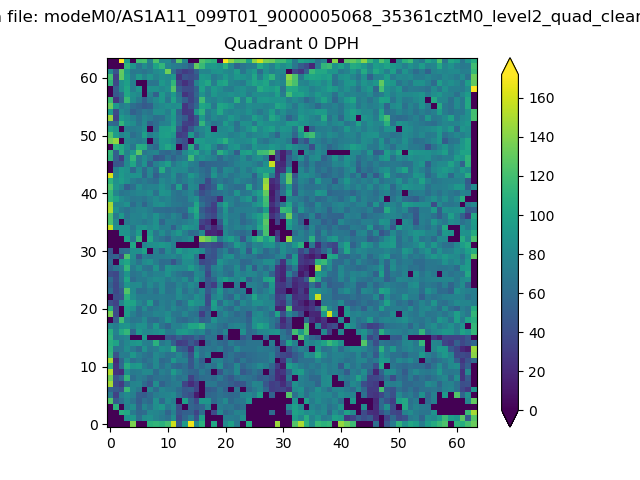 |
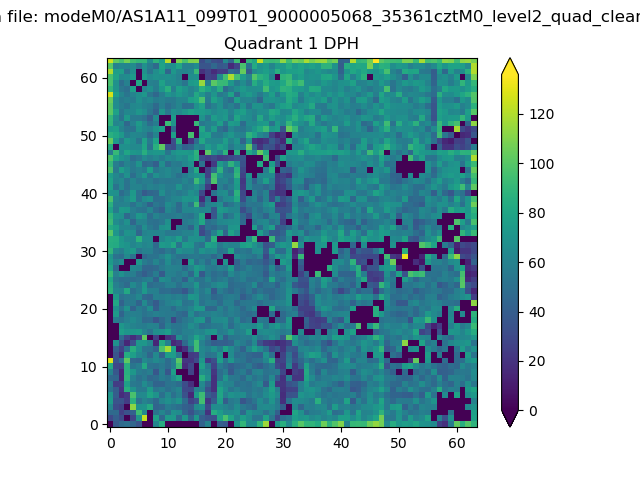 |
Quadrant B |
|---|---|---|---|
| Quadrant D | 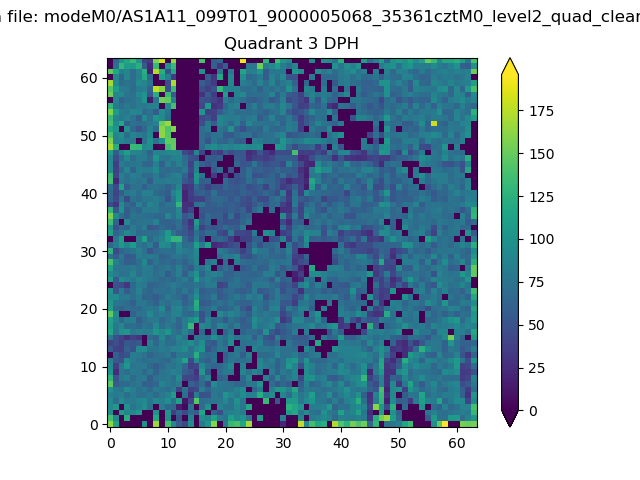 |
 |
Quadrant C |
| Plot type | Count rate plots | Images |
|---|---|---|
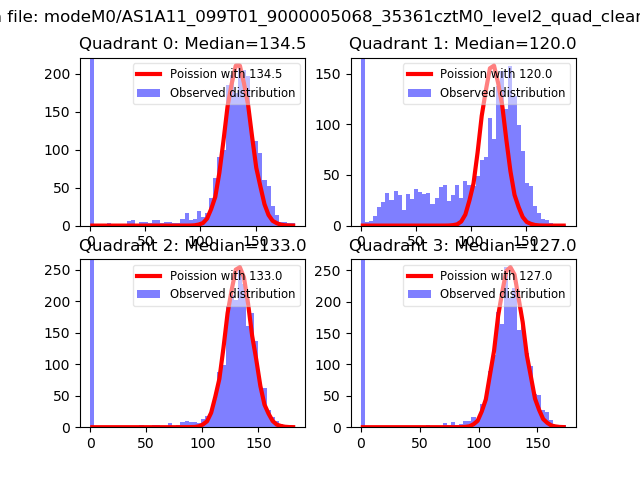
| Comparison with Poisson distribution Blue bars denote a histogram of data divided into 1 sec bins. Red curve is a Poisson curve with rate = median count rate of data. |
 |
 |
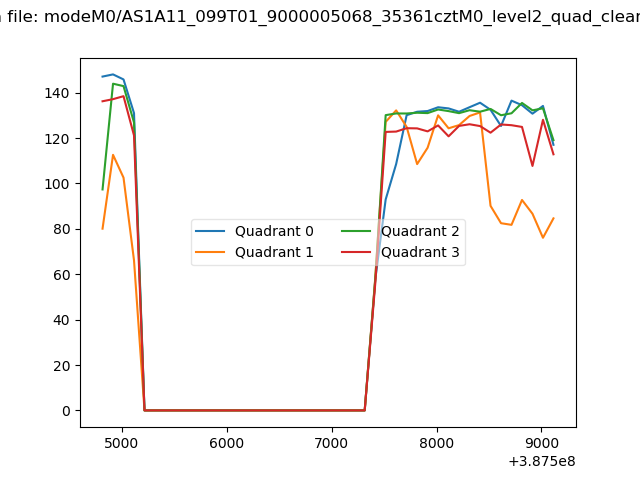
| Quadrant-wise count rates Data is divided into 100 sec bins |
 |
|
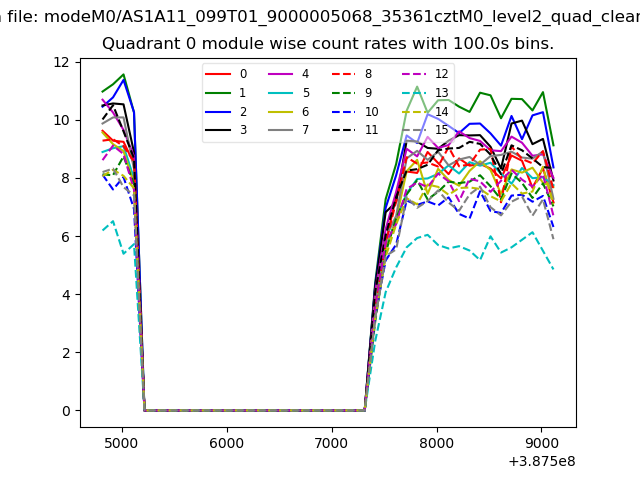
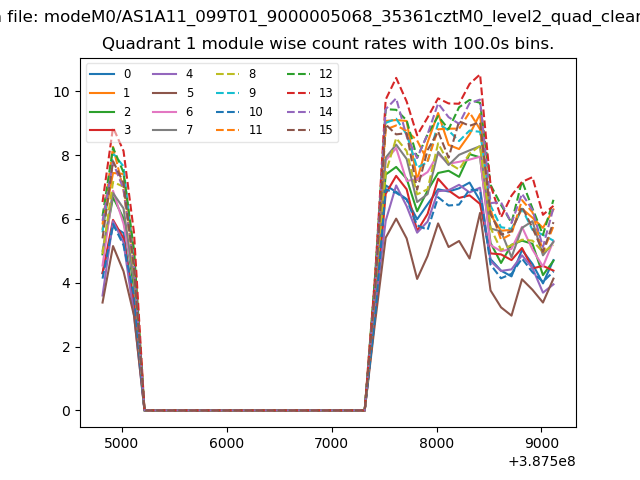
| Module-wise count rates for Quadrant A Data is divided into 100 sec bins |
 |
 |
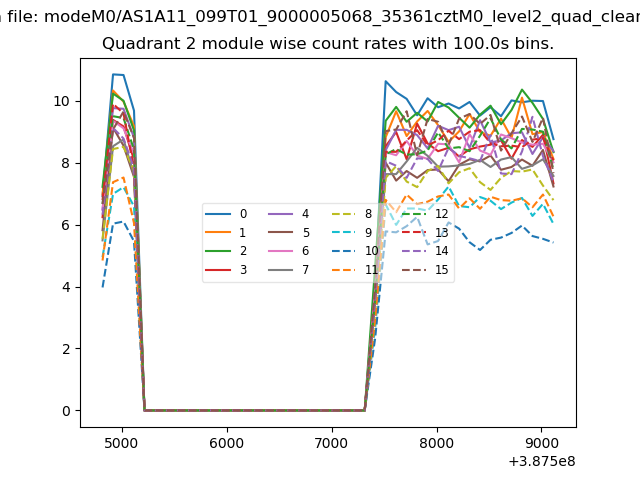
| Module-wise count rates for Quadrant B Data is divided into 100 sec bins |
 |
 |
| Module-wise count rates for Quadrant C Data is divided into 100 sec bins |
 |
 |
| Module-wise count rates for Quadrant D Data is divided into 100 sec bins |
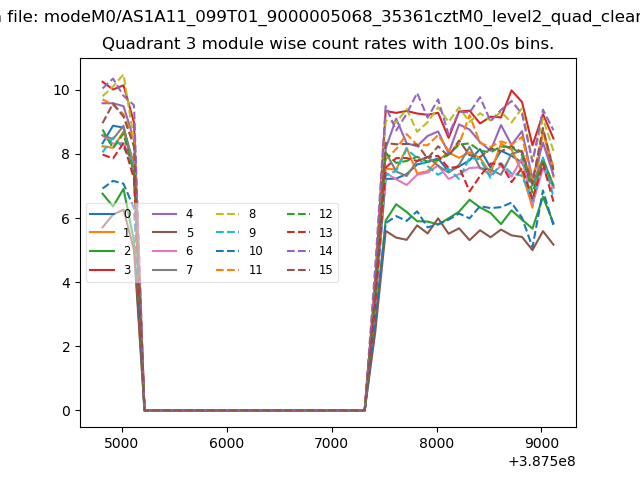 |
 |
| Parameter | Plot |
|---|---|
| CZT HV Monitor | 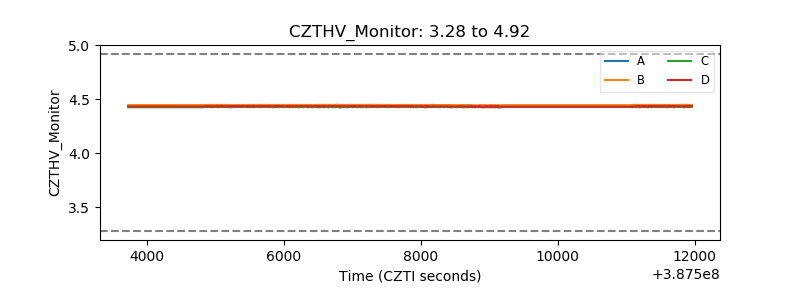 |
| D_VDD | 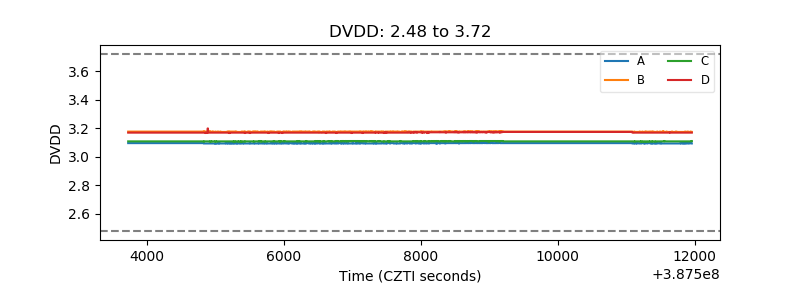 |
| Temperature 1 | 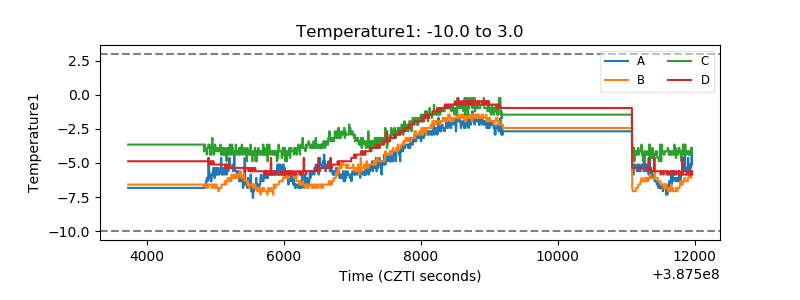 |
| Veto HV Monitor | 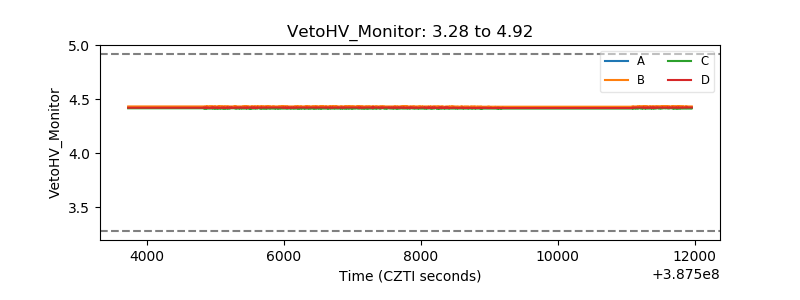 |
| Veto LLD | 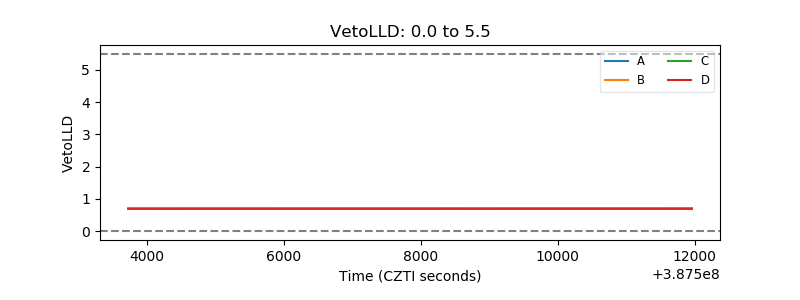 |
| Alpha Counter | 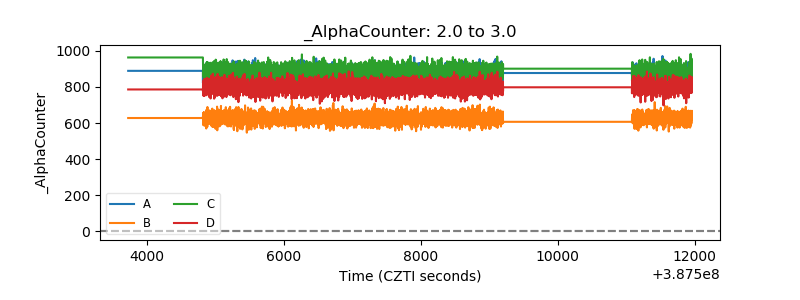 |
| _CPM_Rate | 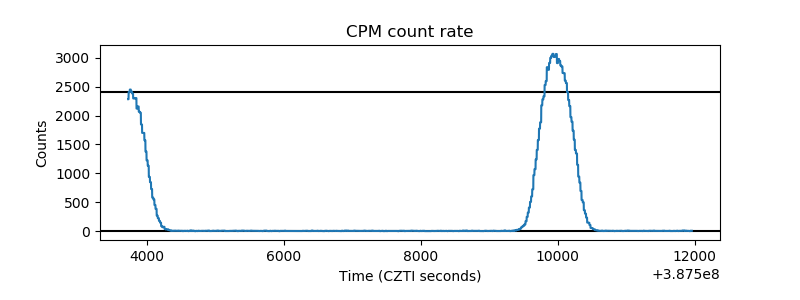 |
| CZT Counter | 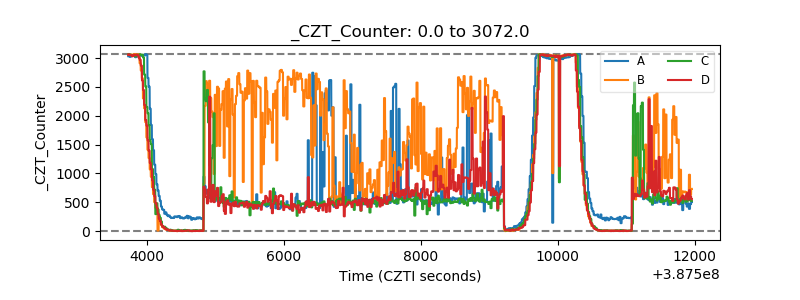 |
| +2.5 Volts monitor | 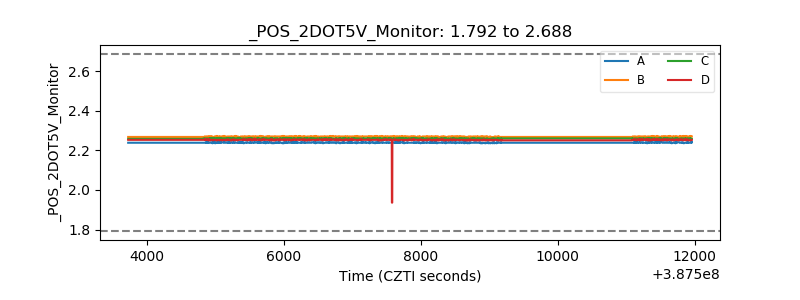 |
| +5 Volts monitor | 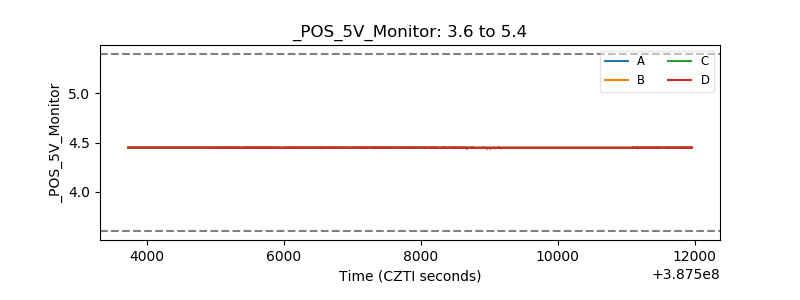 |
| _ROLL_ROT | 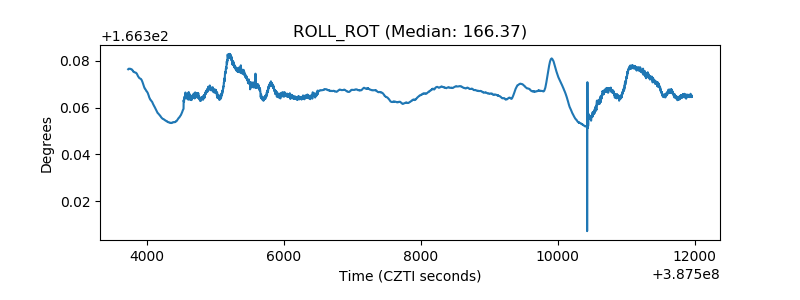 |
| _Roll_DEC | 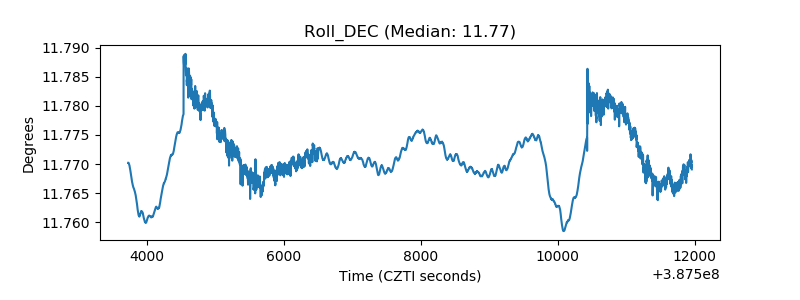 |
| _Roll_RA | 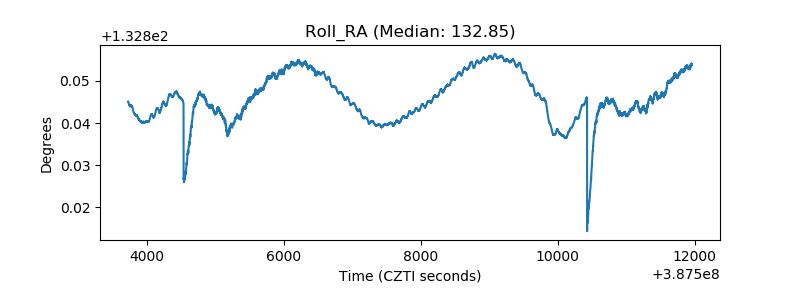 |
| Veto Counter |  |