| Param | Original file | Final file |
|---|---|---|
| Filename | modeM0/AS1A11_093T01_9000005064_35353cztM0_level2.evt | modeM0/AS1A11_093T01_9000005064_35353cztM0_level2_quad_clean.evt |
| Size (bytes) | 229,861,440 | 26,352,000 |
| Size | 219.2 MB | 25.1 MB |
| Events in quadrant A | 1,476,888 | 151,855 |
| Events in quadrant B | 1,654,719 | 153,880 |
| Events in quadrant C | 1,613,293 | 149,332 |
| Events in quadrant D | 2,025,458 | 142,913 |
| Mode M0 | |||
|---|---|---|---|
| Quadrant | BADHDUFLAG | Total packets | Discarded packets |
| A | 0 | 6176 | 1 |
| B | 0 | 6690 | 1 |
| C | 0 | 6443 | 1 |
| D | 0 | 7862 | 1 |
| Mode SS | |||
|---|---|---|---|
| Quadrant | BADHDUFLAG | Total packets | Discarded packets |
| A | 0 | 54 | 0 |
| B | 0 | 54 | 0 |
| C | 0 | 54 | 0 |
| D | 0 | 54 | 0 |
| Mode M9 | |||
|---|---|---|---|
| Quadrant | BADHDUFLAG | Total packets | Discarded packets |
| A | 0 | 11 | 0 |
| B | 0 | 11 | 0 |
| C | 0 | 11 | 0 |
| D | 0 | 12 | 0 |
| Quadrant | Total seconds | Saturated seconds | Saturation percentage |
|---|---|---|---|
| A | 2792 | 86 | 3.080229% |
| B | 2792 | 86 | 3.080229% |
| C | 2792 | 69 | 2.471347% |
| D | 2792 | 107 | 3.832378% |
Noise dominated data is calculated using 1-second bins in cleaned event files. If a bin has >2000 counts, and if more than 50% of those come from <1% of pixels, then it is considered to be noise-dominated and hence unusable.
| Quadrant | # 1 sec bins | Bins with >0 counts | Bins with >2000 counts | High rate bins dominated by noise | Noise dominated (total time) | Noise dominated (detector-on time) | Marked lightcurve |
|---|---|---|---|---|---|---|---|
| A | 2792 | 2792 | 60 | 60 | 2.15% | 2.15% | 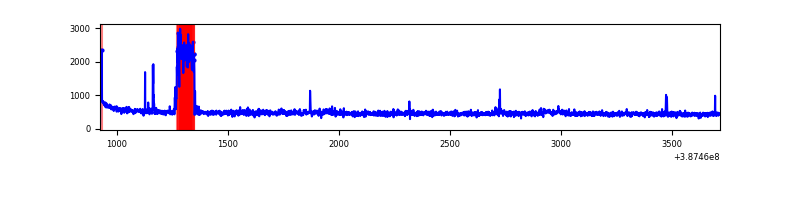 |
| B | 2792 | 2792 | 35 | 35 | 1.25% | 1.25% | 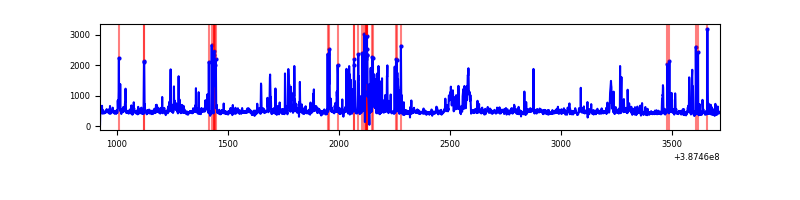 |
| C | 2792 | 2792 | 59 | 59 | 2.11% | 2.11% |  |
| D | 2792 | 2792 | 85 | 85 | 3.04% | 3.04% | 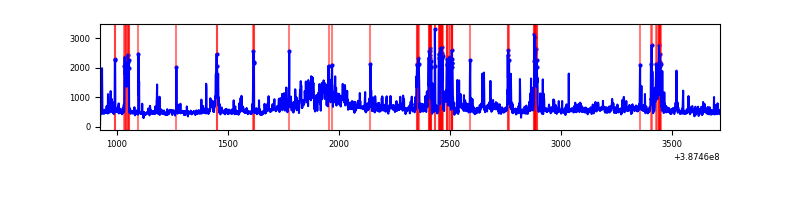 |
Top three noisy pixels from each quadrant. If the there are fewer than three noisy pixels in the level2.evt file, extra rows are filled as -1
| Pixel properties | Quadrant properties | ||||||
|---|---|---|---|---|---|---|---|
| Quadrant | DetID | PixID | Counts | Sigma | Mean | Median | Sigma |
| A | 15 | 169 | 174087 | 2659.43 | 316 | 309 | 65.3 |
| A | 10 | 83 | 58580 | 891.76 | 316 | 309 | 65.3 |
| A | 15 | 174 | 5977 | 86.74 | 316 | 309 | 65.3 |
| B | 5 | 236 | 169600 | 2769.14 | 312 | 304 | 61.1 |
| B | 5 | 172 | 137155 | 2238.44 | 312 | 304 | 61.1 |
| B | 0 | 155 | 29713 | 481.04 | 312 | 304 | 61.1 |
| C | 0 | 10 | 141343 | 1957.27 | 306 | 307 | 72.1 |
| C | 15 | 214 | 114253 | 1581.32 | 306 | 307 | 72.1 |
| C | 1 | 23 | 73817 | 1020.16 | 306 | 307 | 72.1 |
| D | 8 | 195 | 241819 | 3176.58 | 308 | 298 | 76.0 |
| D | 12 | 235 | 168177 | 2208.01 | 308 | 298 | 76.0 |
| D | 10 | 118 | 148641 | 1951.07 | 308 | 298 | 76.0 |
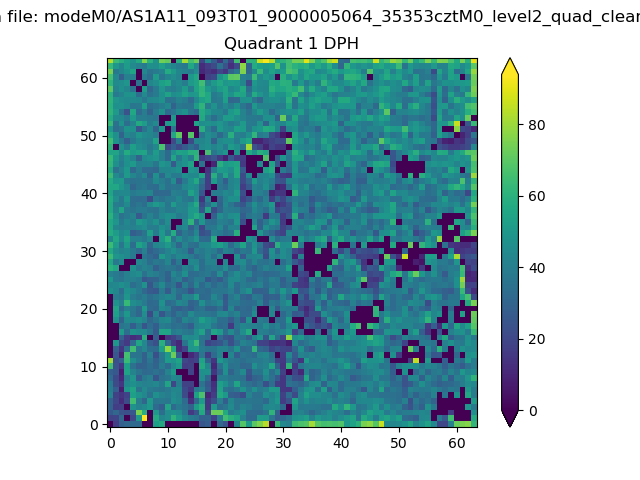
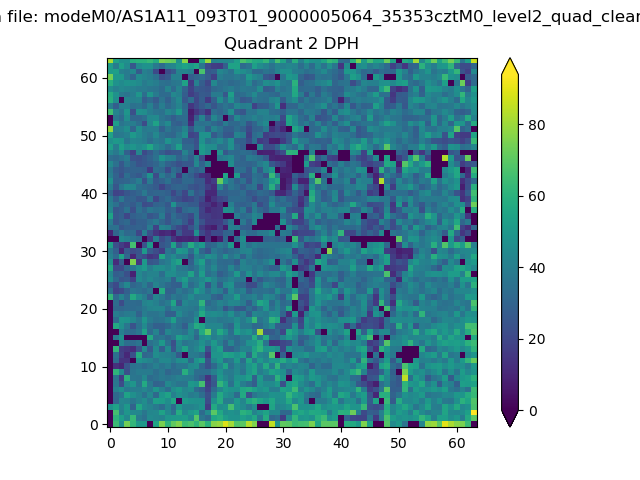
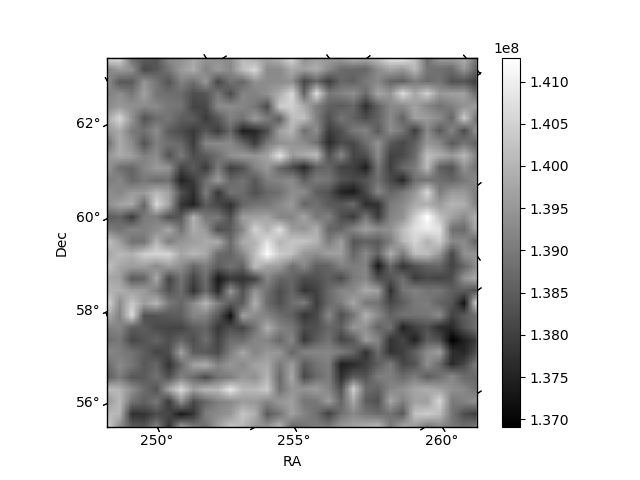
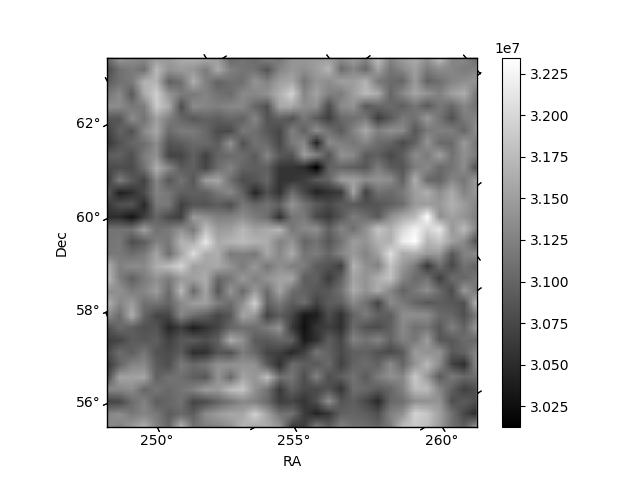
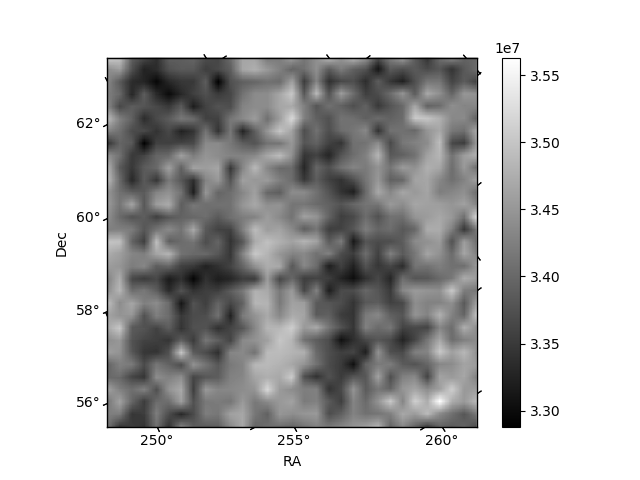
Histogram calculated using DETX and DETY for each event in the final _common_clean file
| Quadrant A | 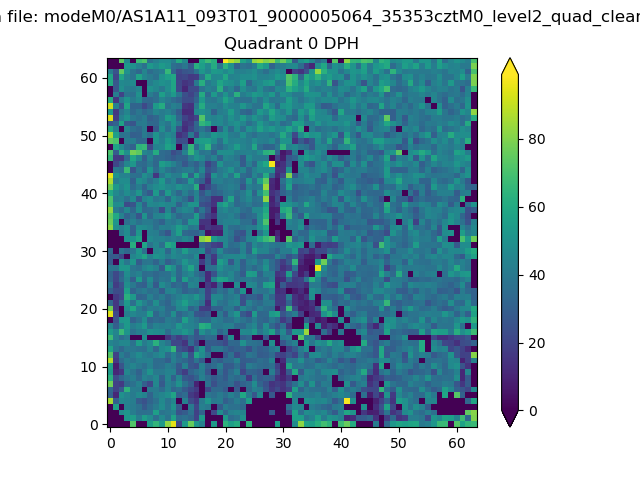 |
 |
Quadrant B |
|---|---|---|---|
| Quadrant D | 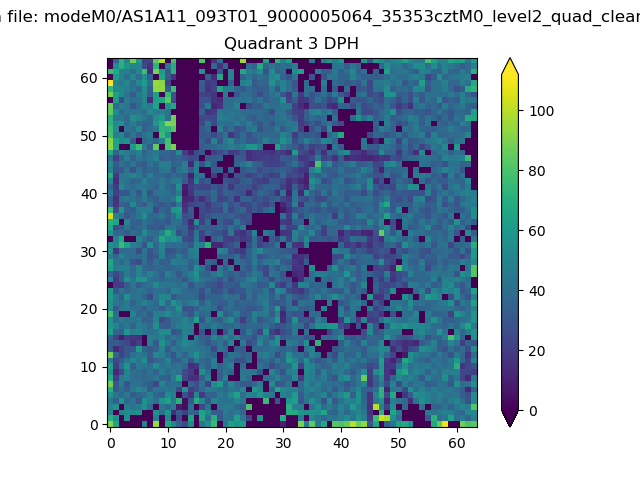 |
 |
Quadrant C |
| Plot type | Count rate plots | Images |
|---|---|---|
| Comparison with Poisson distribution Blue bars denote a histogram of data divided into 1 sec bins. Red curve is a Poisson curve with rate = median count rate of data. |
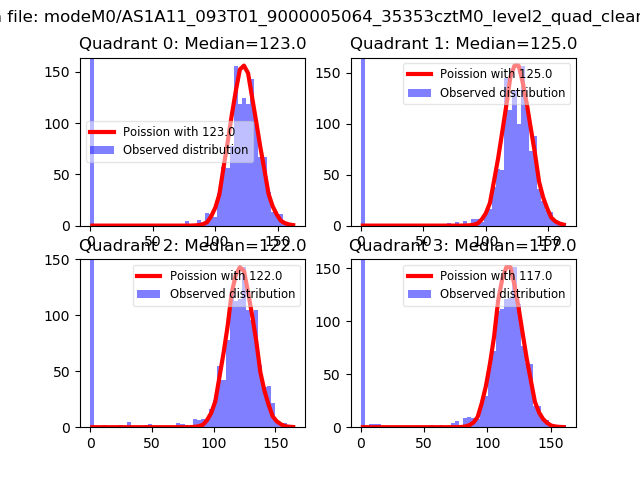 |
 |
| Quadrant-wise count rates Data is divided into 100 sec bins |
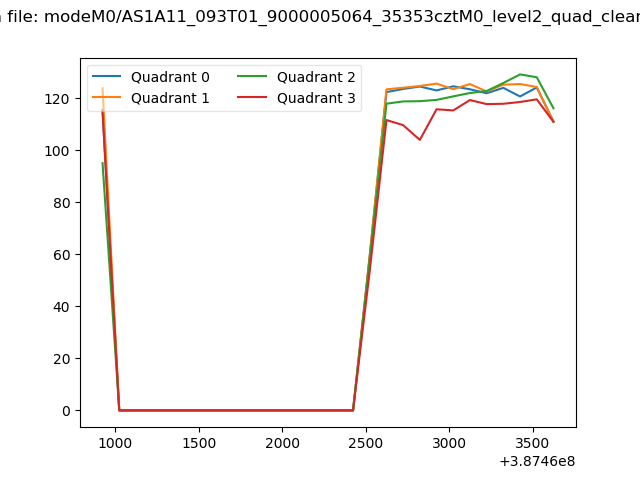 |
|
| Module-wise count rates for Quadrant A Data is divided into 100 sec bins |
 |
 |
| Module-wise count rates for Quadrant B Data is divided into 100 sec bins |
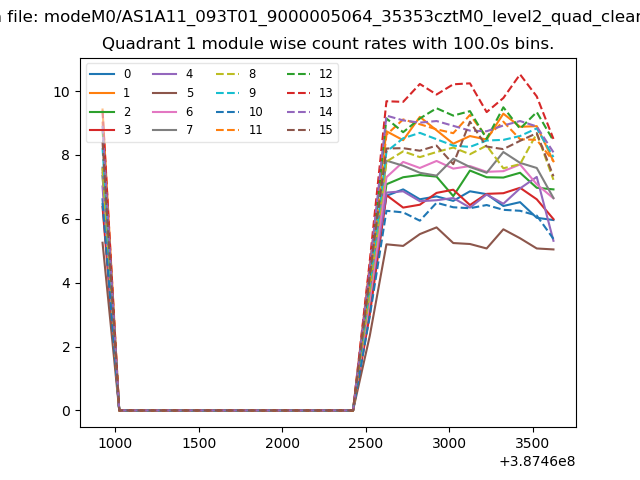 |
 |
| Module-wise count rates for Quadrant C Data is divided into 100 sec bins |
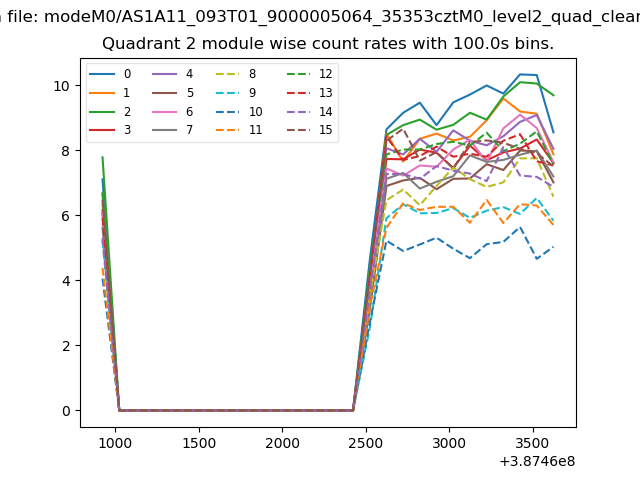 |
 |
| Module-wise count rates for Quadrant D Data is divided into 100 sec bins |
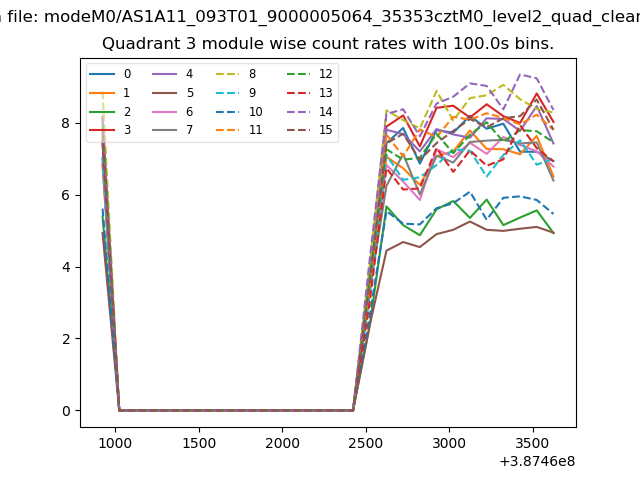 |
 |
| Parameter | Plot |
|---|---|
| CZT HV Monitor | 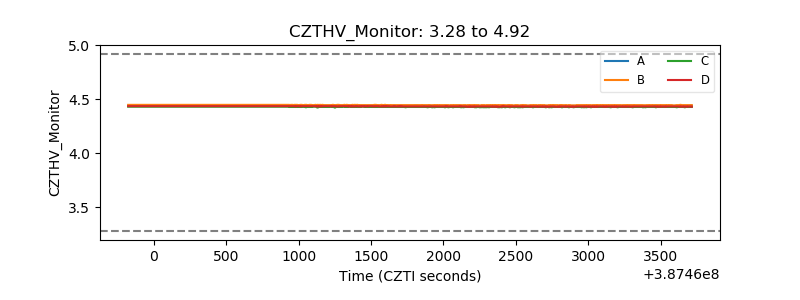 |
| D_VDD | 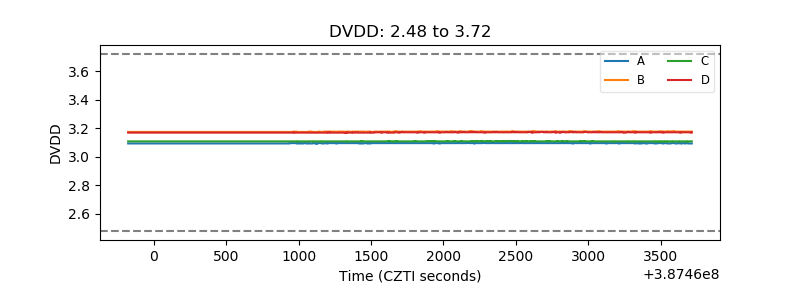 |
| Temperature 1 | 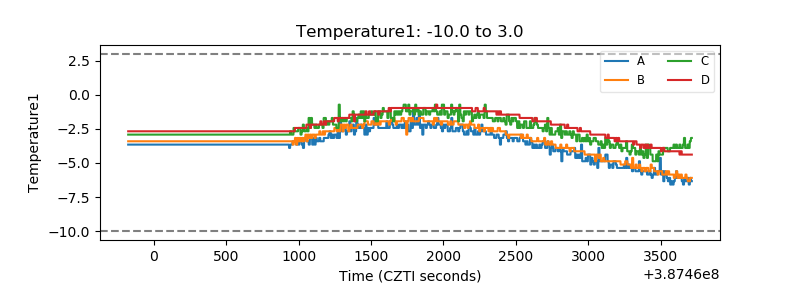 |
| Veto HV Monitor |  |
| Veto LLD |  |
| Alpha Counter |  |
| _CPM_Rate | 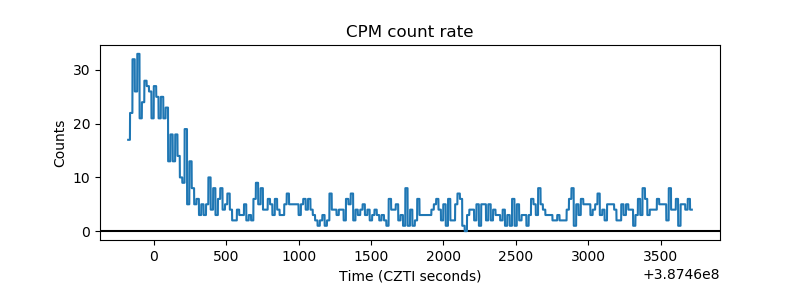 |
| CZT Counter | 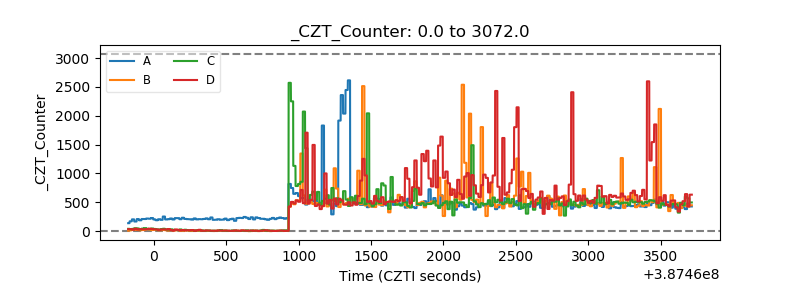 |
| +2.5 Volts monitor |  |
| +5 Volts monitor | 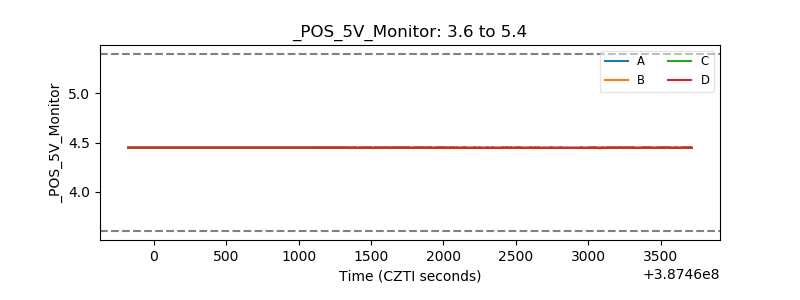 |
| _ROLL_ROT | 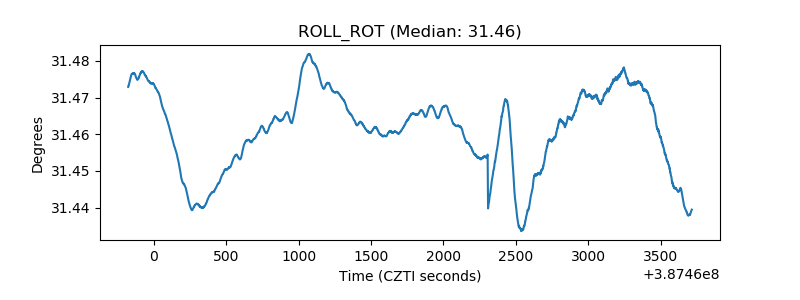 |
| _Roll_DEC | 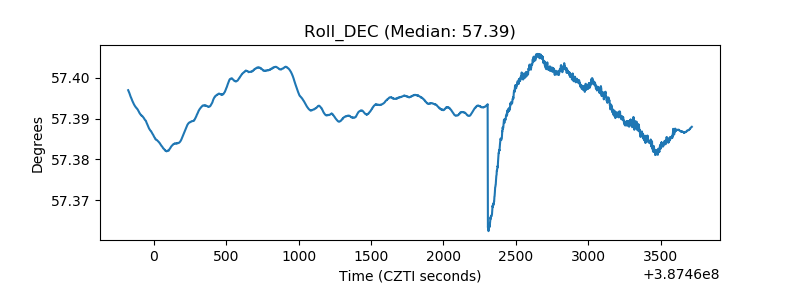 |
| _Roll_RA | 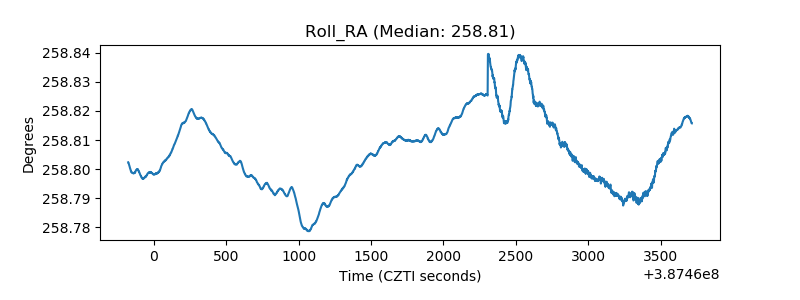 |
| Veto Counter | 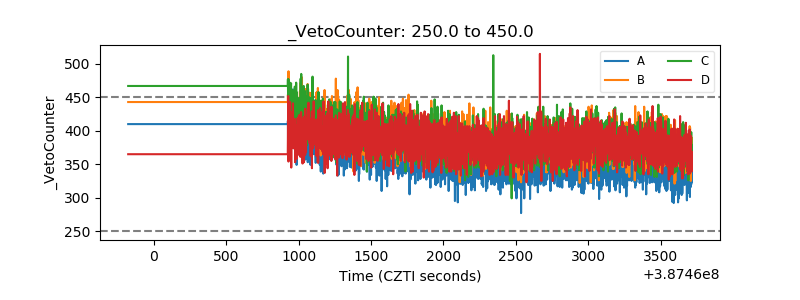 |