| Param | Original file | Final file |
|---|---|---|
| Filename | modeM0/AS1A11_093T01_9000005064_35350cztM0_level2.evt | modeM0/AS1A11_093T01_9000005064_35350cztM0_level2_quad_clean.evt |
| Size (bytes) | 461,514,240 | 73,834,560 |
| Size | 440.1 MB | 70.4 MB |
| Events in quadrant A | 2,507,182 | 477,372 |
| Events in quadrant B | 2,753,493 | 486,297 |
| Events in quadrant C | 3,138,963 | 477,520 |
| Events in quadrant D | 5,236,724 | 442,336 |
| Mode M0 | |||
|---|---|---|---|
| Quadrant | BADHDUFLAG | Total packets | Discarded packets |
| A | 0 | 10387 | 3 |
| B | 0 | 11176 | 2 |
| C | 0 | 12295 | 2 |
| D | 0 | 19143 | 2 |
| Mode SS | |||
|---|---|---|---|
| Quadrant | BADHDUFLAG | Total packets | Discarded packets |
| A | 0 | 104 | 0 |
| B | 0 | 104 | 0 |
| C | 0 | 104 | 0 |
| D | 0 | 104 | 0 |
| Mode M9 | |||
|---|---|---|---|
| Quadrant | BADHDUFLAG | Total packets | Discarded packets |
| A | 0 | 25 | 0 |
| B | 0 | 25 | 0 |
| C | 0 | 25 | 0 |
| D | 0 | 26 | 0 |
| Quadrant | Total seconds | Saturated seconds | Saturation percentage |
|---|---|---|---|
| A | 5018 | 9 | 0.179354% |
| B | 5018 | 73 | 1.454763% |
| C | 5018 | 123 | 2.451176% |
| D | 5018 | 327 | 6.516540% |
Noise dominated data is calculated using 1-second bins in cleaned event files. If a bin has >2000 counts, and if more than 50% of those come from <1% of pixels, then it is considered to be noise-dominated and hence unusable.
| Quadrant | # 1 sec bins | Bins with >0 counts | Bins with >2000 counts | High rate bins dominated by noise | Noise dominated (total time) | Noise dominated (detector-on time) | Marked lightcurve |
|---|---|---|---|---|---|---|---|
| A | 7141 | 5019 | 2 | 2 | 0.03% | 0.04% | 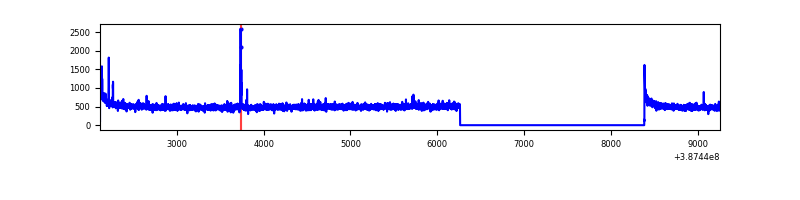 |
| B | 7141 | 5019 | 58 | 58 | 0.81% | 1.16% | 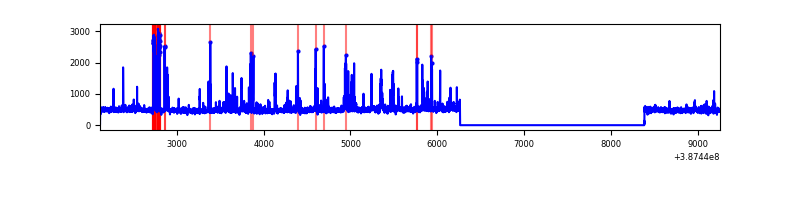 |
| C | 7141 | 5019 | 115 | 115 | 1.61% | 2.29% | 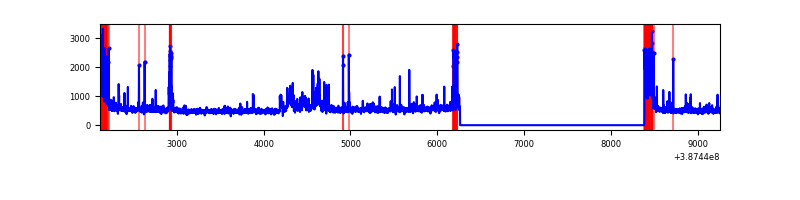 |
| D | 7141 | 5019 | 328 | 328 | 4.59% | 6.54% | 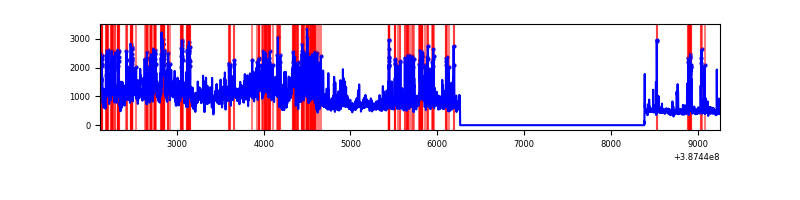 |
Top three noisy pixels from each quadrant. If the there are fewer than three noisy pixels in the level2.evt file, extra rows are filled as -1
| Pixel properties | Quadrant properties | ||||||
|---|---|---|---|---|---|---|---|
| Quadrant | DetID | PixID | Counts | Sigma | Mean | Median | Sigma |
| A | 10 | 83 | 110290 | 900.92 | 608 | 598 | 121.8 |
| A | 9 | 143 | 18102 | 143.76 | 608 | 598 | 121.8 |
| A | 13 | 6 | 15349 | 121.15 | 608 | 598 | 121.8 |
| B | 5 | 236 | 217227 | 1920.66 | 596 | 581 | 112.8 |
| B | 5 | 172 | 122102 | 1077.34 | 596 | 581 | 112.8 |
| B | 4 | 232 | 32839 | 285.98 | 596 | 581 | 112.8 |
| C | 0 | 10 | 327539 | 2463.93 | 577 | 582 | 132.7 |
| C | 3 | 233 | 239178 | 1798.05 | 577 | 582 | 132.7 |
| C | 15 | 214 | 213748 | 1606.41 | 577 | 582 | 132.7 |
| D | 7 | 80 | 1472039 | 10682.03 | 574 | 559 | 137.8 |
| D | 8 | 195 | 500771 | 3631.22 | 574 | 559 | 137.8 |
| D | 2 | 152 | 385139 | 2791.81 | 574 | 559 | 137.8 |
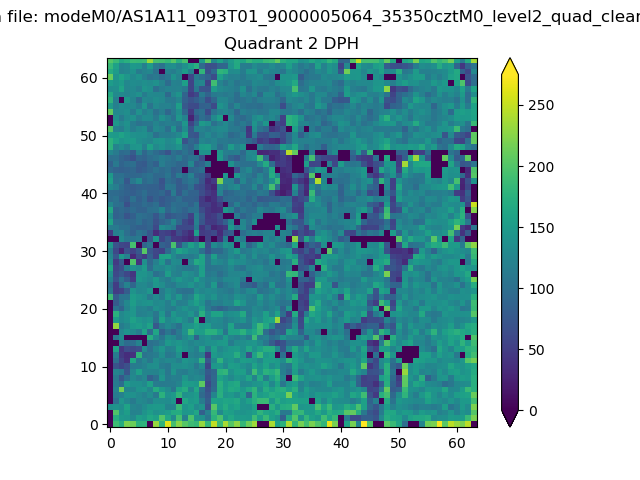
Histogram calculated using DETX and DETY for each event in the final _common_clean file
| Quadrant A | 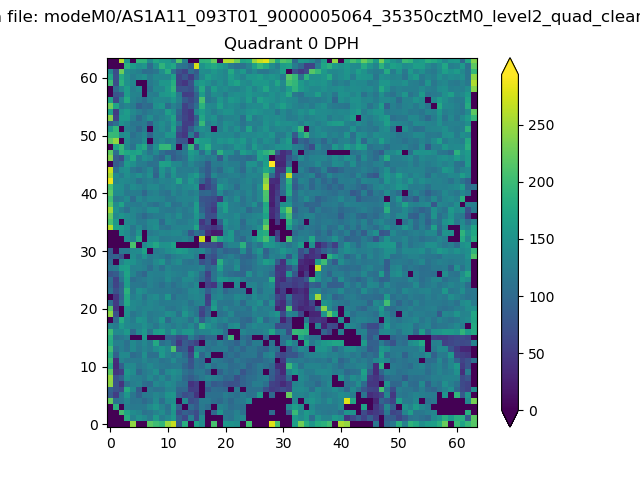 |
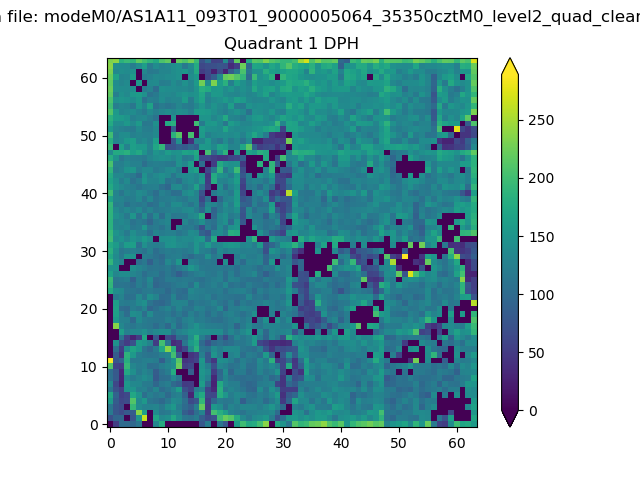 |
Quadrant B |
|---|---|---|---|
| Quadrant D | 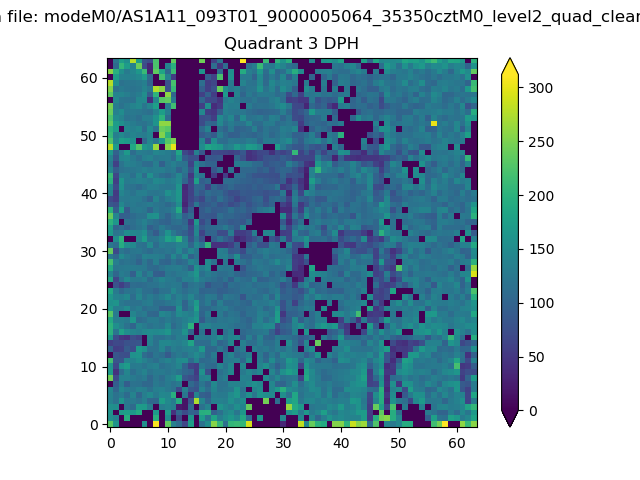 |
 |
Quadrant C |
| Plot type | Count rate plots | Images |
|---|---|---|
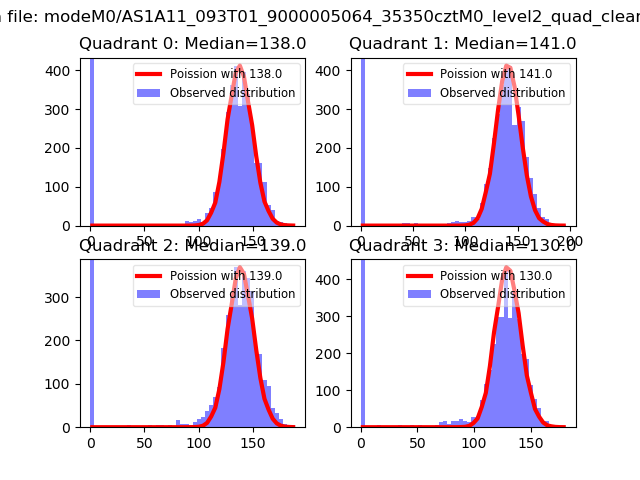
| Comparison with Poisson distribution Blue bars denote a histogram of data divided into 1 sec bins. Red curve is a Poisson curve with rate = median count rate of data. |
 |
 |
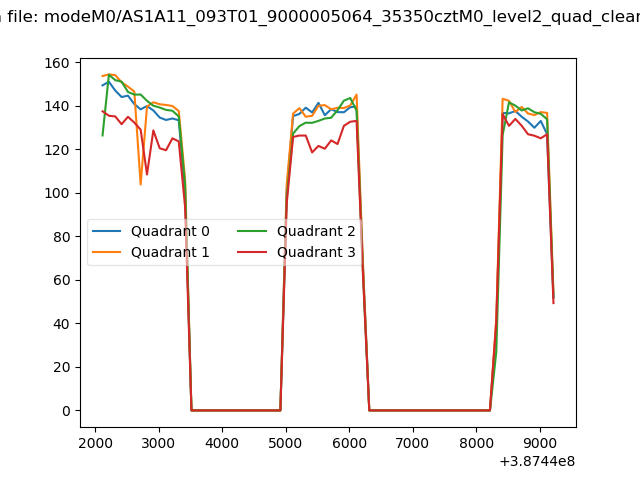
| Quadrant-wise count rates Data is divided into 100 sec bins |
 |
|
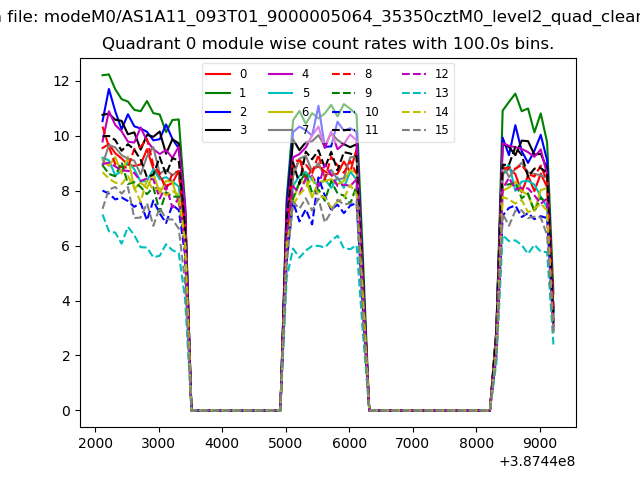
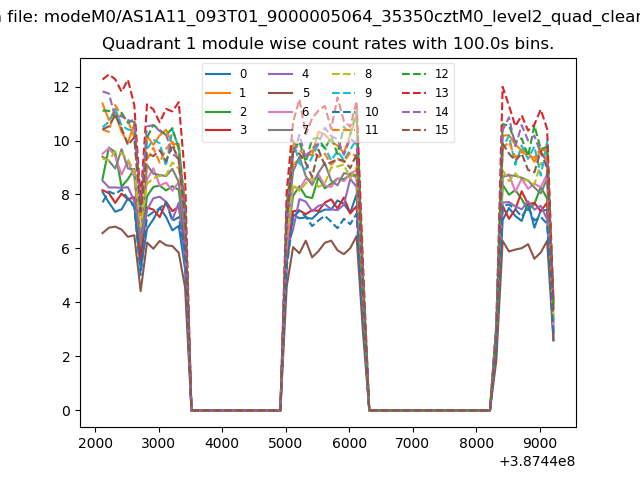
| Module-wise count rates for Quadrant A Data is divided into 100 sec bins |
 |
 |
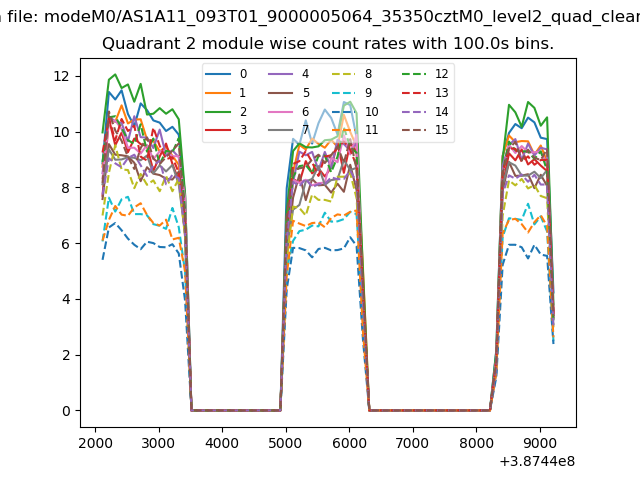
| Module-wise count rates for Quadrant B Data is divided into 100 sec bins |
 |
 |
| Module-wise count rates for Quadrant C Data is divided into 100 sec bins |
 |
 |
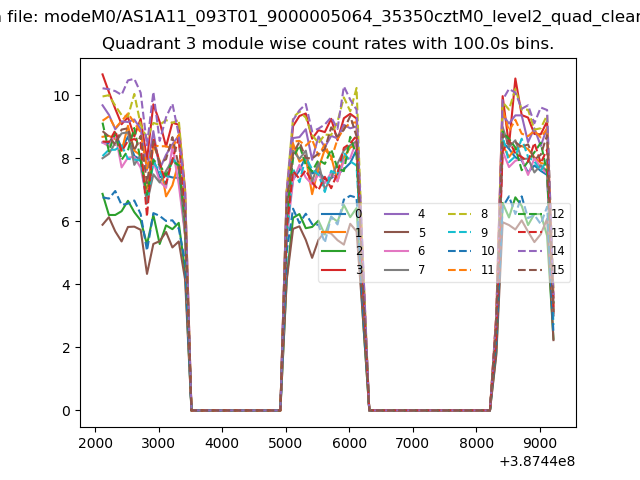
| Module-wise count rates for Quadrant D Data is divided into 100 sec bins |
 |
 |
| Parameter | Plot |
|---|---|
| CZT HV Monitor | 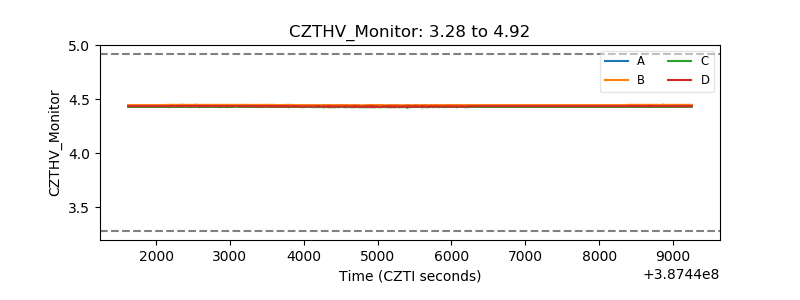 |
| D_VDD | 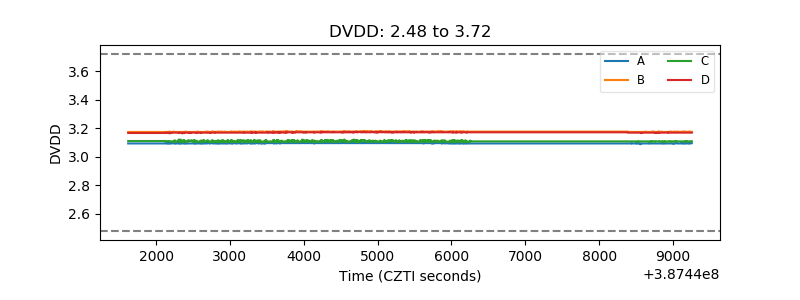 |
| Temperature 1 | 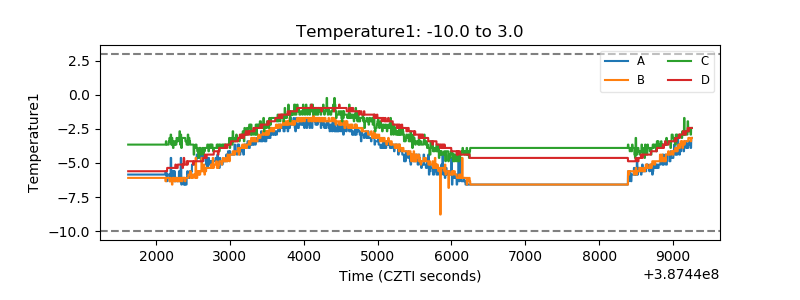 |
| Veto HV Monitor |  |
| Veto LLD | 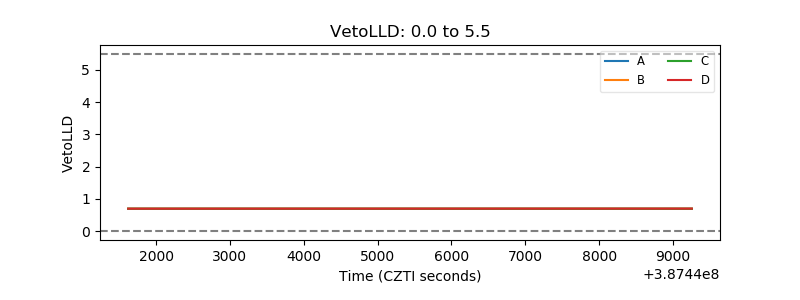 |
| Alpha Counter | 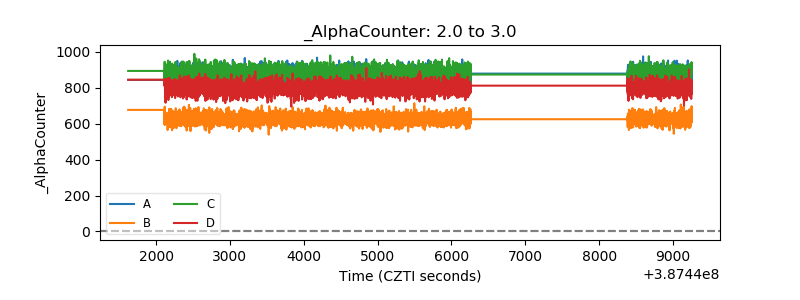 |
| _CPM_Rate | 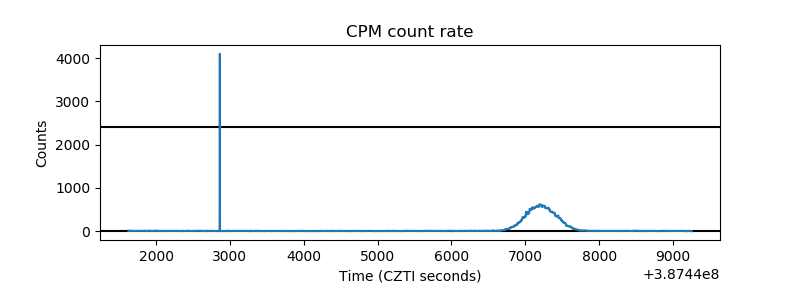 |
| CZT Counter | 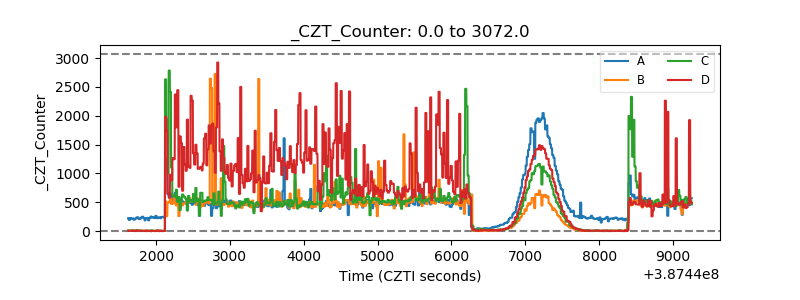 |
| +2.5 Volts monitor | 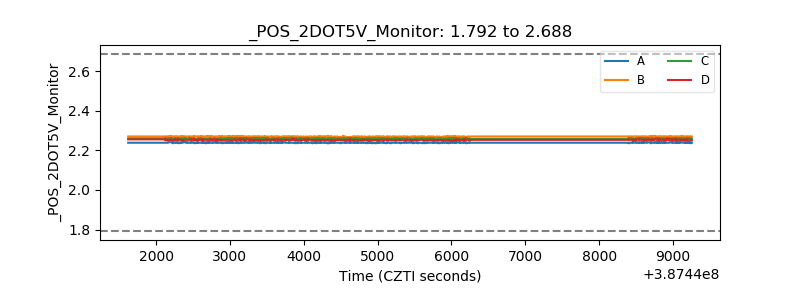 |
| +5 Volts monitor | 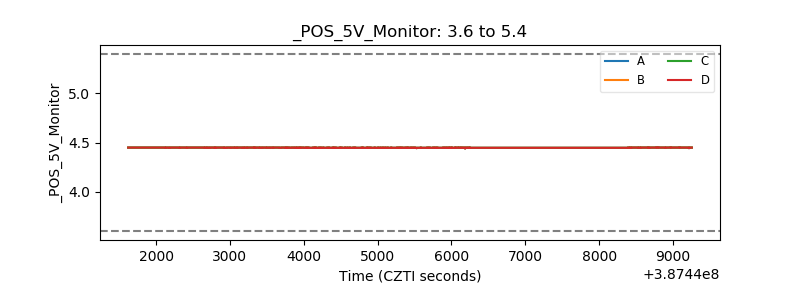 |
| _ROLL_ROT | 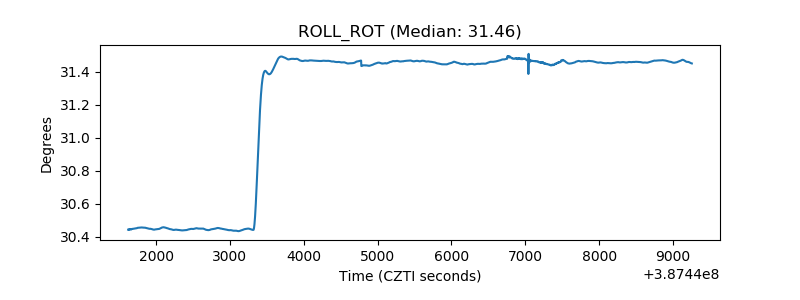 |
| _Roll_DEC |  |
| _Roll_RA | 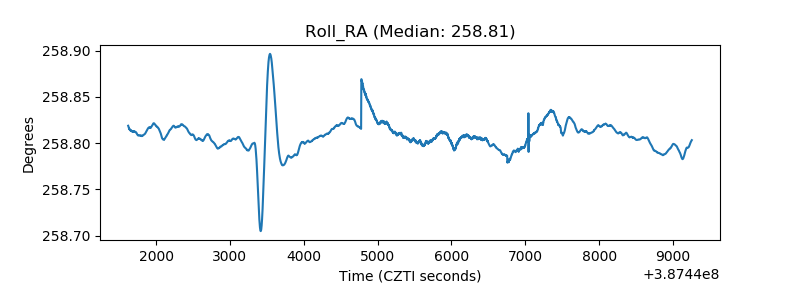 |
| Veto Counter | 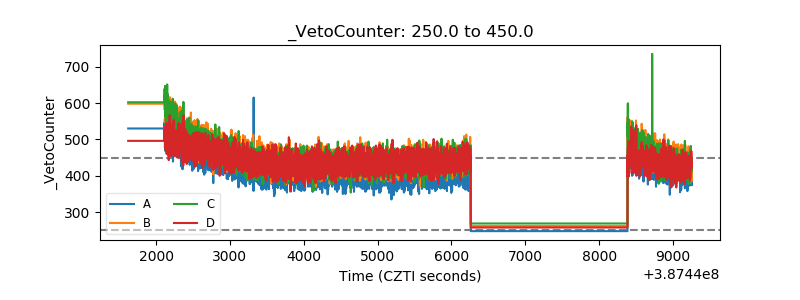 |