| Param | Original file | Final file |
|---|---|---|
| Filename | modeM0/AS1A11_093T01_9000005064_35349cztM0_level2.evt | modeM0/AS1A11_093T01_9000005064_35349cztM0_level2_quad_clean.evt |
| Size (bytes) | 434,756,160 | 75,176,640 |
| Size | 414.6 MB | 71.7 MB |
| Events in quadrant A | 2,515,100 | 486,566 |
| Events in quadrant B | 3,131,145 | 496,425 |
| Events in quadrant C | 3,046,280 | 487,047 |
| Events in quadrant D | 4,135,659 | 456,681 |
| Mode M0 | |||
|---|---|---|---|
| Quadrant | BADHDUFLAG | Total packets | Discarded packets |
| A | 0 | 10386 | 60 |
| B | 0 | 12354 | 40 |
| C | 0 | 11932 | 51 |
| D | 0 | 15779 | 82 |
| Mode SS | |||
|---|---|---|---|
| Quadrant | BADHDUFLAG | Total packets | Discarded packets |
| A | 0 | 102 | 0 |
| B | 0 | 102 | 0 |
| C | 0 | 102 | 0 |
| D | 0 | 102 | 0 |
| Mode M9 | |||
|---|---|---|---|
| Quadrant | BADHDUFLAG | Total packets | Discarded packets |
| A | 0 | 31 | 0 |
| B | 0 | 31 | 0 |
| C | 0 | 31 | 0 |
| D | 0 | 32 | 0 |
| Quadrant | Total seconds | Saturated seconds | Saturation percentage |
|---|---|---|---|
| A | 4976 | 4 | 0.080386% |
| B | 4992 | 178 | 3.565705% |
| C | 4979 | 155 | 3.113075% |
| D | 4987 | 168 | 3.368759% |
Noise dominated data is calculated using 1-second bins in cleaned event files. If a bin has >2000 counts, and if more than 50% of those come from <1% of pixels, then it is considered to be noise-dominated and hence unusable.
| Quadrant | # 1 sec bins | Bins with >0 counts | Bins with >2000 counts | High rate bins dominated by noise | Noise dominated (total time) | Noise dominated (detector-on time) | Marked lightcurve |
|---|---|---|---|---|---|---|---|
| A | 7137 | 5000 | 0 | 0 | 0.00% | 0.00% | 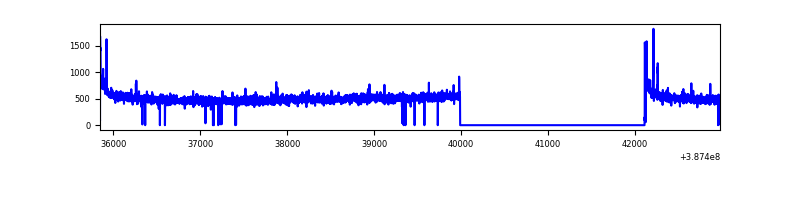 |
| B | 7137 | 5009 | 143 | 143 | 2.00% | 2.85% | 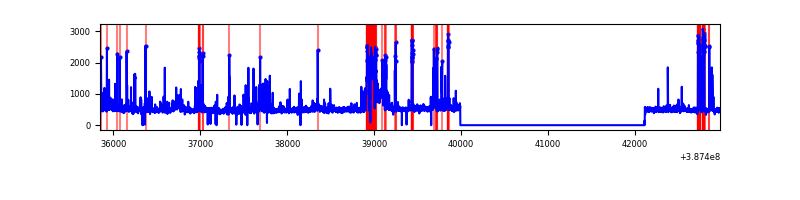 |
| C | 7137 | 5000 | 155 | 155 | 2.17% | 3.10% | 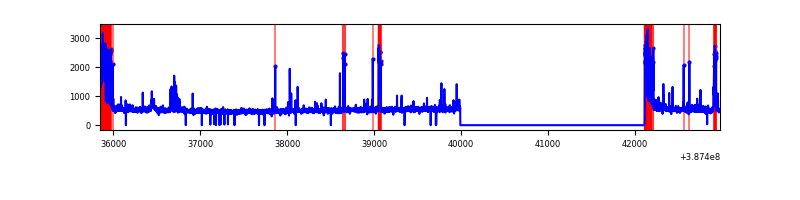 |
| D | 7137 | 5010 | 168 | 168 | 2.35% | 3.35% | 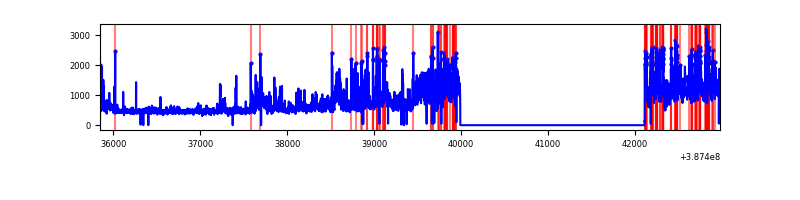 |
Top three noisy pixels from each quadrant. If the there are fewer than three noisy pixels in the level2.evt file, extra rows are filled as -1
| Pixel properties | Quadrant properties | ||||||
|---|---|---|---|---|---|---|---|
| Quadrant | DetID | PixID | Counts | Sigma | Mean | Median | Sigma |
| A | 10 | 83 | 109783 | 901.52 | 608 | 599 | 121.1 |
| A | 15 | 223 | 19298 | 154.4 | 608 | 599 | 121.1 |
| A | 13 | 6 | 13632 | 107.61 | 608 | 599 | 121.1 |
| B | 5 | 172 | 476308 | 4171.44 | 598 | 582 | 114.0 |
| B | 5 | 236 | 173131 | 1513.01 | 598 | 582 | 114.0 |
| B | 4 | 232 | 56751 | 492.52 | 598 | 582 | 114.0 |
| C | 0 | 10 | 451515 | 3428.08 | 576 | 580 | 131.5 |
| C | 15 | 214 | 209827 | 1590.73 | 576 | 580 | 131.5 |
| C | 3 | 233 | 53273 | 400.58 | 576 | 580 | 131.5 |
| D | 7 | 80 | 1040164 | 7360.76 | 581 | 564 | 141.2 |
| D | 8 | 195 | 241606 | 1706.67 | 581 | 564 | 141.2 |
| D | 2 | 152 | 194635 | 1374.1 | 581 | 564 | 141.2 |
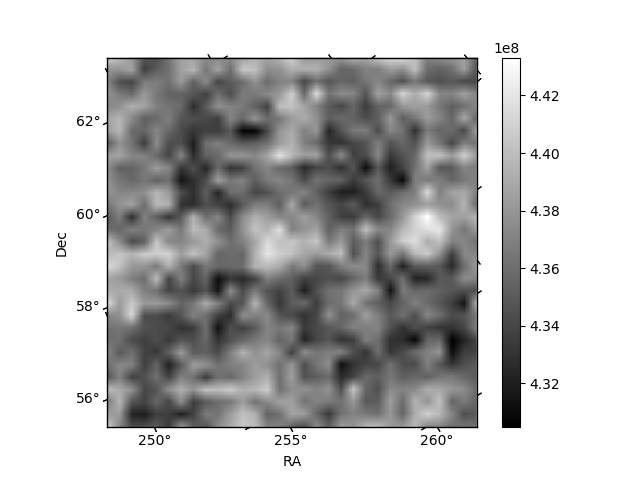
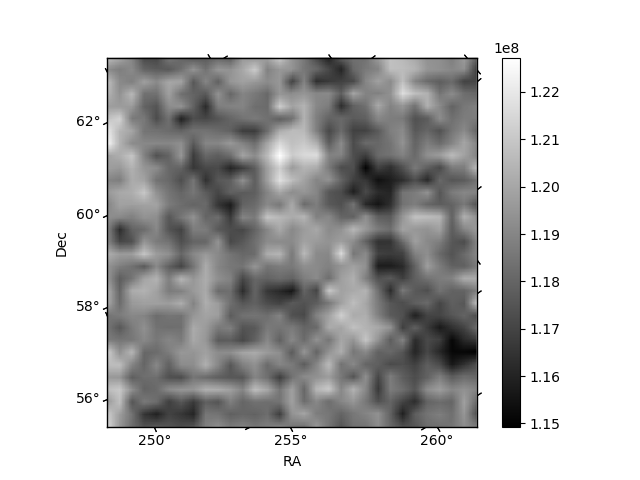
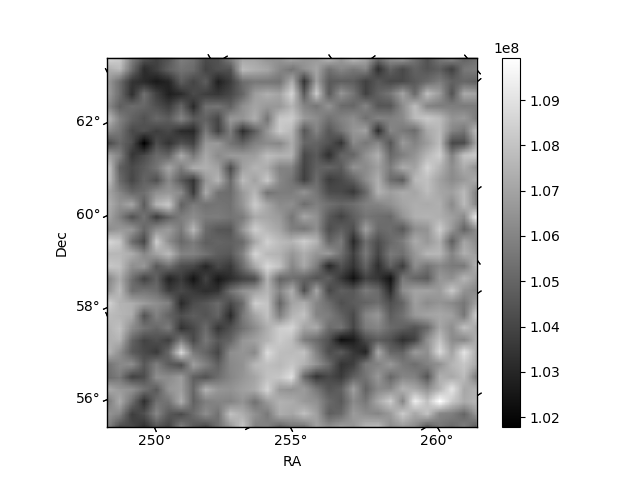
Histogram calculated using DETX and DETY for each event in the final _common_clean file
| Quadrant A | 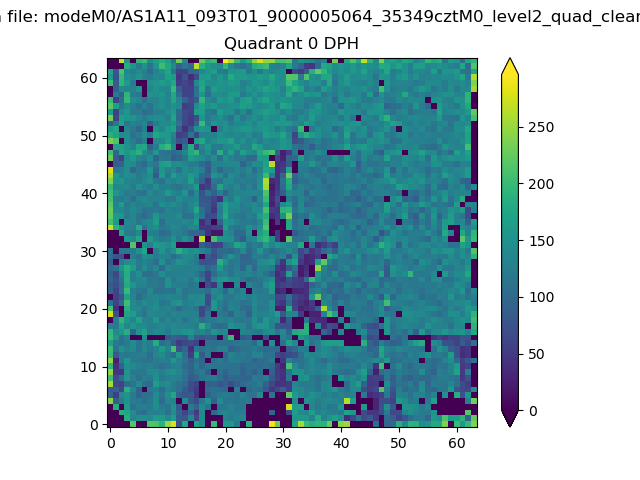 |
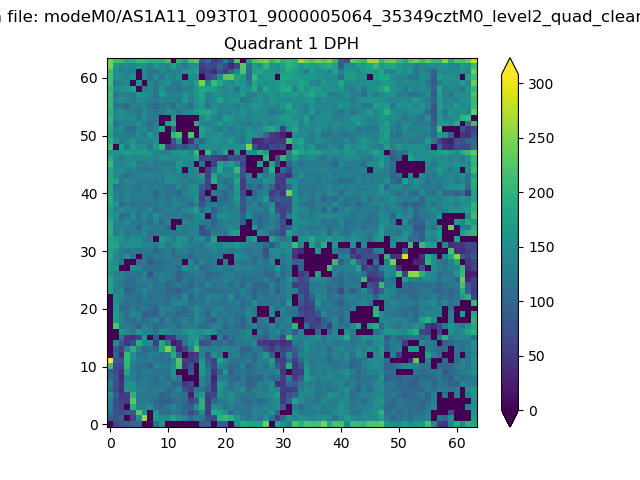 |
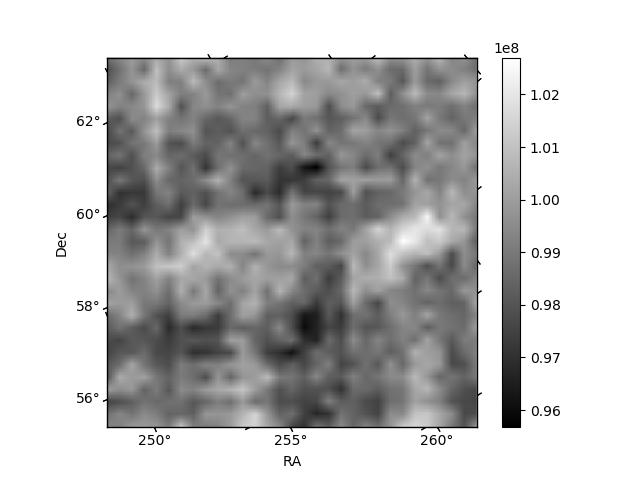
Quadrant B |
|---|---|---|---|
| Quadrant D | 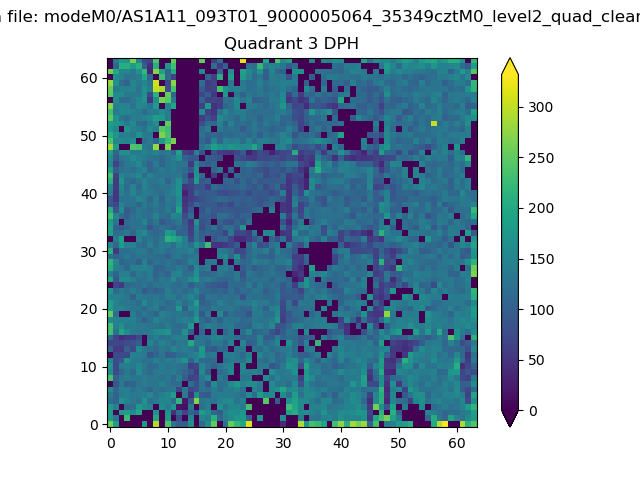 |
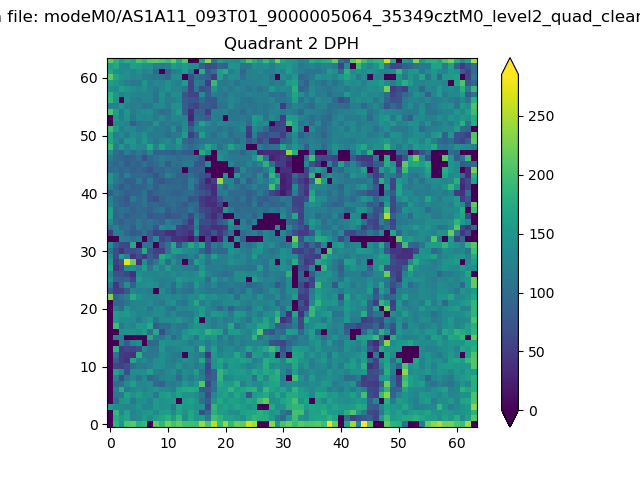 |
Quadrant C |
| Plot type | Count rate plots | Images |
|---|---|---|
| Comparison with Poisson distribution Blue bars denote a histogram of data divided into 1 sec bins. Red curve is a Poisson curve with rate = median count rate of data. |
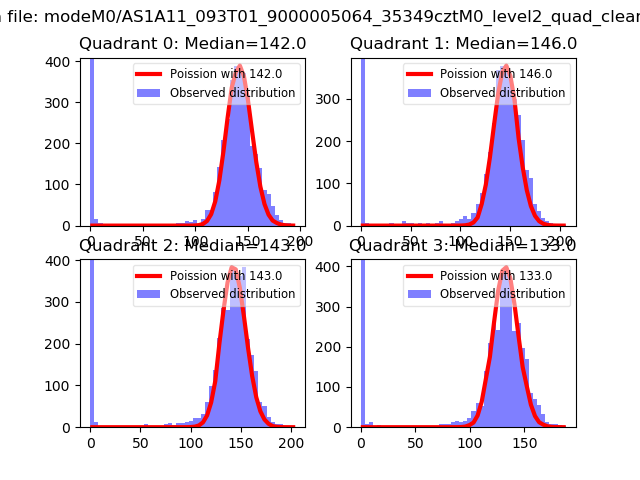 |
 |
| Quadrant-wise count rates Data is divided into 100 sec bins |
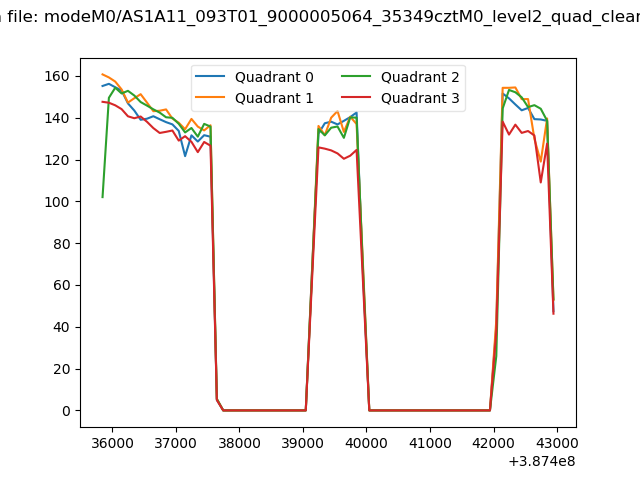 |
|
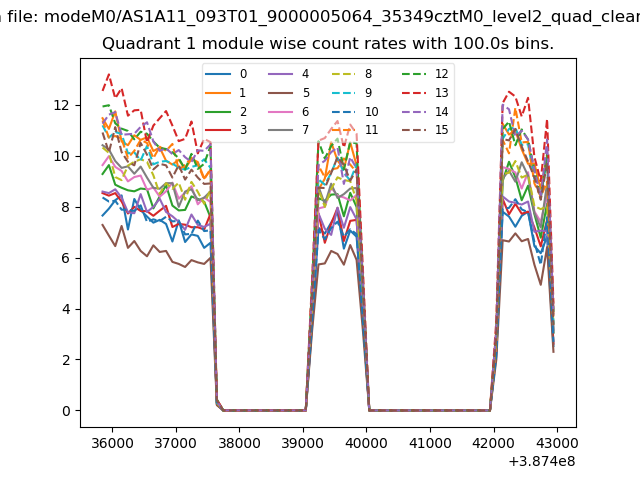
| Module-wise count rates for Quadrant A Data is divided into 100 sec bins |
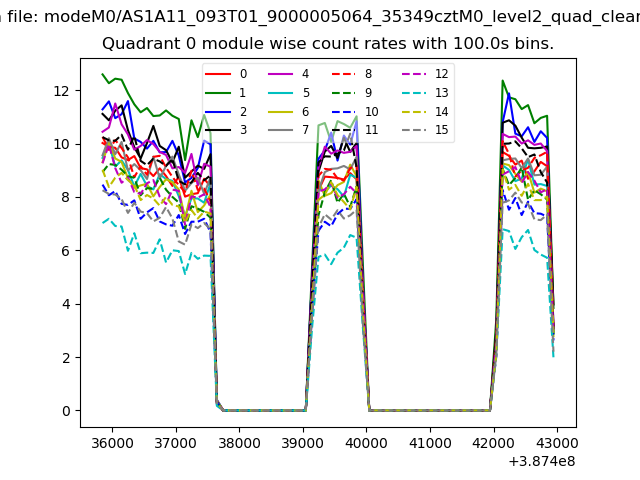 |
 |
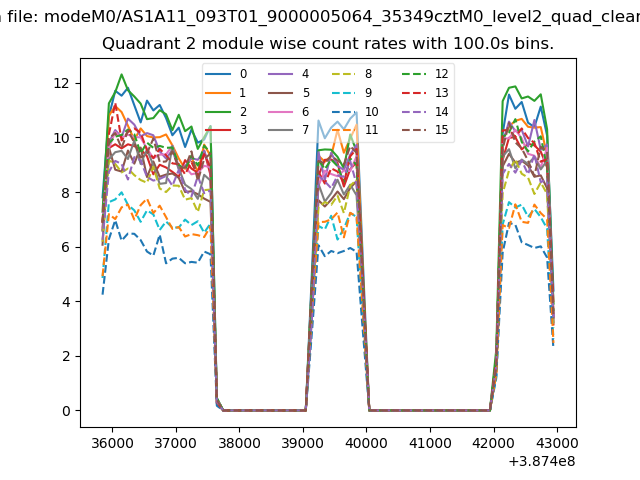
| Module-wise count rates for Quadrant B Data is divided into 100 sec bins |
 |
 |
| Module-wise count rates for Quadrant C Data is divided into 100 sec bins |
 |
 |
| Module-wise count rates for Quadrant D Data is divided into 100 sec bins |
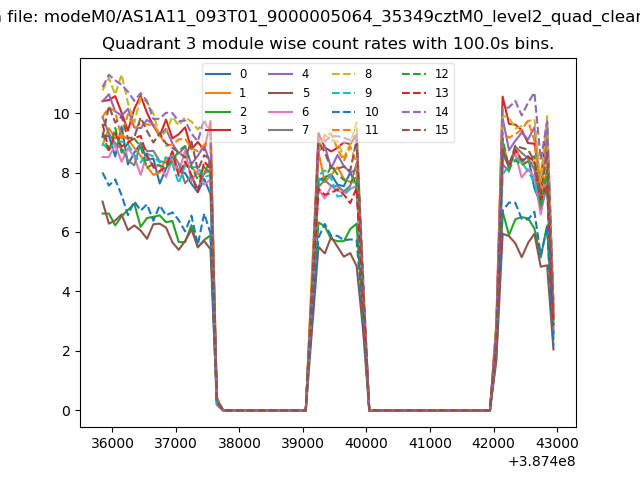 |
 |
| Parameter | Plot |
|---|---|
| CZT HV Monitor | 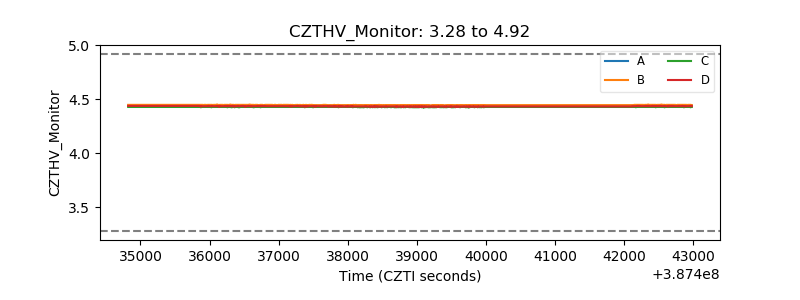 |
| D_VDD | 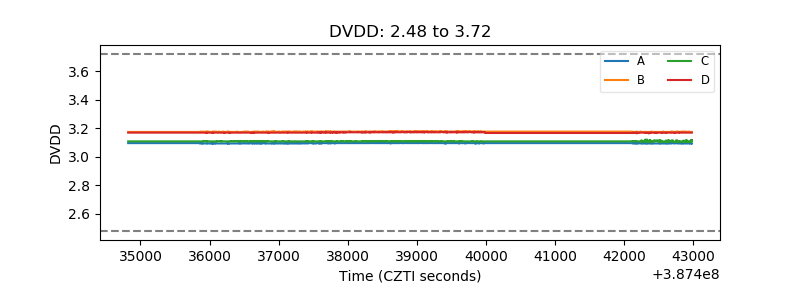 |
| Temperature 1 | 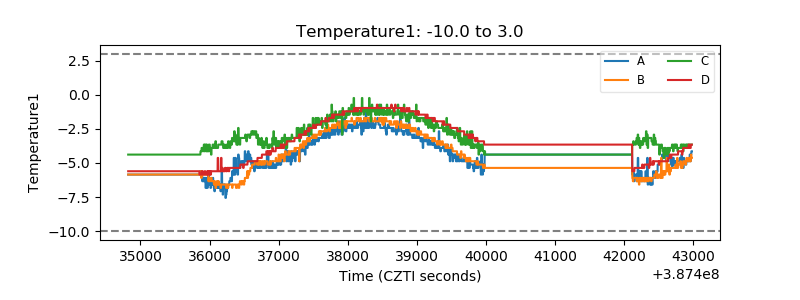 |
| Veto HV Monitor | 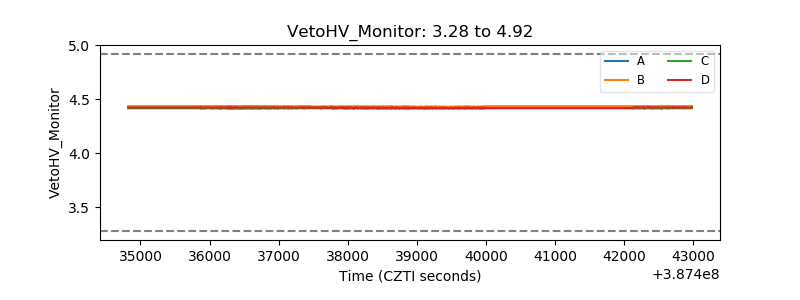 |
| Veto LLD | 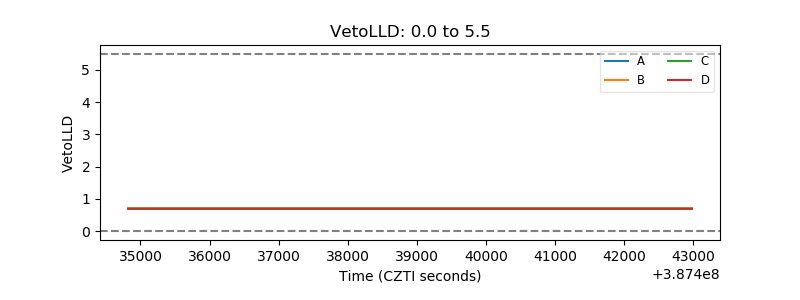 |
| Alpha Counter | 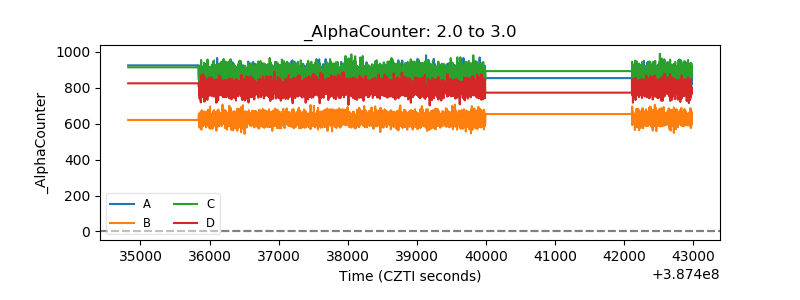 |
| _CPM_Rate | 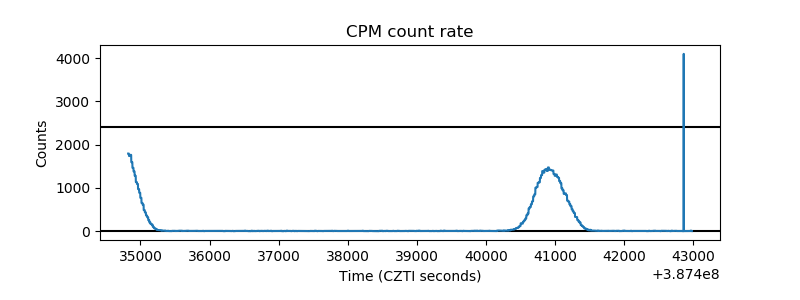 |
| CZT Counter | 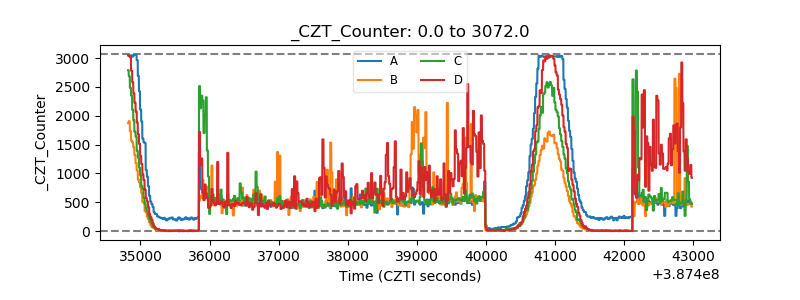 |
| +2.5 Volts monitor | 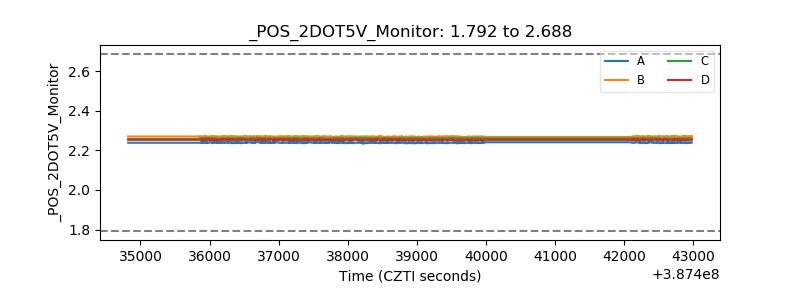 |
| +5 Volts monitor | 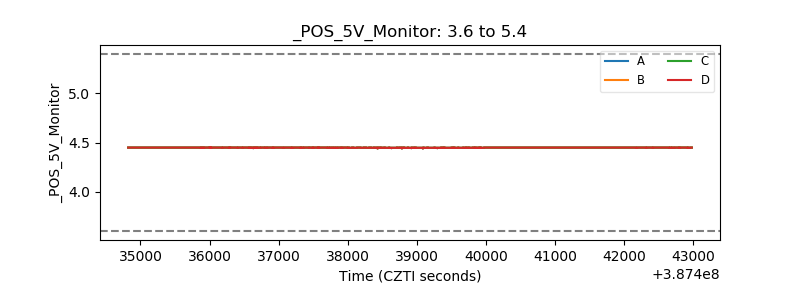 |
| _ROLL_ROT | 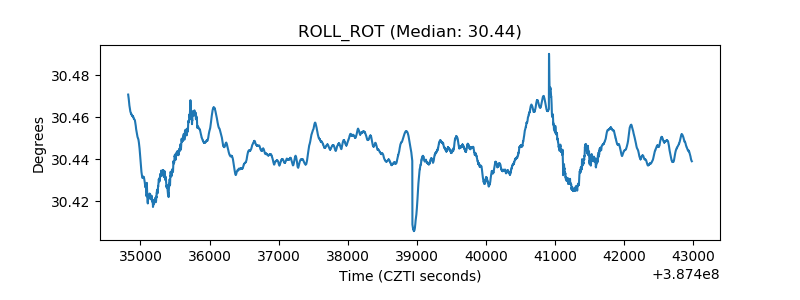 |
| _Roll_DEC | 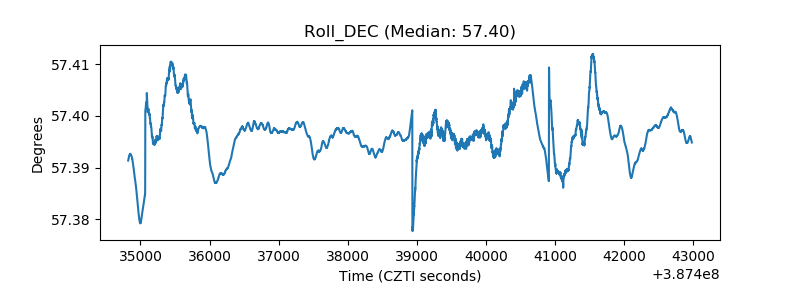 |
| _Roll_RA | 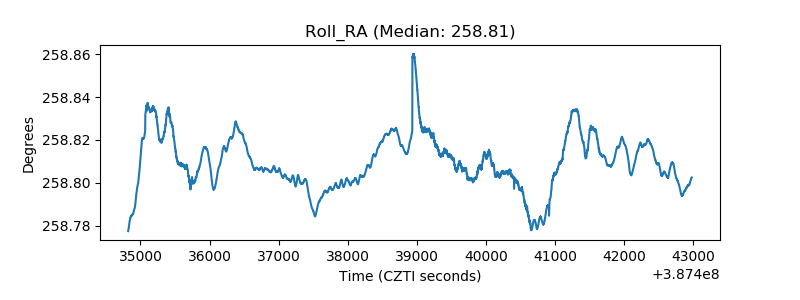 |
| Veto Counter | 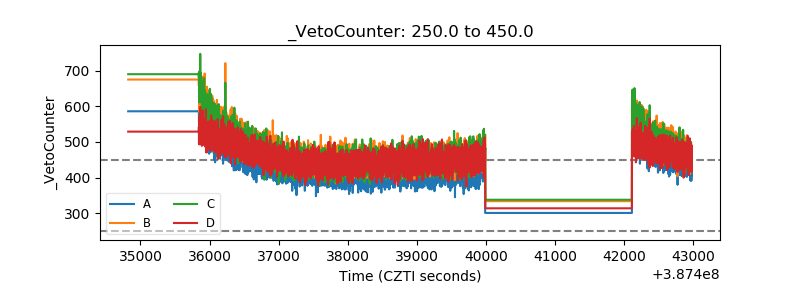 |