| Param | Original file | Final file |
|---|---|---|
| Filename | modeM0/AS1A11_093T01_9000005064_35347cztM0_level2.evt | modeM0/AS1A11_093T01_9000005064_35347cztM0_level2_quad_clean.evt |
| Size (bytes) | 418,204,800 | 80,864,640 |
| Size | 398.8 MB | 77.1 MB |
| Events in quadrant A | 2,669,720 | 515,497 |
| Events in quadrant B | 3,000,741 | 535,852 |
| Events in quadrant C | 3,054,506 | 531,963 |
| Events in quadrant D | 3,574,668 | 488,662 |
| Mode M0 | |||
|---|---|---|---|
| Quadrant | BADHDUFLAG | Total packets | Discarded packets |
| A | 0 | 11384 | 3 |
| B | 0 | 12303 | 2 |
| C | 0 | 12294 | 2 |
| D | 0 | 14089 | 2 |
| Mode SS | |||
|---|---|---|---|
| Quadrant | BADHDUFLAG | Total packets | Discarded packets |
| A | 0 | 110 | 0 |
| B | 0 | 110 | 0 |
| C | 0 | 110 | 0 |
| D | 0 | 110 | 0 |
| Mode M9 | |||
|---|---|---|---|
| Quadrant | BADHDUFLAG | Total packets | Discarded packets |
| A | 0 | 26 | 0 |
| B | 0 | 26 | 0 |
| C | 0 | 26 | 0 |
| D | 0 | 27 | 0 |
| Quadrant | Total seconds | Saturated seconds | Saturation percentage |
|---|---|---|---|
| A | 5379 | 24 | 0.446180% |
| B | 5379 | 118 | 2.193716% |
| C | 5379 | 84 | 1.561629% |
| D | 5379 | 262 | 4.870794% |
Noise dominated data is calculated using 1-second bins in cleaned event files. If a bin has >2000 counts, and if more than 50% of those come from <1% of pixels, then it is considered to be noise-dominated and hence unusable.
| Quadrant | # 1 sec bins | Bins with >0 counts | Bins with >2000 counts | High rate bins dominated by noise | Noise dominated (total time) | Noise dominated (detector-on time) | Marked lightcurve |
|---|---|---|---|---|---|---|---|
| A | 7292 | 5380 | 18 | 18 | 0.25% | 0.33% | 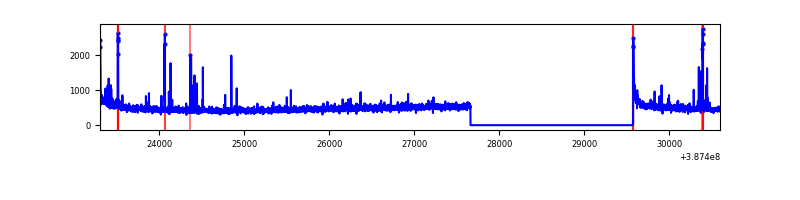 |
| B | 7292 | 5380 | 87 | 87 | 1.19% | 1.62% | 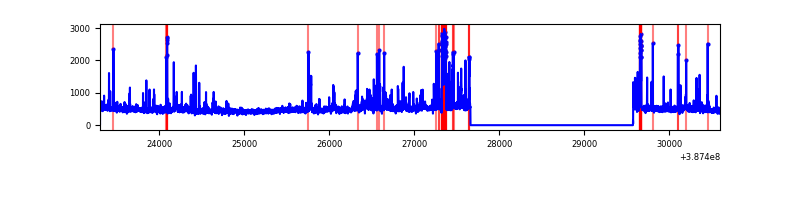 |
| C | 7292 | 5380 | 71 | 71 | 0.97% | 1.32% | 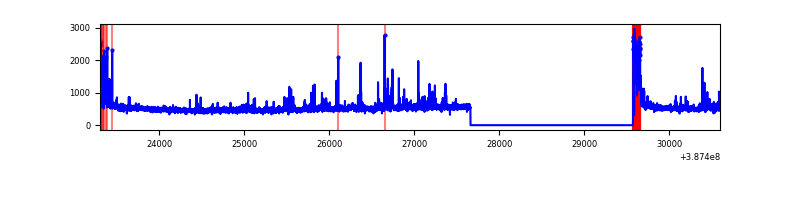 |
| D | 7292 | 5380 | 219 | 219 | 3.00% | 4.07% | 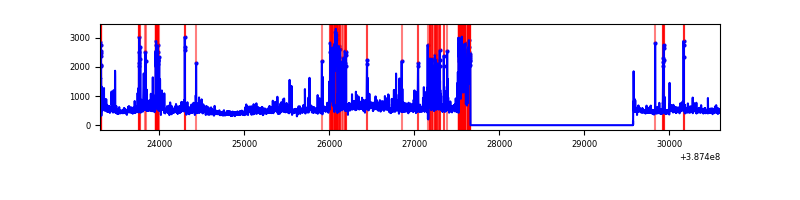 |
Top three noisy pixels from each quadrant. If the there are fewer than three noisy pixels in the level2.evt file, extra rows are filled as -1
| Pixel properties | Quadrant properties | ||||||
|---|---|---|---|---|---|---|---|
| Quadrant | DetID | PixID | Counts | Sigma | Mean | Median | Sigma |
| A | 10 | 83 | 110691 | 870.37 | 630 | 620 | 126.5 |
| A | 9 | 143 | 88866 | 697.79 | 630 | 620 | 126.5 |
| A | 7 | 3 | 12958 | 97.56 | 630 | 620 | 126.5 |
| B | 5 | 236 | 238795 | 2026.15 | 625 | 610 | 117.6 |
| B | 5 | 172 | 186738 | 1583.32 | 625 | 610 | 117.6 |
| B | 4 | 232 | 62768 | 528.76 | 625 | 610 | 117.6 |
| C | 0 | 10 | 385018 | 2744.39 | 610 | 618 | 140.1 |
| C | 15 | 214 | 223068 | 1588.16 | 610 | 618 | 140.1 |
| C | 1 | 23 | 20040 | 138.66 | 610 | 618 | 140.1 |
| D | 8 | 195 | 405721 | 2833.99 | 590 | 572 | 143.0 |
| D | 10 | 118 | 313856 | 2191.4 | 590 | 572 | 143.0 |
| D | 12 | 6 | 171803 | 1197.75 | 590 | 572 | 143.0 |
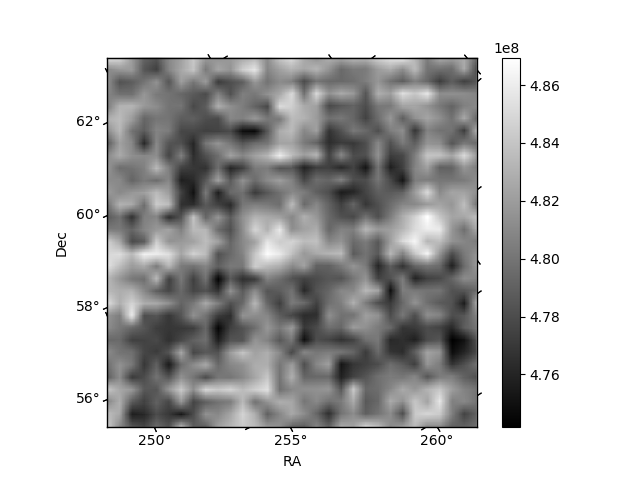
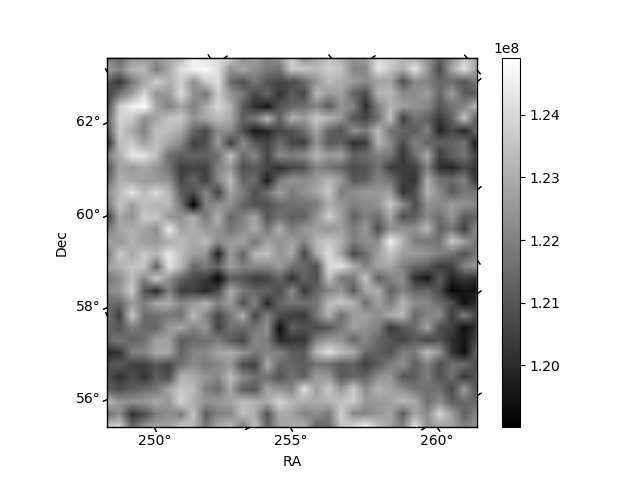
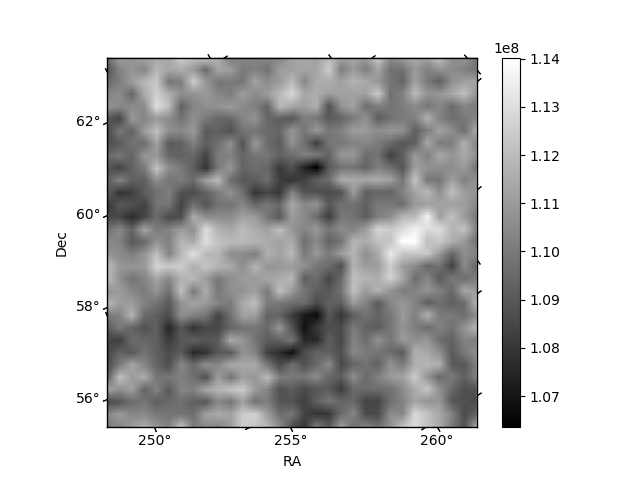
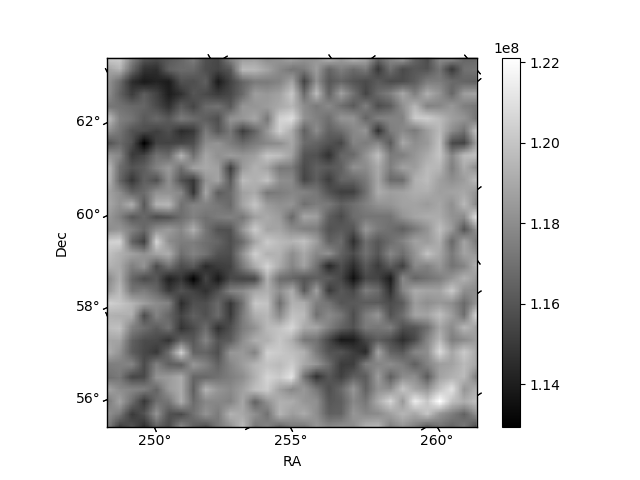
Histogram calculated using DETX and DETY for each event in the final _common_clean file
| Quadrant A | 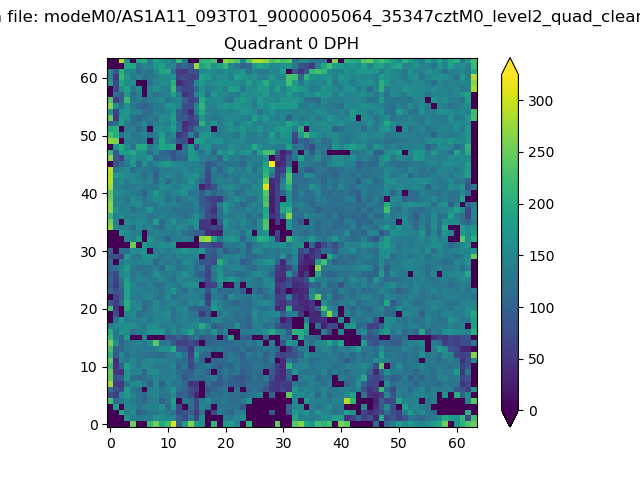 |
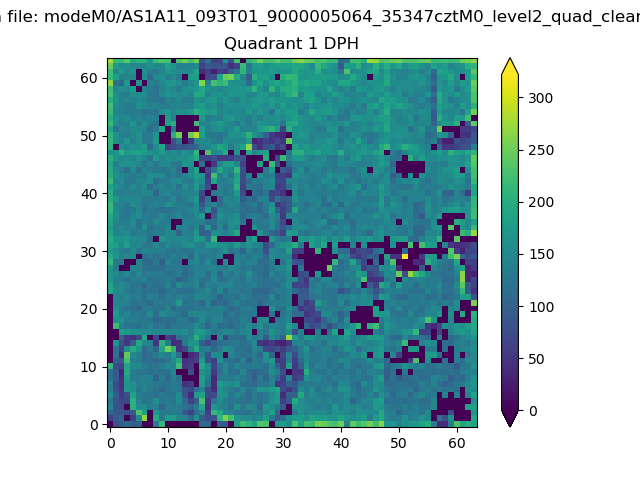 |
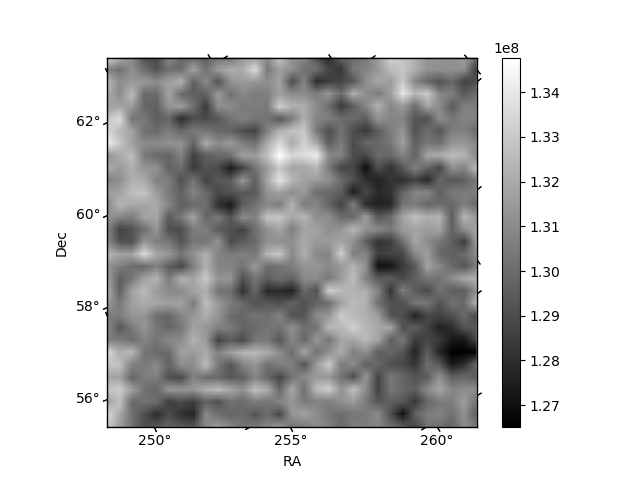
Quadrant B |
|---|---|---|---|
| Quadrant D | 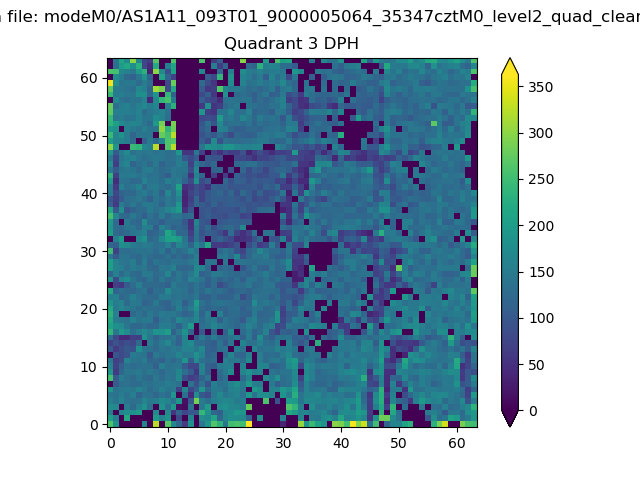 |
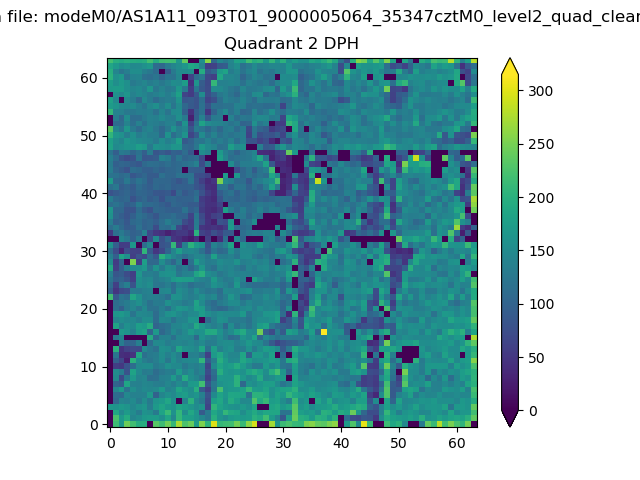 |
Quadrant C |
| Plot type | Count rate plots | Images |
|---|---|---|
| Comparison with Poisson distribution Blue bars denote a histogram of data divided into 1 sec bins. Red curve is a Poisson curve with rate = median count rate of data. |
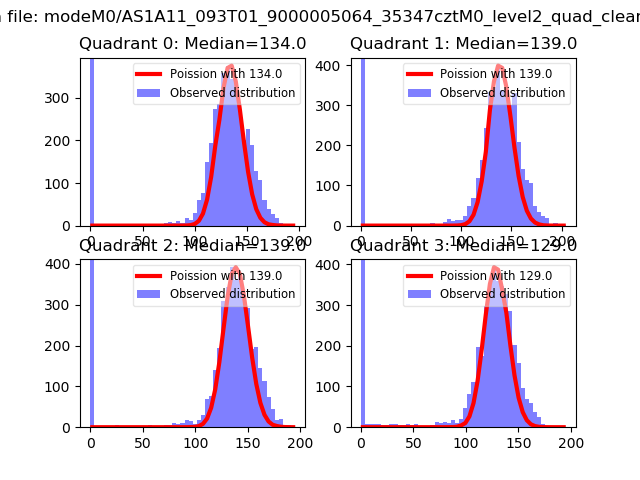 |
 |
| Quadrant-wise count rates Data is divided into 100 sec bins |
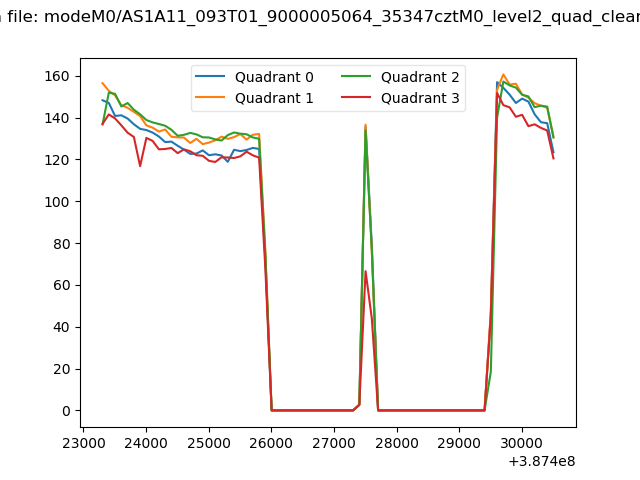 |
|
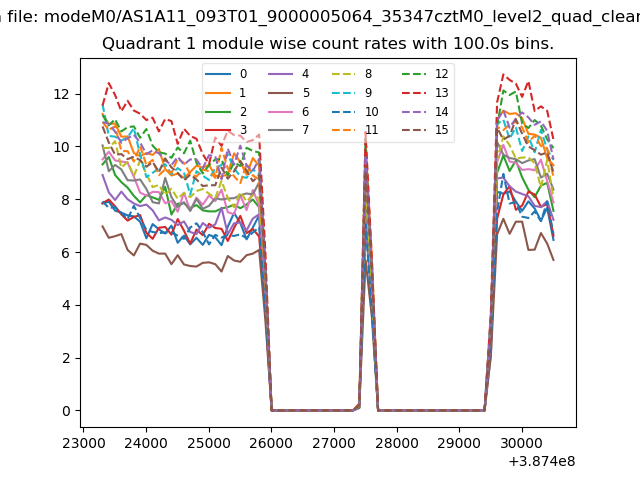
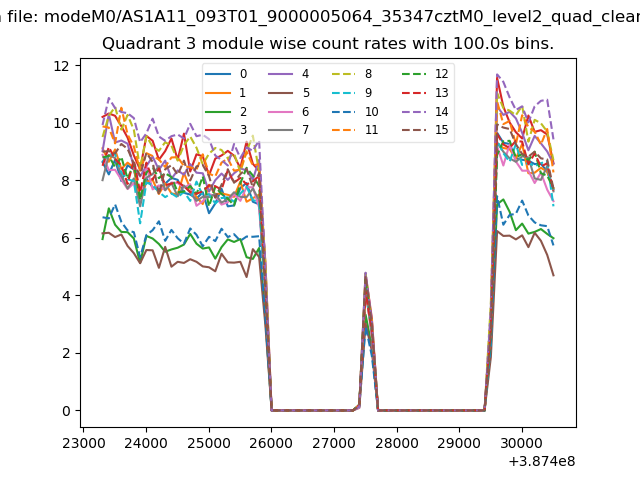
| Module-wise count rates for Quadrant A Data is divided into 100 sec bins |
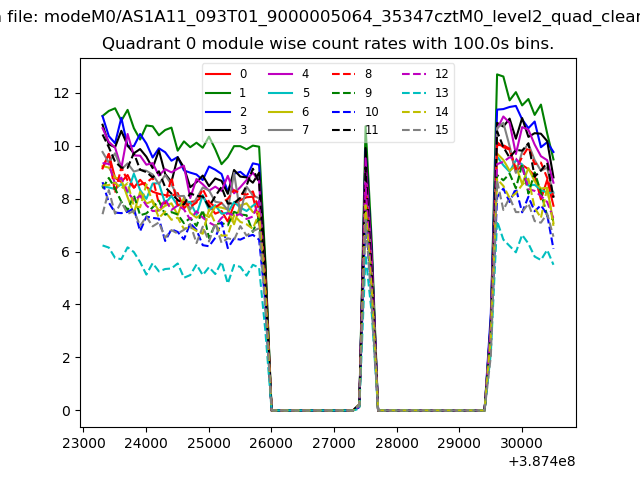 |
 |
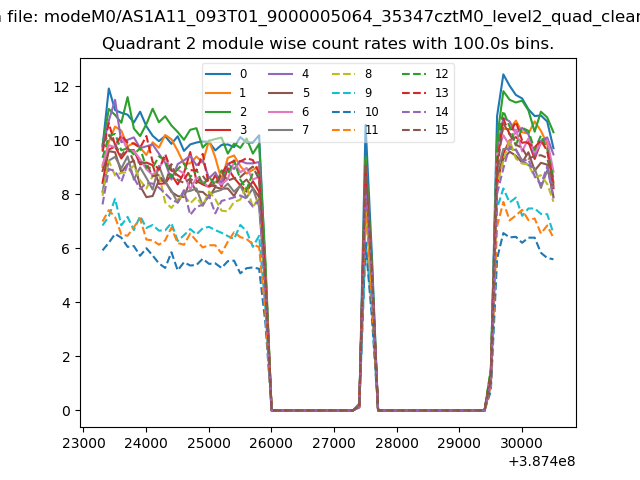
| Module-wise count rates for Quadrant B Data is divided into 100 sec bins |
 |
 |
| Module-wise count rates for Quadrant C Data is divided into 100 sec bins |
 |
 |
| Module-wise count rates for Quadrant D Data is divided into 100 sec bins |
 |
 |
| Parameter | Plot |
|---|---|
| CZT HV Monitor | 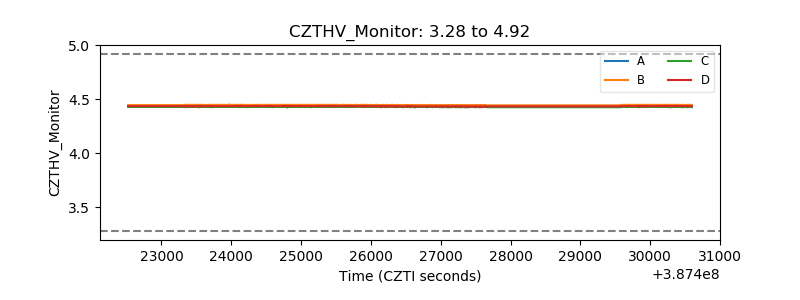 |
| D_VDD | 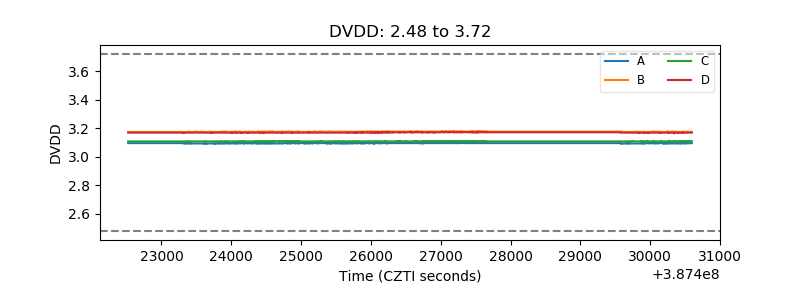 |
| Temperature 1 | 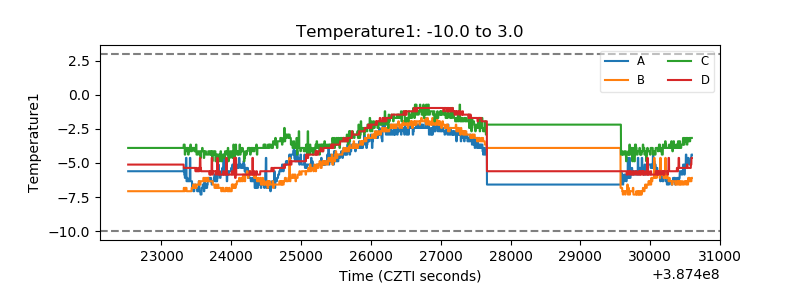 |
| Veto HV Monitor | 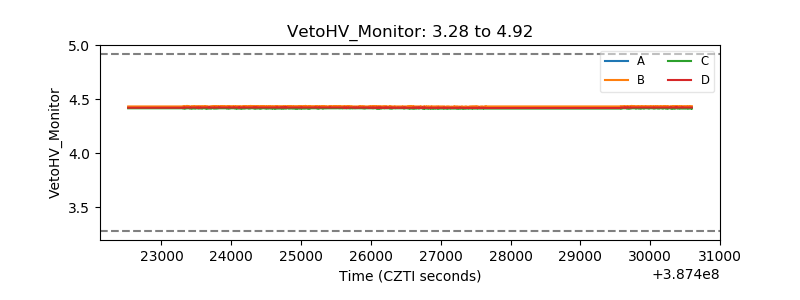 |
| Veto LLD | 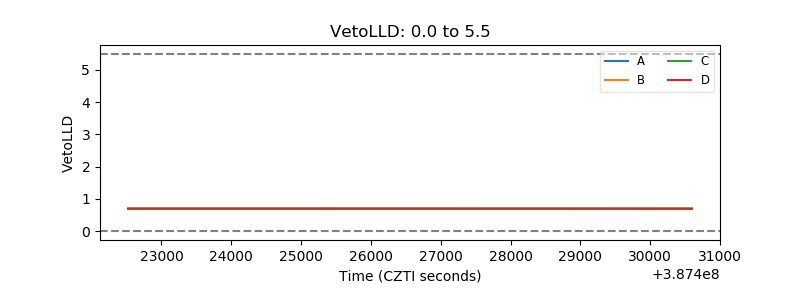 |
| Alpha Counter | 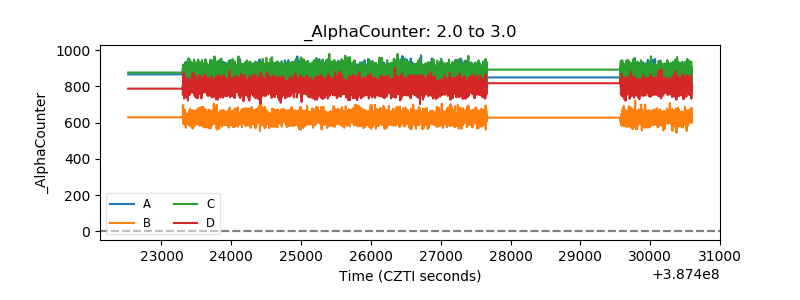 |
| _CPM_Rate | 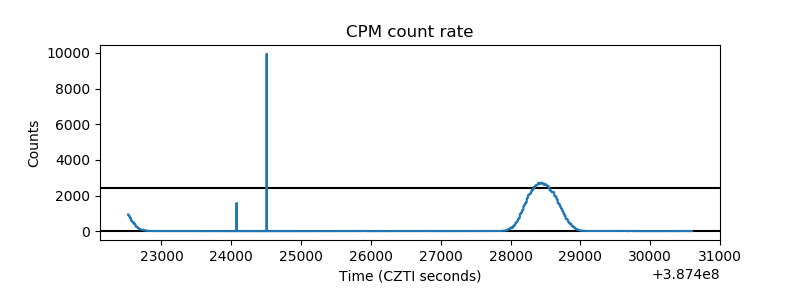 |
| CZT Counter | 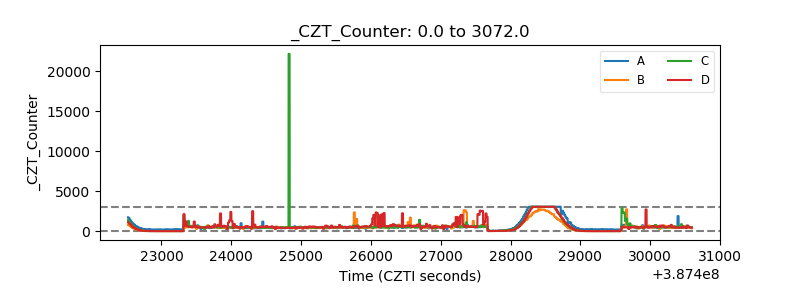 |
| +2.5 Volts monitor | 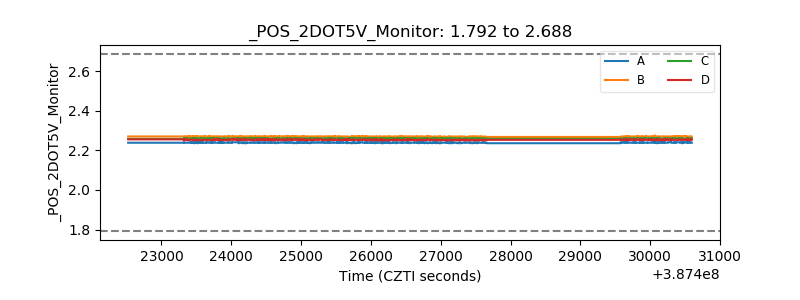 |
| +5 Volts monitor | 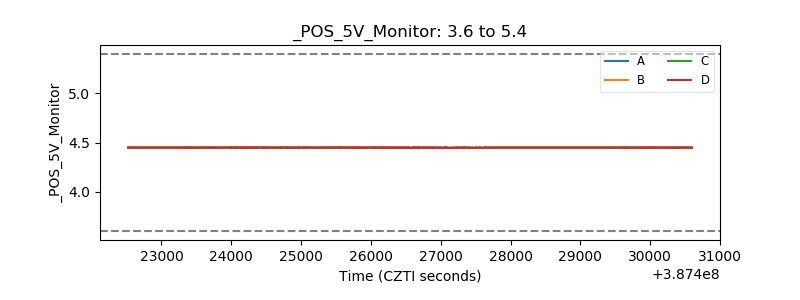 |
| _ROLL_ROT | 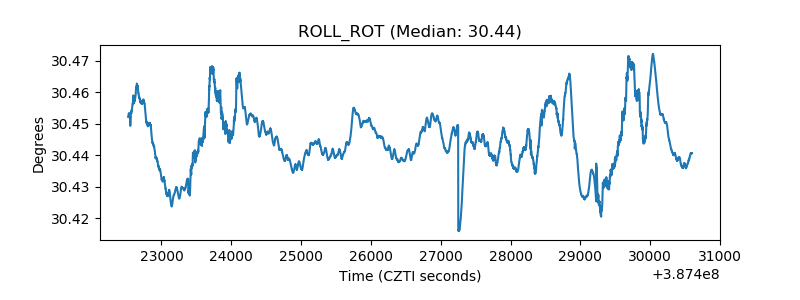 |
| _Roll_DEC | 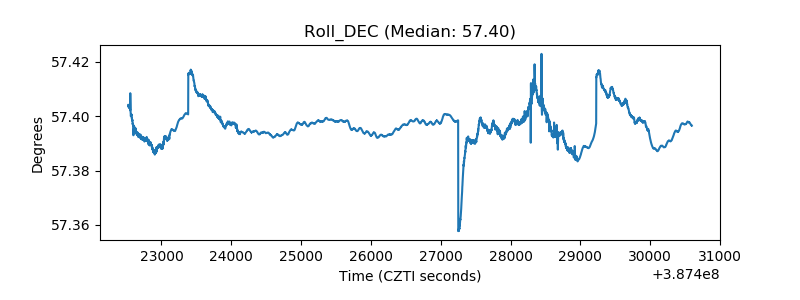 |
| _Roll_RA | 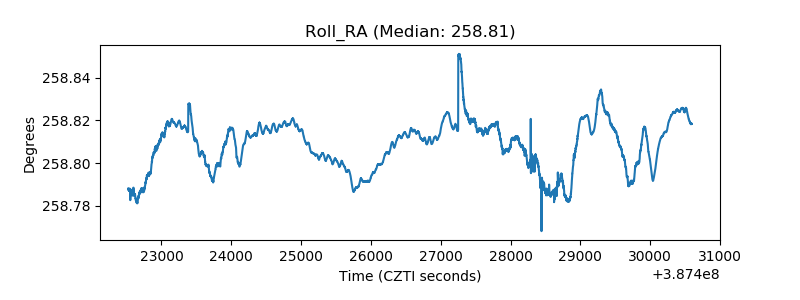 |
| Veto Counter | 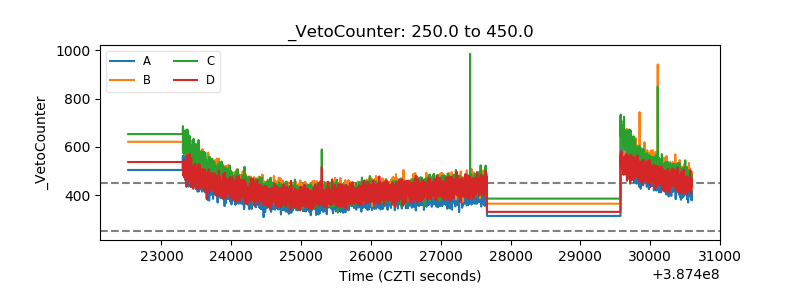 |