| Param | Original file | Final file |
|---|---|---|
| Filename | modeM0/AS1A11_093T01_9000005064_35344cztM0_level2.evt | modeM0/AS1A11_093T01_9000005064_35344cztM0_level2_quad_clean.evt |
| Size (bytes) | 496,661,760 | 83,424,960 |
| Size | 473.7 MB | 79.6 MB |
| Events in quadrant A | 2,925,398 | 522,297 |
| Events in quadrant B | 3,955,923 | 523,733 |
| Events in quadrant C | 3,556,388 | 543,112 |
| Events in quadrant D | 4,189,303 | 510,688 |
| Mode M0 | |||
|---|---|---|---|
| Quadrant | BADHDUFLAG | Total packets | Discarded packets |
| A | 0 | 12743 | 3 |
| B | 0 | 15704 | 2 |
| C | 0 | 14343 | 2 |
| D | 0 | 16569 | 2 |
| Mode SS | |||
|---|---|---|---|
| Quadrant | BADHDUFLAG | Total packets | Discarded packets |
| A | 0 | 128 | 0 |
| B | 0 | 128 | 0 |
| C | 0 | 128 | 0 |
| D | 0 | 128 | 0 |
| Mode M9 | |||
|---|---|---|---|
| Quadrant | BADHDUFLAG | Total packets | Discarded packets |
| A | 0 | 32 | 0 |
| B | 0 | 32 | 0 |
| C | 0 | 32 | 0 |
| D | 0 | 32 | 0 |
| Quadrant | Total seconds | Saturated seconds | Saturation percentage |
|---|---|---|---|
| A | 6100 | 28 | 0.459016% |
| B | 6100 | 359 | 5.885246% |
| C | 6100 | 147 | 2.409836% |
| D | 6100 | 126 | 2.065574% |
Noise dominated data is calculated using 1-second bins in cleaned event files. If a bin has >2000 counts, and if more than 50% of those come from <1% of pixels, then it is considered to be noise-dominated and hence unusable.
| Quadrant | # 1 sec bins | Bins with >0 counts | Bins with >2000 counts | High rate bins dominated by noise | Noise dominated (total time) | Noise dominated (detector-on time) | Marked lightcurve |
|---|---|---|---|---|---|---|---|
| A | 9325 | 6102 | 14 | 14 | 0.15% | 0.23% | 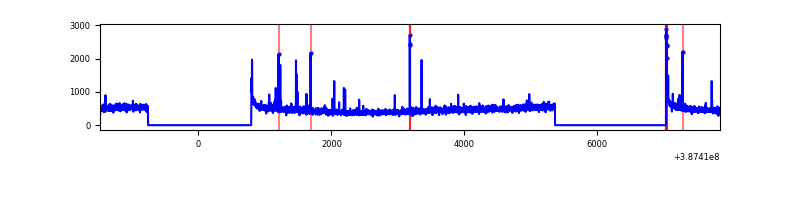 |
| B | 9325 | 6102 | 268 | 268 | 2.87% | 4.39% | 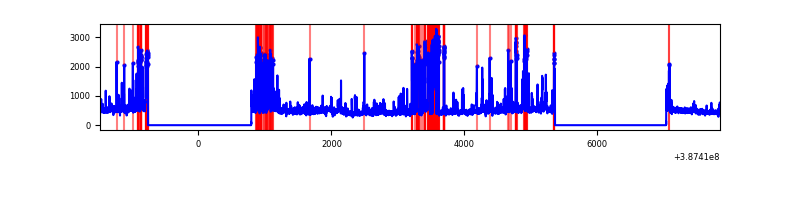 |
| C | 9325 | 6102 | 111 | 111 | 1.19% | 1.82% | 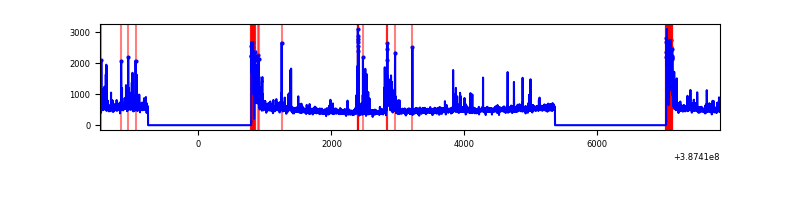 |
| D | 9325 | 6102 | 86 | 86 | 0.92% | 1.41% | 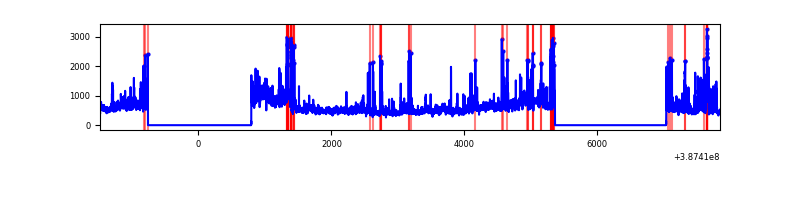 |
Top three noisy pixels from each quadrant. If the there are fewer than three noisy pixels in the level2.evt file, extra rows are filled as -1
| Pixel properties | Quadrant properties | ||||||
|---|---|---|---|---|---|---|---|
| Quadrant | DetID | PixID | Counts | Sigma | Mean | Median | Sigma |
| A | 10 | 83 | 110265 | 770.44 | 697 | 683 | 142.2 |
| A | 9 | 143 | 47570 | 329.65 | 697 | 683 | 142.2 |
| A | 8 | 192 | 28510 | 195.64 | 697 | 683 | 142.2 |
| B | 5 | 236 | 889756 | 6879.22 | 678 | 659 | 129.2 |
| B | 5 | 172 | 337939 | 2609.64 | 678 | 659 | 129.2 |
| B | 15 | 85 | 19687 | 147.23 | 678 | 659 | 129.2 |
| C | 0 | 10 | 567557 | 3603.95 | 679 | 685 | 157.3 |
| C | 15 | 214 | 248944 | 1578.33 | 679 | 685 | 157.3 |
| C | 1 | 23 | 33180 | 206.59 | 679 | 685 | 157.3 |
| D | 7 | 223 | 353630 | 2151.63 | 674 | 655 | 164.0 |
| D | 8 | 195 | 333986 | 2031.89 | 674 | 655 | 164.0 |
| D | 1 | 52 | 304891 | 1854.53 | 674 | 655 | 164.0 |
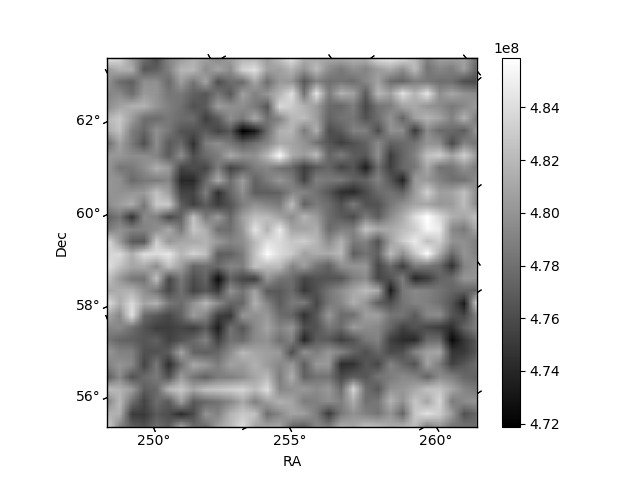
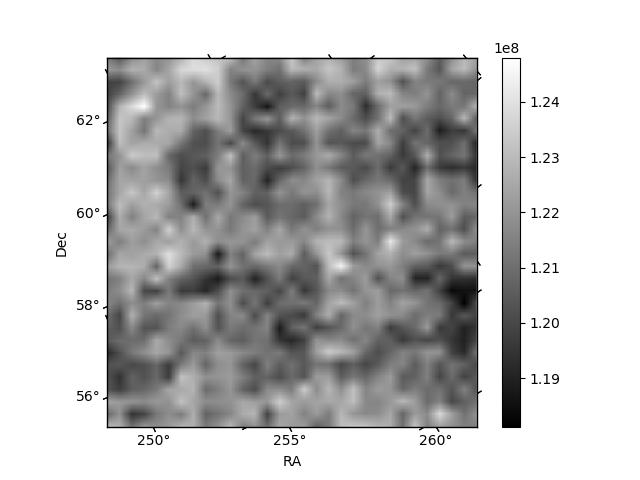
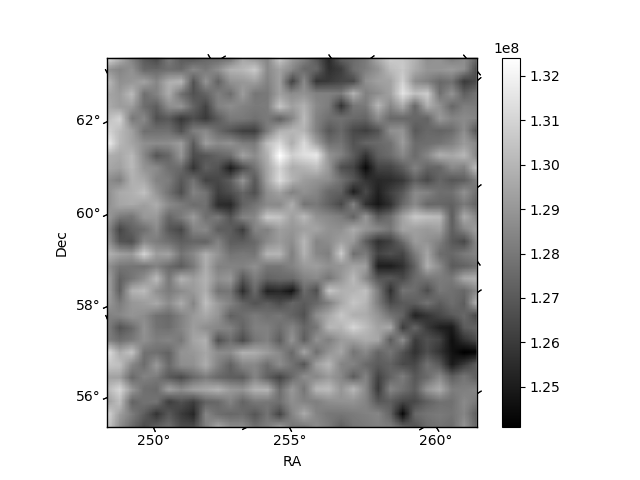
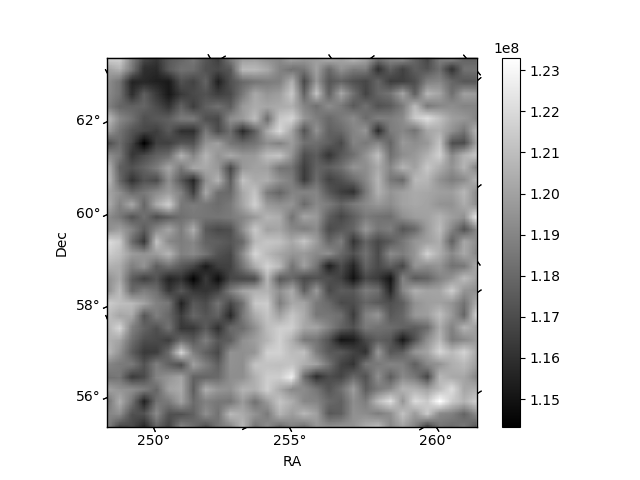
Histogram calculated using DETX and DETY for each event in the final _common_clean file
| Quadrant A | 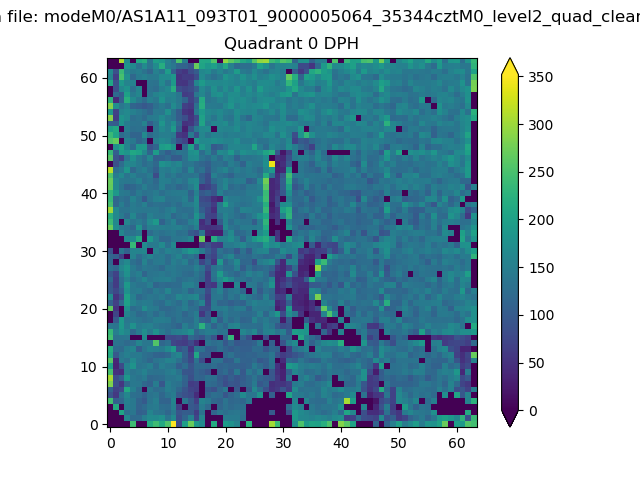 |
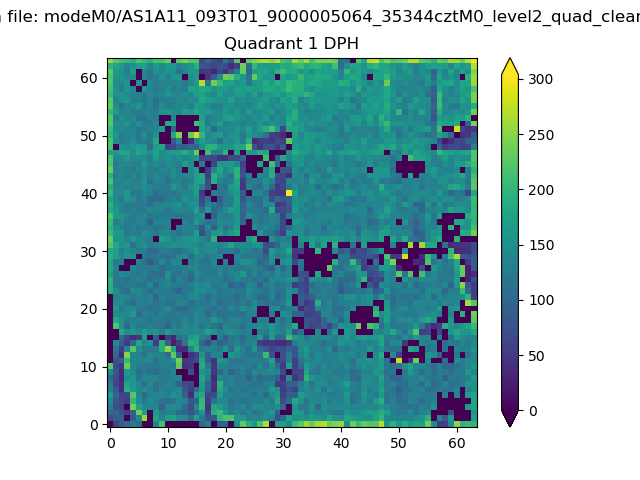 |
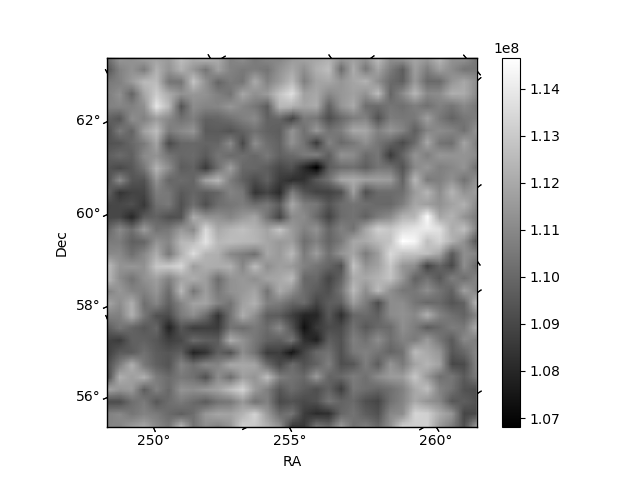
Quadrant B |
|---|---|---|---|
| Quadrant D | 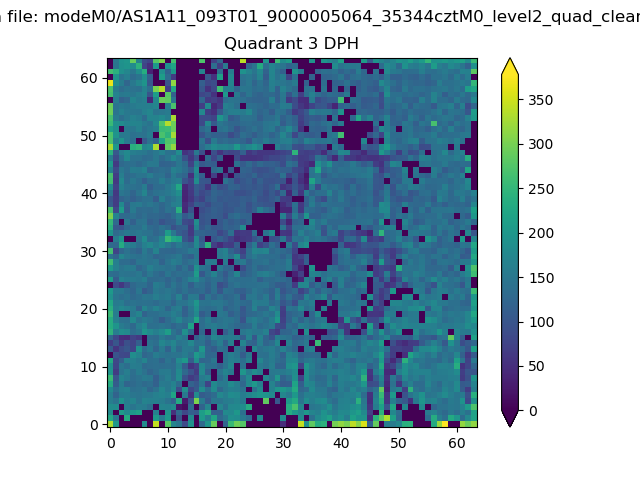 |
 |
Quadrant C |
| Plot type | Count rate plots | Images |
|---|---|---|
| Comparison with Poisson distribution Blue bars denote a histogram of data divided into 1 sec bins. Red curve is a Poisson curve with rate = median count rate of data. |
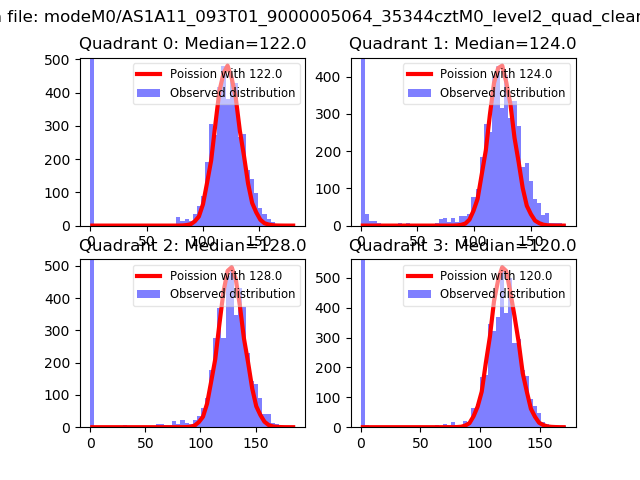 |
 |
| Quadrant-wise count rates Data is divided into 100 sec bins |
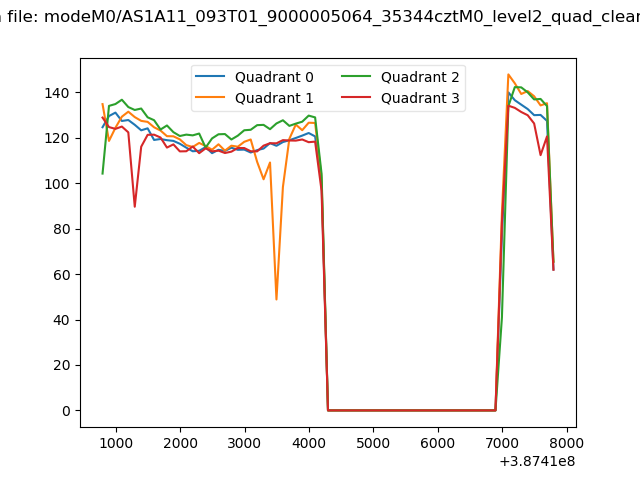 |
|
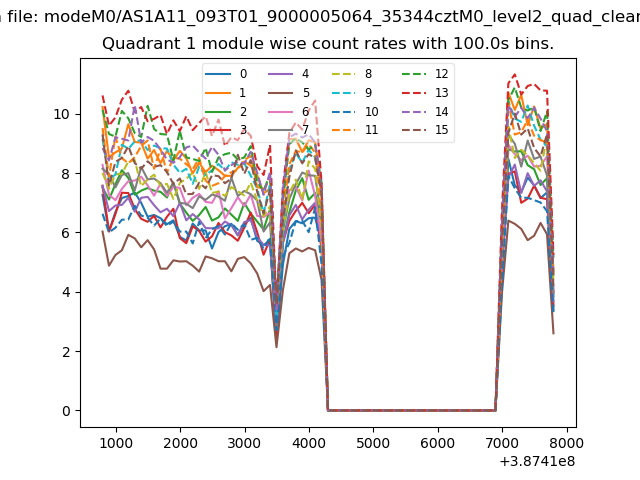
| Module-wise count rates for Quadrant A Data is divided into 100 sec bins |
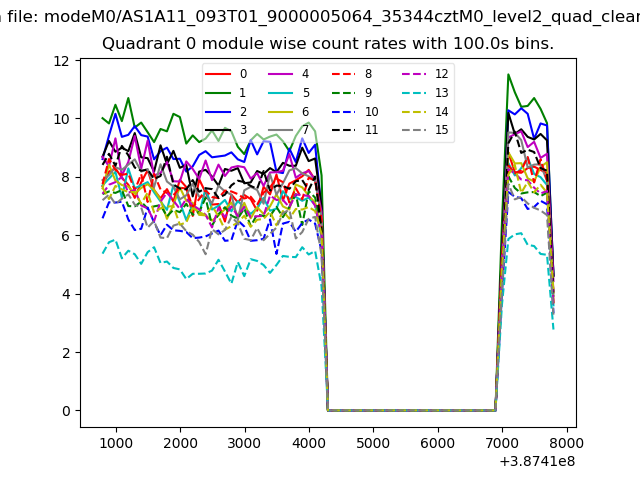 |
 |
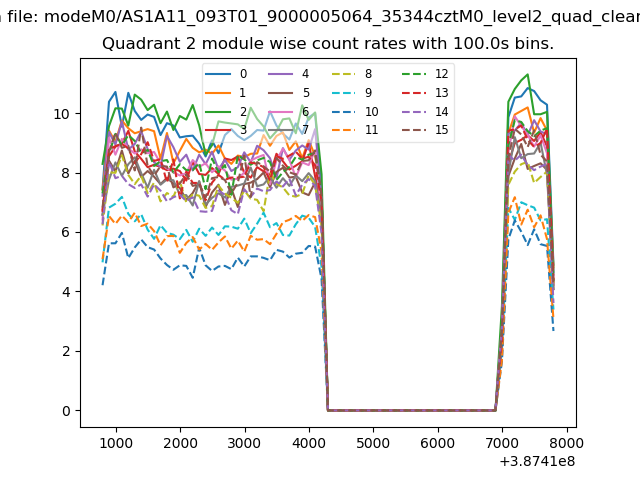
| Module-wise count rates for Quadrant B Data is divided into 100 sec bins |
 |
 |
| Module-wise count rates for Quadrant C Data is divided into 100 sec bins |
 |
 |
| Module-wise count rates for Quadrant D Data is divided into 100 sec bins |
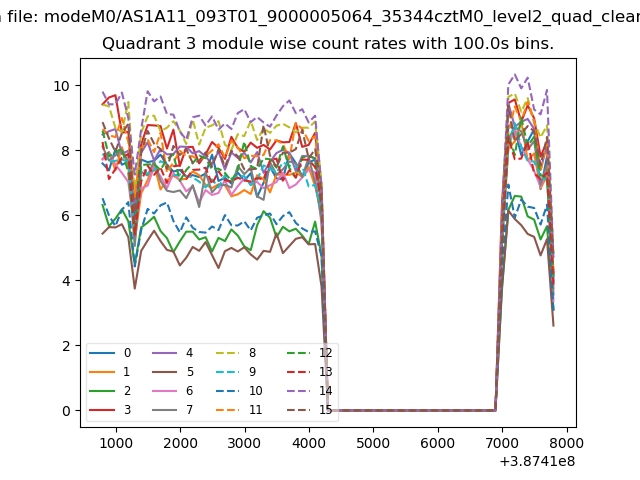 |
 |
| Parameter | Plot |
|---|---|
| CZT HV Monitor | 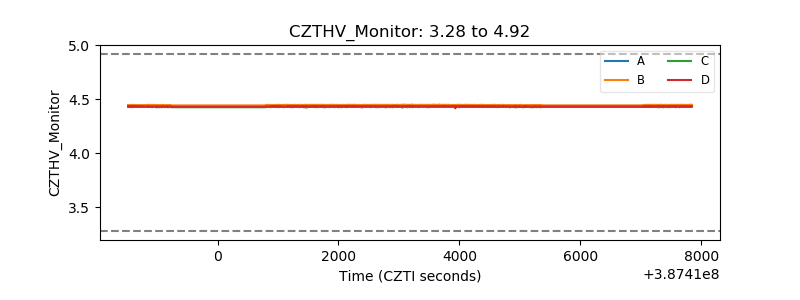 |
| D_VDD | 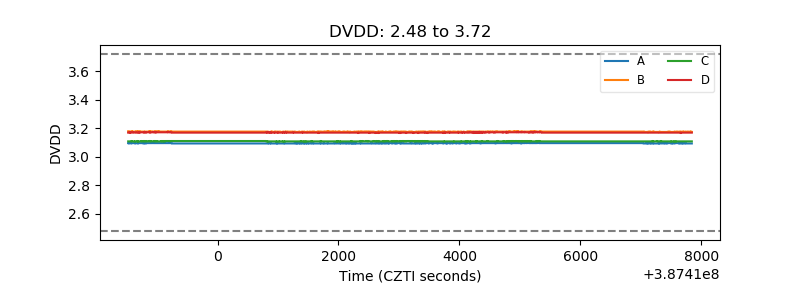 |
| Temperature 1 | 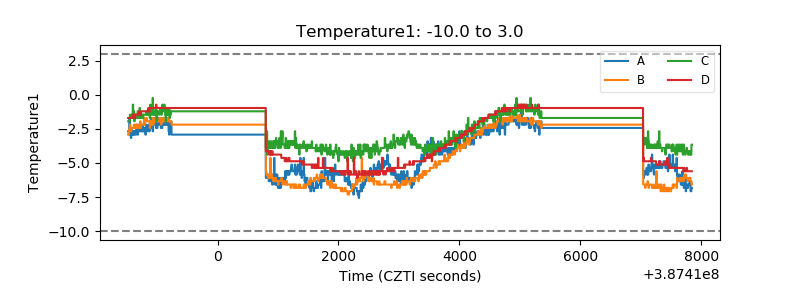 |
| Veto HV Monitor | 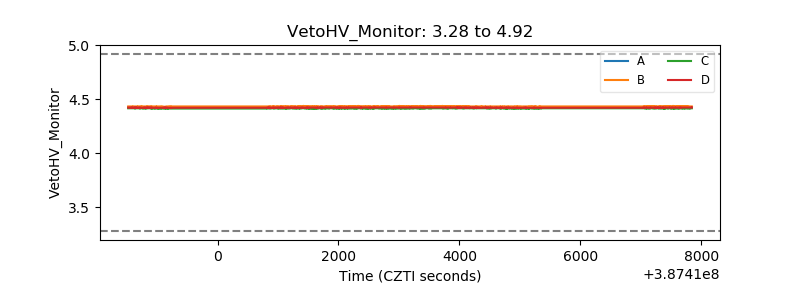 |
| Veto LLD | 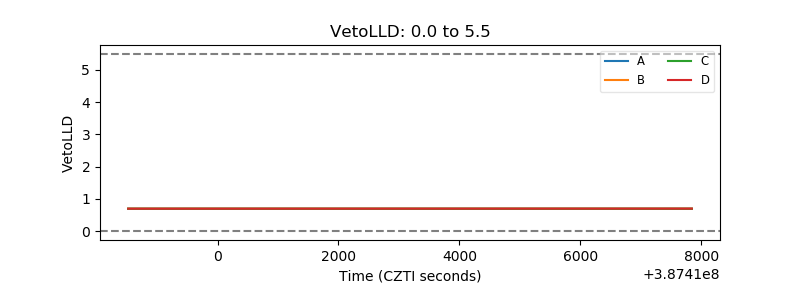 |
| Alpha Counter | 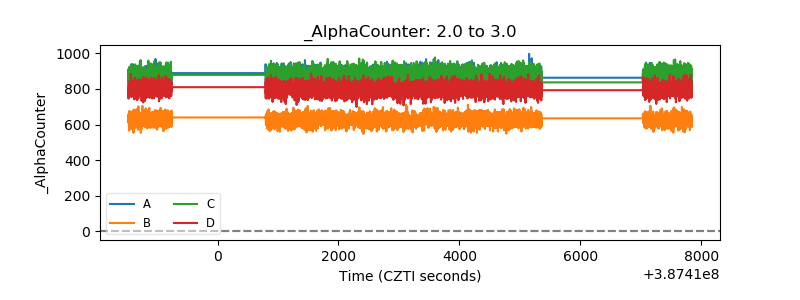 |
| _CPM_Rate | 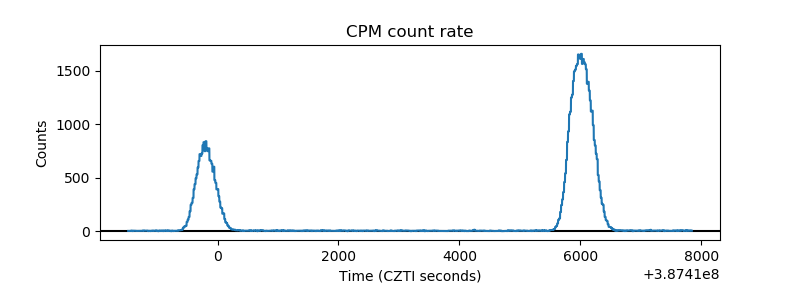 |
| CZT Counter | 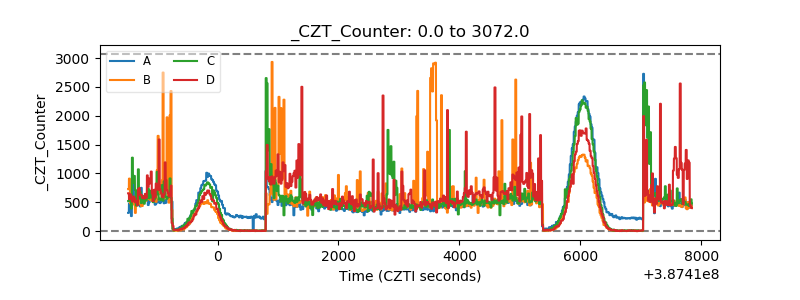 |
| +2.5 Volts monitor | 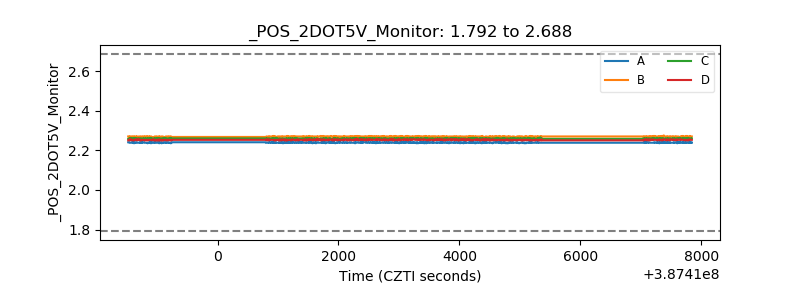 |
| +5 Volts monitor | 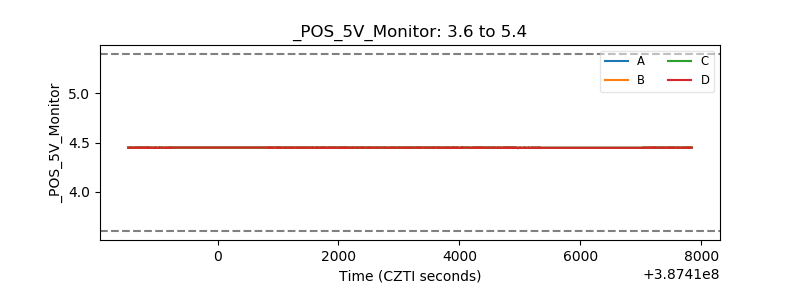 |
| _ROLL_ROT | 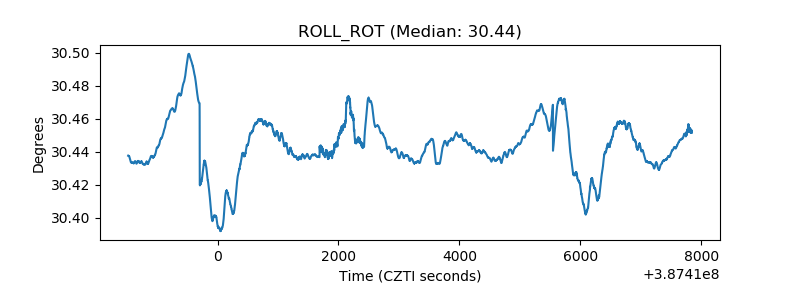 |
| _Roll_DEC | 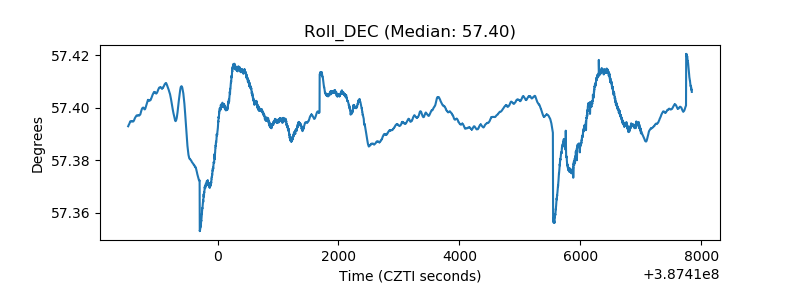 |
| _Roll_RA | 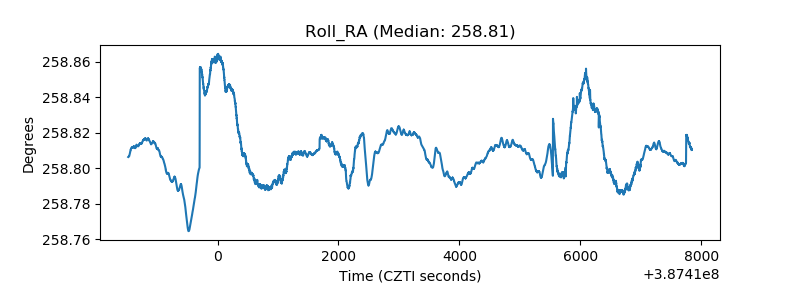 |
| Veto Counter | 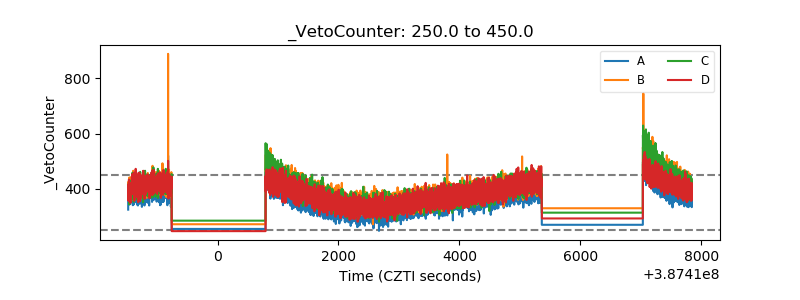 |