| Param | Original file | Final file |
|---|---|---|
| Filename | modeM0/AS1A11_093T01_9000005064_35338cztM0_level2.evt | modeM0/AS1A11_093T01_9000005064_35338cztM0_level2_quad_clean.evt |
| Size (bytes) | 547,369,920 | 64,399,680 |
| Size | 522.0 MB | 61.4 MB |
| Events in quadrant A | 2,780,150 | 397,612 |
| Events in quadrant B | 6,114,097 | 365,303 |
| Events in quadrant C | 3,172,833 | 402,922 |
| Events in quadrant D | 4,125,446 | 386,821 |
| Mode M0 | |||
|---|---|---|---|
| Quadrant | BADHDUFLAG | Total packets | Discarded packets |
| A | 0 | 11881 | 3 |
| B | 0 | 22016 | 2 |
| C | 0 | 12735 | 2 |
| D | 0 | 16151 | 2 |
| Mode SS | |||
|---|---|---|---|
| Quadrant | BADHDUFLAG | Total packets | Discarded packets |
| A | 0 | 116 | 0 |
| B | 0 | 116 | 0 |
| C | 0 | 116 | 0 |
| D | 0 | 116 | 0 |
| Mode M9 | |||
|---|---|---|---|
| Quadrant | BADHDUFLAG | Total packets | Discarded packets |
| A | 0 | 24 | 0 |
| B | 0 | 24 | 0 |
| C | 0 | 24 | 0 |
| D | 0 | 25 | 0 |
| Quadrant | Total seconds | Saturated seconds | Saturation percentage |
|---|---|---|---|
| A | 5675 | 24 | 0.422907% |
| B | 5675 | 1066 | 18.784141% |
| C | 5675 | 100 | 1.762115% |
| D | 5675 | 219 | 3.859031% |
Noise dominated data is calculated using 1-second bins in cleaned event files. If a bin has >2000 counts, and if more than 50% of those come from <1% of pixels, then it is considered to be noise-dominated and hence unusable.
| Quadrant | # 1 sec bins | Bins with >0 counts | Bins with >2000 counts | High rate bins dominated by noise | Noise dominated (total time) | Noise dominated (detector-on time) | Marked lightcurve |
|---|---|---|---|---|---|---|---|
| A | 7256 | 5674 | 18 | 18 | 0.25% | 0.32% | 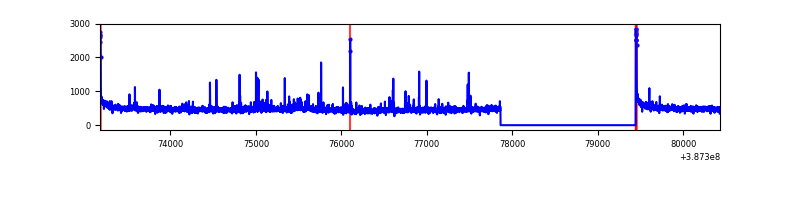 |
| B | 7256 | 5675 | 789 | 789 | 10.87% | 13.90% | 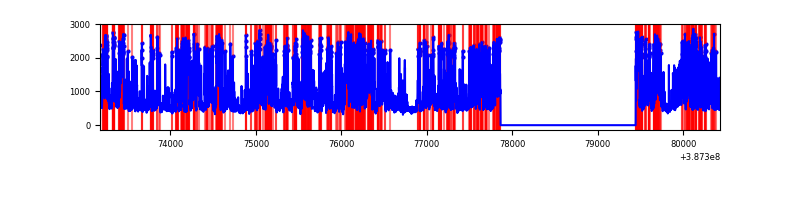 |
| C | 7256 | 5674 | 93 | 93 | 1.28% | 1.64% | 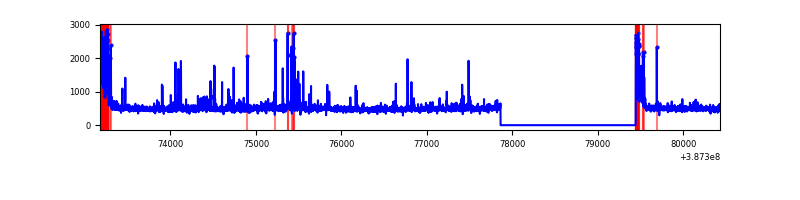 |
| D | 7257 | 5676 | 193 | 193 | 2.66% | 3.40% | 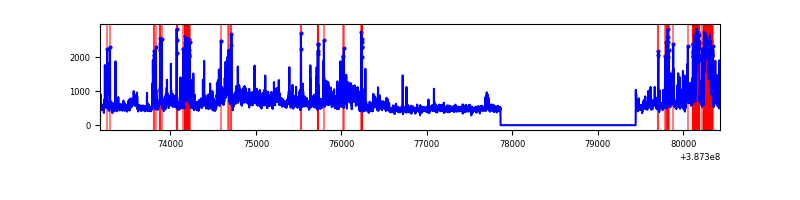 |
Top three noisy pixels from each quadrant. If the there are fewer than three noisy pixels in the level2.evt file, extra rows are filled as -1
| Pixel properties | Quadrant properties | ||||||
|---|---|---|---|---|---|---|---|
| Quadrant | DetID | PixID | Counts | Sigma | Mean | Median | Sigma |
| A | 10 | 83 | 105410 | 799.76 | 649 | 635 | 131.0 |
| A | 14 | 254 | 41750 | 313.84 | 649 | 635 | 131.0 |
| A | 8 | 192 | 36800 | 276.05 | 649 | 635 | 131.0 |
| B | 5 | 236 | 2325388 | 20415.31 | 600 | 585 | 113.9 |
| B | 5 | 172 | 1297758 | 11391.15 | 600 | 585 | 113.9 |
| B | 4 | 232 | 92322 | 805.59 | 600 | 585 | 113.9 |
| C | 0 | 10 | 368543 | 2508.79 | 629 | 633 | 146.6 |
| C | 15 | 214 | 234876 | 1597.31 | 629 | 633 | 146.6 |
| C | 1 | 23 | 89116 | 603.37 | 629 | 633 | 146.6 |
| D | 8 | 195 | 856587 | 5605.21 | 624 | 604 | 152.7 |
| D | 10 | 118 | 255020 | 1665.98 | 624 | 604 | 152.7 |
| D | 12 | 233 | 239124 | 1561.89 | 624 | 604 | 152.7 |
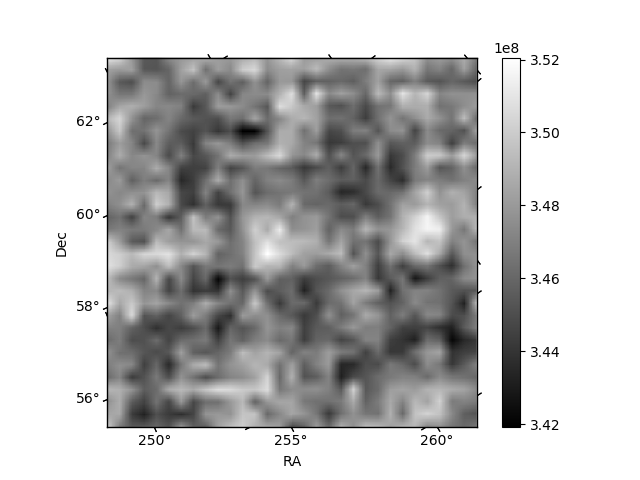
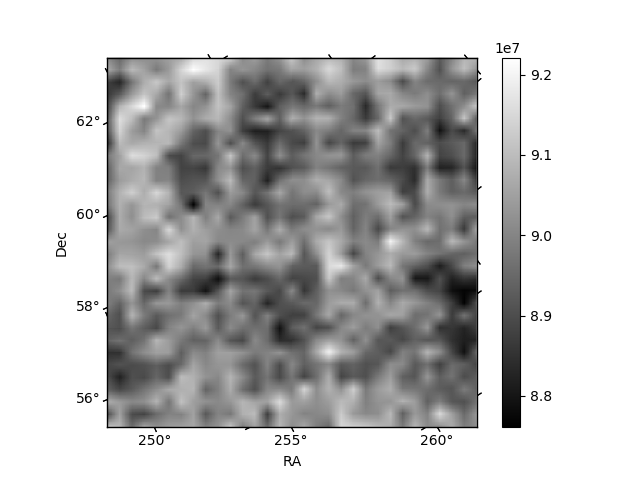
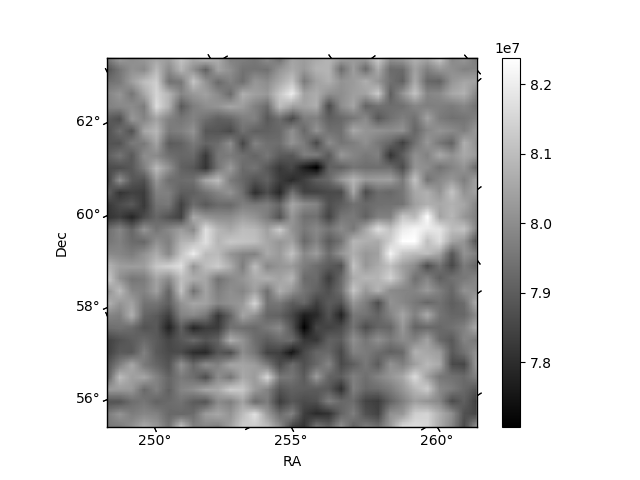
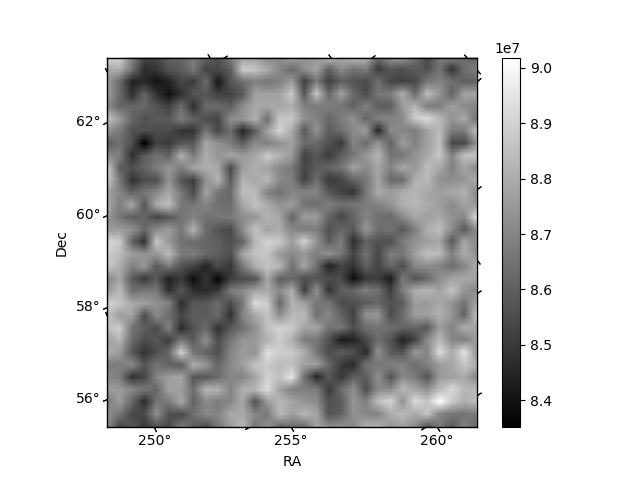
Histogram calculated using DETX and DETY for each event in the final _common_clean file
| Quadrant A | 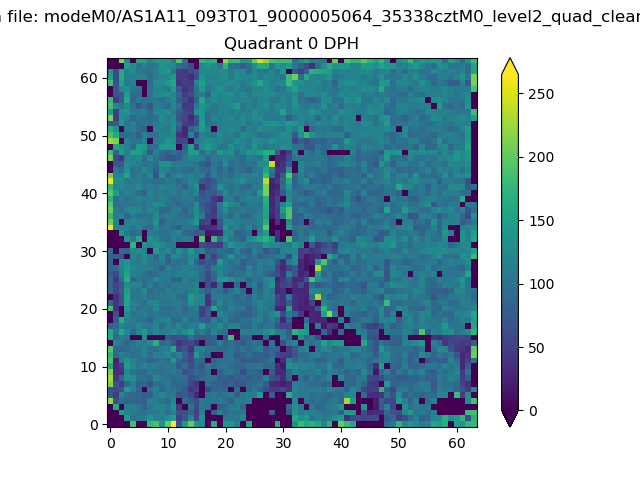 |
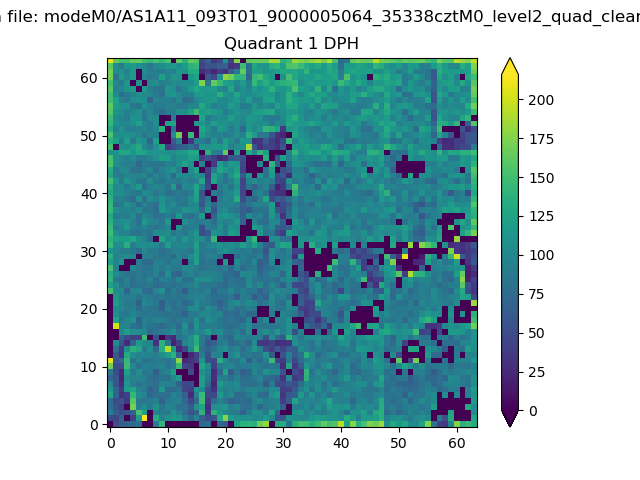 |
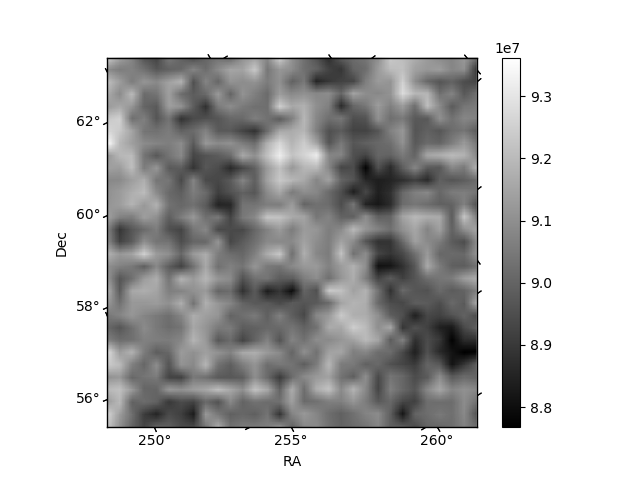
Quadrant B |
|---|---|---|---|
| Quadrant D | 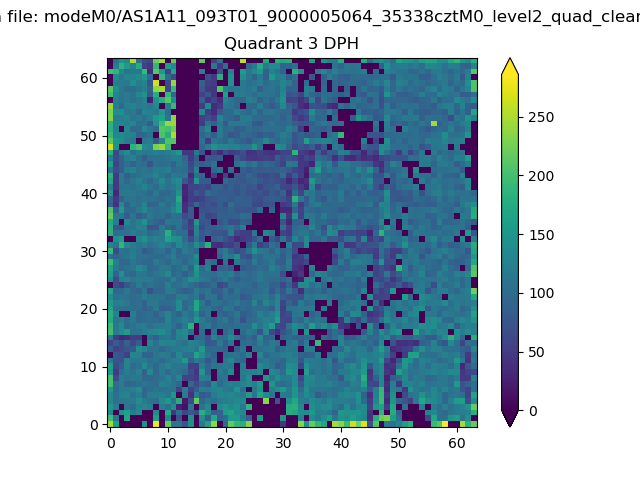 |
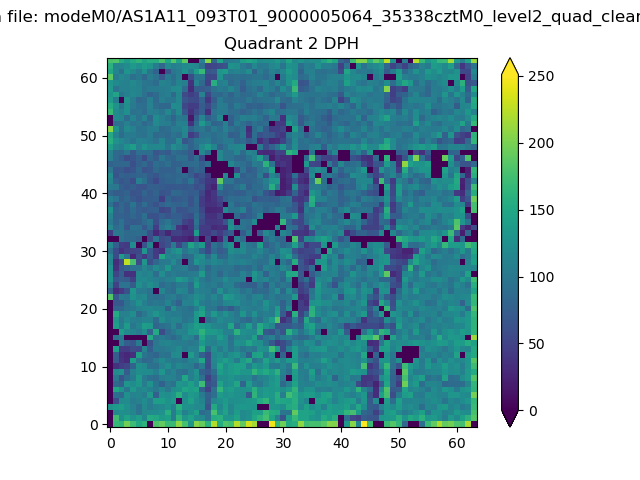 |
Quadrant C |
| Plot type | Count rate plots | Images |
|---|---|---|
| Comparison with Poisson distribution Blue bars denote a histogram of data divided into 1 sec bins. Red curve is a Poisson curve with rate = median count rate of data. |
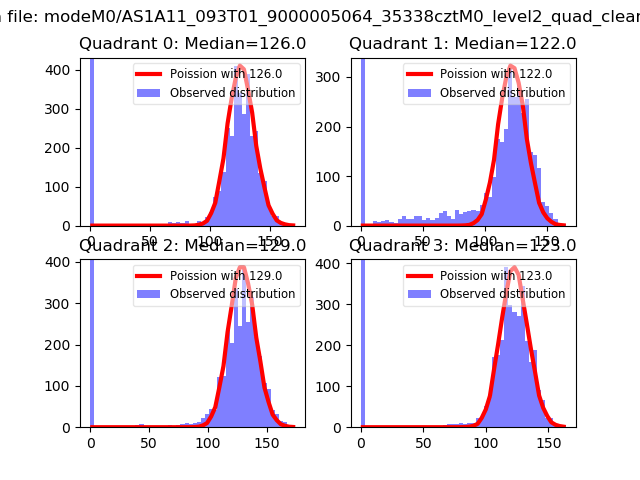 |
 |
| Quadrant-wise count rates Data is divided into 100 sec bins |
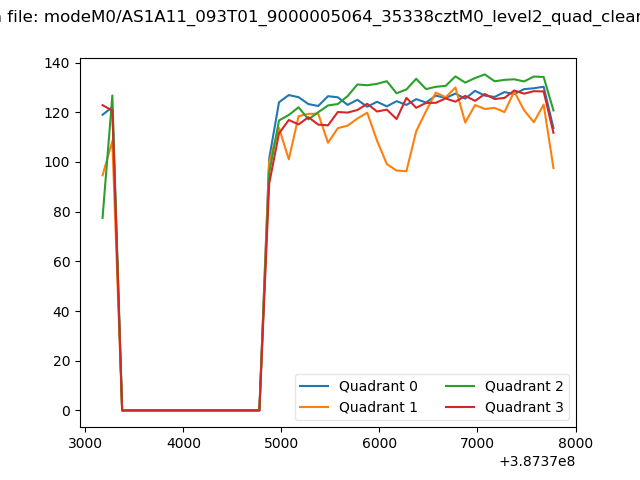 |
|
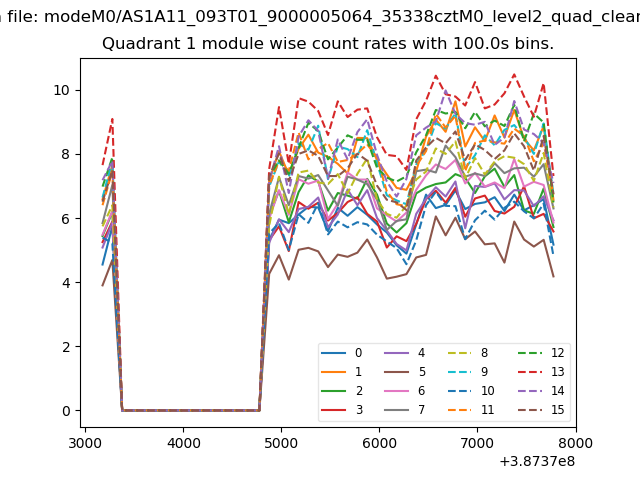
| Module-wise count rates for Quadrant A Data is divided into 100 sec bins |
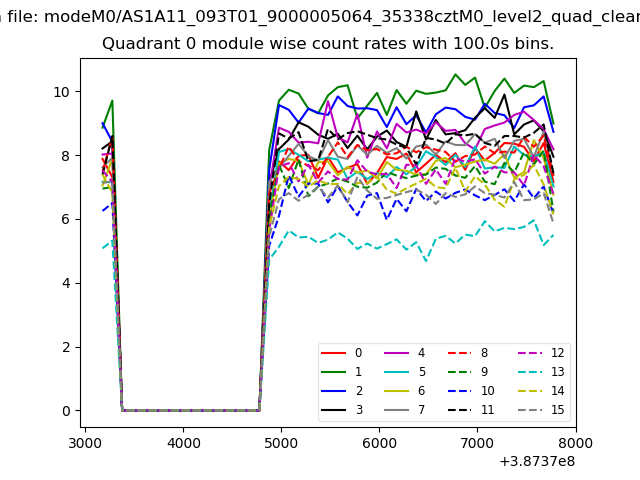 |
 |
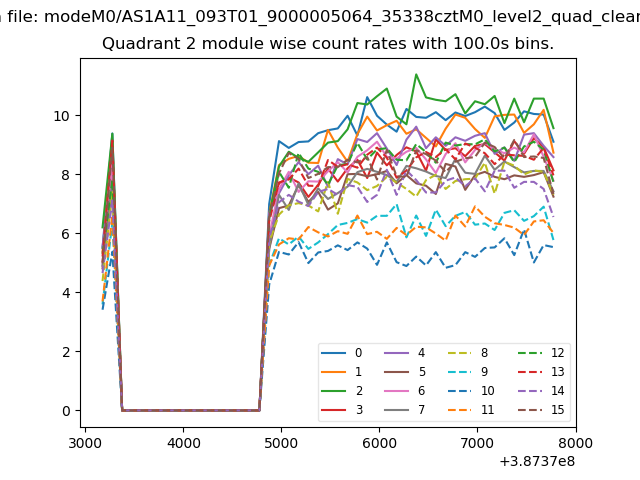
| Module-wise count rates for Quadrant B Data is divided into 100 sec bins |
 |
 |
| Module-wise count rates for Quadrant C Data is divided into 100 sec bins |
 |
 |
| Module-wise count rates for Quadrant D Data is divided into 100 sec bins |
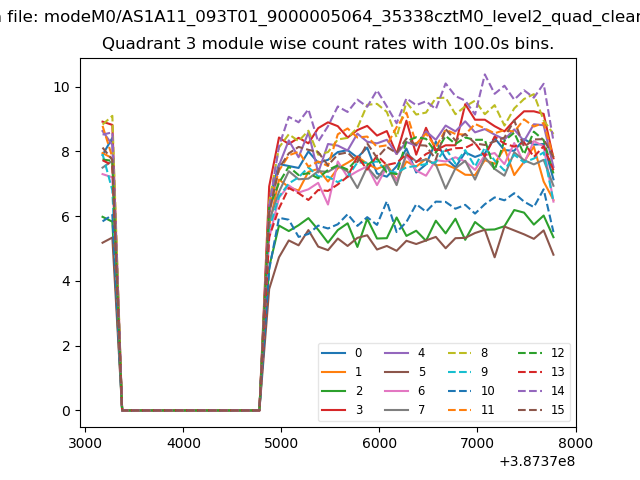 |
 |
| Parameter | Plot |
|---|---|
| CZT HV Monitor | 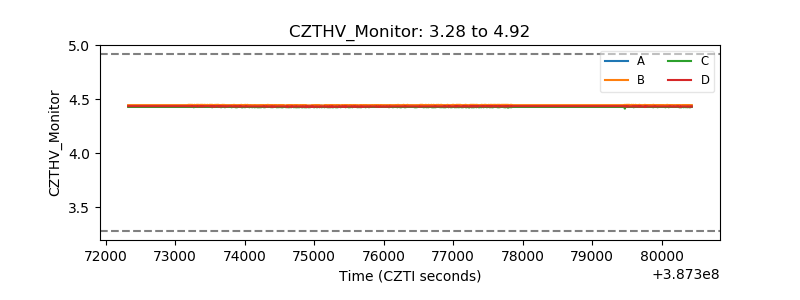 |
| D_VDD | 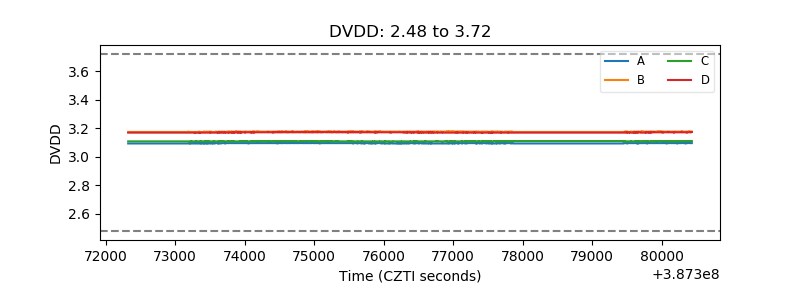 |
| Temperature 1 | 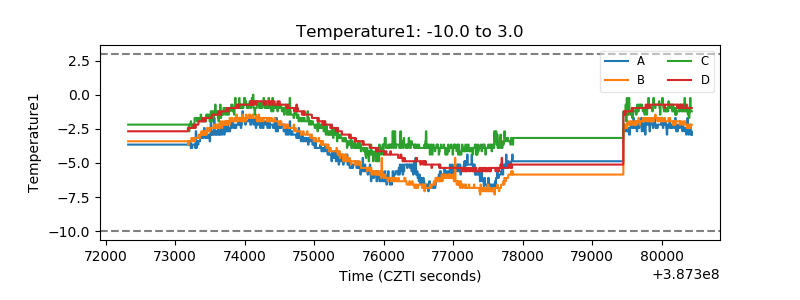 |
| Veto HV Monitor | 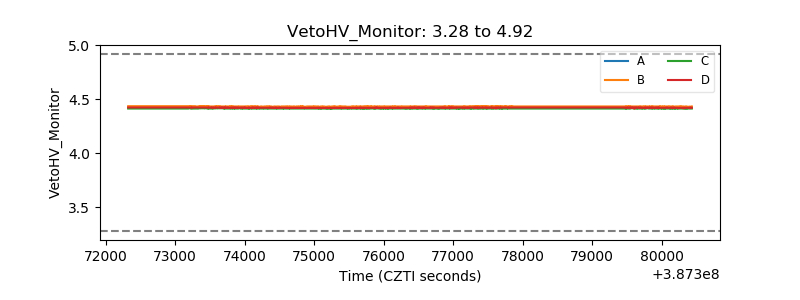 |
| Veto LLD | 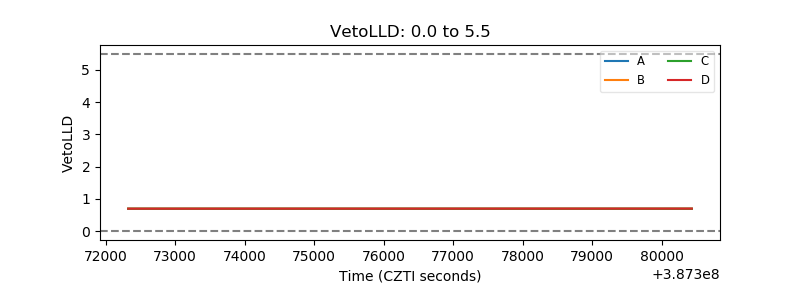 |
| Alpha Counter | 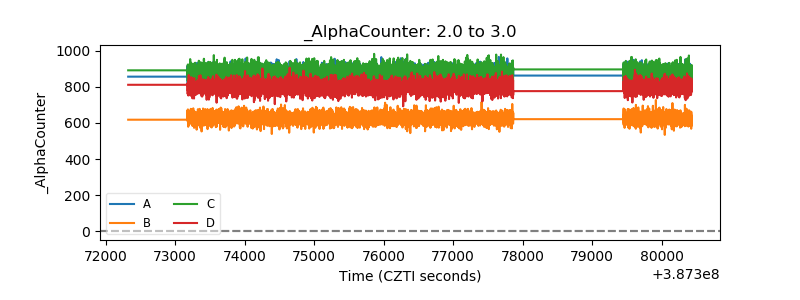 |
| _CPM_Rate | 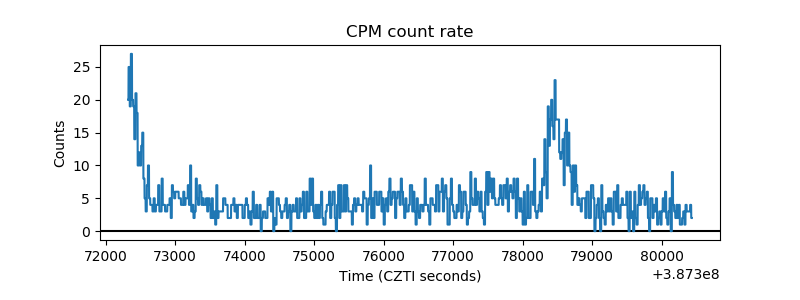 |
| CZT Counter | 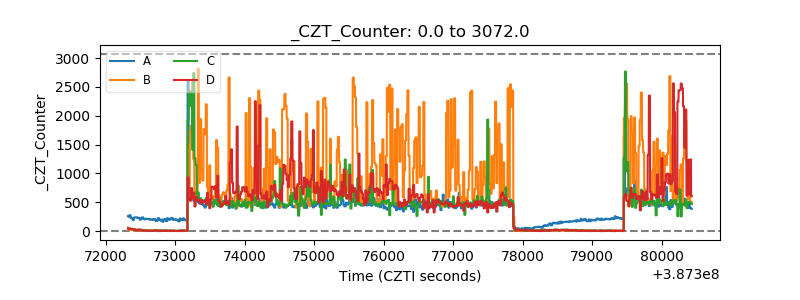 |
| +2.5 Volts monitor | 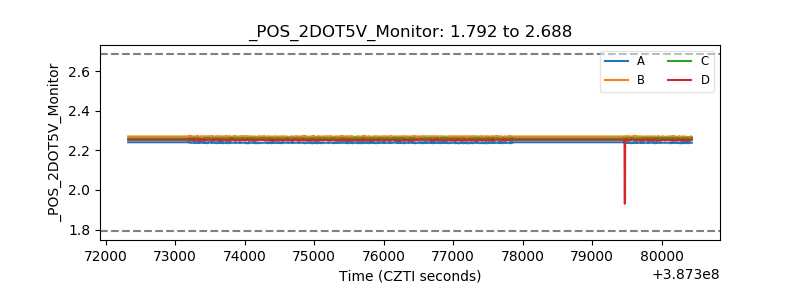 |
| +5 Volts monitor | 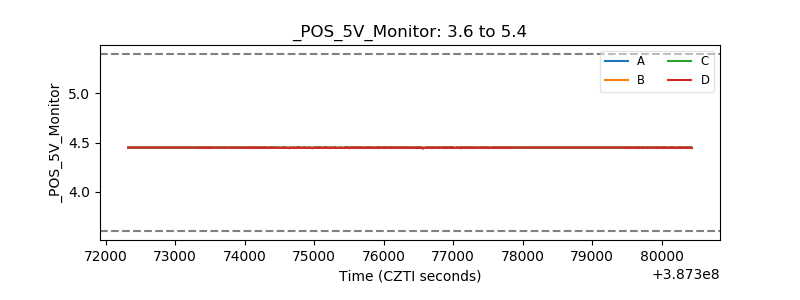 |
| _ROLL_ROT | 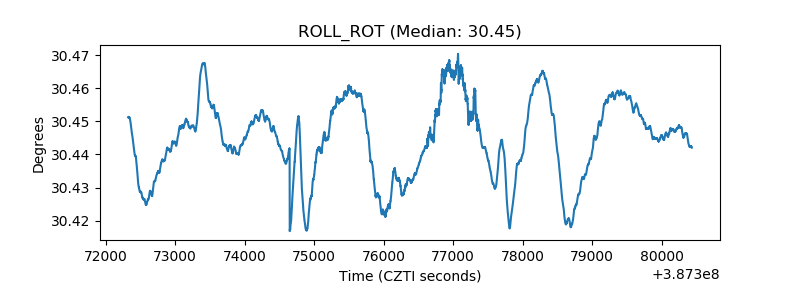 |
| _Roll_DEC | 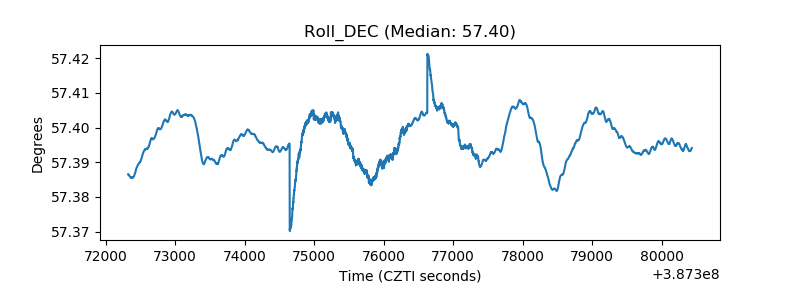 |
| _Roll_RA | 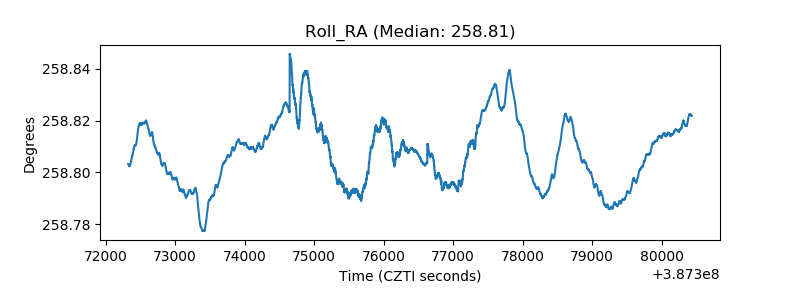 |
| Veto Counter | 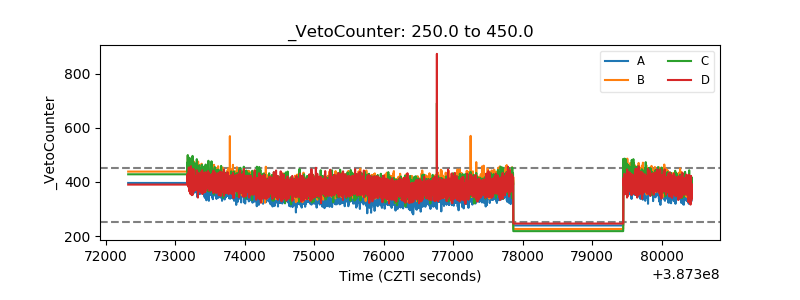 |